We use cookies
This website uses cookies to provide better user experience and user's session management. By continuing visiting this website you consent the use of these cookies.

ChartExpo Survey

How to Conduct Comparative Analysis? Guide with Examples
Evaluating the differences and similarities in your data is one of the most straightforward analyses you can ever conduct.

You only need to compare data points side-by-side.
It gets better.
One of the comparative analysis example strategies we recommend is using charts and graphs.
Our brains process visual data 60,000 times faster than texts and figures. And this creates a concrete argument for using comparison-oriented charts and graphs, such as Matrix and Radar Graphs.
These charts are amazingly easy to read and interpret.
Excel is one of the freemium tools you can use to visualize your data for insights. But it lacks ready-to-go graphs for conducting a comparative analysis, such as Radar Chart.
You don’t have to dump Excel for other expensive data visualization tools.
You can supercharge your Excel by installing a particular add-in to access ready-made graphs for comparative analysis.
You don’t want to miss this.
In this blog, you’ll learn:
- How to conduct comparative analysis using our easy-to-follow steps?
- We’ll take you through comparative analysis examples.
- What is comparative analysis?
- The tested and recommended Comparative Charts.
- We’ll recommend the proven add-in to install to access ready-made graphs for comparative analysis.
How to Conduct Comparative Analysis? (Easy Steps)
Before jumping right into the how-to guide, we’ll address the following question: what is comparative analysis?
What is Comparative Analysis?
Definition : Comparison analysis is a methodology that entails comparing data variables to one another for similarities and differences.
Conducting a comparative analysis can help you understand the problem in-depth and form strategies. More so, you can efficiently conduct this analysis to investigate data points with noticeable differences and commonalities.
Car factories can leverage this analysis to examine two production processes to determine cost-effectiveness.
In the education section, policymakers can use comparative analysis to compare the efficacy of different curriculums.
Other practical uses of comparative analysis include:
- Evaluating emerging opportunities versus risks among micro and small
- Comparing performance relative to the competition.
- Compare revenue versus costs in your business.
Comparative analysis is critical to your data storytelling. In other words, you can use this methodology to create compelling narratives for your audience. Let’s check out the benefits of the analysis.
Why is Comparative Analysis Important?
Comparative analysis is important to better understand the problem and answer related questions. The main goals companies try to achieve by comparing records, documents or processes are:
Keep up with Your Competition’s Every Move
You can quickly evaluate the competition for more insights by conducting a comparative analysis.
Establish What’s Working and What’s Not
It’s very important for you to know what’s working well and what is not working well for you if your goal is to maximize returns and cut costs in the long term. So, flexibility and quickness in adopting changes are vital. The longer you take, the less valuable these improvements become. Besides, you risk losing your market to the competition.
Save Time and Resources
Comparative analysis helps you save time and valuable resources by providing a versatile way of comparing data using easy-to-read charts and graphs.
Explore Opportunities using Data
Comparative analysis helps you explore valuable opportunities in your data that are constantly appearing.
Real-Life Examples of Comparative Analysis
Data analysts in weather stations use comparison-based charts, such as Line Charts and Bar Charts , to compare weather patterns across different periods.
Recession Indicators
Federal and central banks worldwide use comparison charts to closely follow the global economy’s performance. Growth is depicted by two consecutive peaks of the line curve.
On the other hand, two consecutive trough quarters in a year are a sign recession is on the corner.

The Tested and Recommended Comparison Charts
For you to conduct a comparative analysis, you need different types of comparison charts and graphs. Yes, because we interpret visual data faster than text and figures.
We’ve put together a list of comparison-based charts and graphs you’ve to try.
Comparison Bar Chart
A Comparison Bar Chart is one of the best charts you can use to draw comparative analysis examples.
Remember, drawing comparisons is something that humans do naturally. So, by conducting comparative analysis using charts, you gain far more insights than relying on intuition or mere observation. This chart is the go-to if your goal is to compare two or more data sets or items within the same data set.
The key objective of this comparative chart is to help you visually depict data side by side, allowing you to see how data points stack up against one another.

Matrix Charts
Matrix Chart is a Comparison Chart example you can use to display relationships in your dataset, irrespective of the complexity. The chart has a grid-like format to display insights into relationships between two or more variables.
The Matrix Chart is effective at displaying many-to-many relationships in data. In other words, you can draw comparisons insights into multiple groups or specific components in your data.

Multi Axis Comparison Line Graph
A Multi Axis Line Graph function uses two y-axes. And this gives you more flexibility to use one chart to display more insights using limited space.
You can easily visualize data with varying metrics because the chart has two different scales.

How to Conduct Comparative Analysis Using Charts with Examples?
Comparative analysis is a form of analysis that entails comparing a data point against others. One of the standard tools for conducting comparative analysis uses charts, graphs, and maps in Excel.
But, the spreadsheet application lacks ready-made Comparative Charts.
We’re not advising you to do away with Excel in favor of other expensive tools.
And this is because there’s an amazingly affordable visualization tool that comes as an add-in you can easily install in Excel to access insightful and easy-to-customize Comparison-based charts . The application is called ChartExpo.
What is ChartExpo?
ChartExpo is an add-in you can easily install in your Excel to access ready-made and visually appealing Comparative Charts in Excel , such as Multi Axis Line and Radar Charts .
Features and benefits
- You have maximum freedom to customize your charts and graphs to your liking.
- You don’t need sophisticated design or coding skills to generate stunning, insightful charts for your stories. Save time with this drag-and-drop application.
- The tool has many templates to ensure a wider selection of charts. And this means you don’t have to waste time moving from one tool to another looking for charts.
- With just a few clicks, you can turn overwhelming tables and spreadsheets into stunning, insightful charts and graphs.
- ChartExpo comes with a free 7-day trial. Essentially, if you’re unsatisfied with the tool within a week, you can opt-out as easily as signing up for a trial.
In the coming section, we’ll take you through how to visualize data using Multi Axis Chart using ChartExpo add-in.
You don’t want to miss this!

This section will use a Multi Axis Line Graph (one of the Comparative Analysis Charts) to display insights into the table below.
To get started with ChartExpo in Excel, follow the steps below:
- Open your Excel desktop application.
- Open the worksheet and click the Insert button to access the My Apps option.

- Select ChartExpo add-in and click the Insert button .

- In this case, look for “ Multi Axis Line Chart ” in the list of charts as shown below.

- Highlight your data and click the Create Chart From Selection button, as shown below.

- To edit the chart, click the Edit Chart button .

- Once the Chart Header Properties window shows, click the Line 1 button, and fill in your header.

- Toggle the small button below Line 2 to the right side.
- Click the Apply button .
- Check out the final chart below.
When is it most appropriate to use a secondary chart axis?
Charts with a secondary axis can help you emphasize the key data points within categories. More so, you can make comparisons between categories using a highly contrasting color scheme.
If you want to use limited space in your data visualization dashboard, your go-to visualization design should be a Multi Axis Line Chart.
What is the difference between a Dual Axis Chart and a Combined Axis Chart?
A Combined Axis Graph merges two or more measures into a single axis. And this means you can display insights into multiple variables using the same chart.
The Dual Axis Chart (one of the comparative analysis charts) comes with two y-axes and a single x-axis.

Investigating the differences and similarities in your data is one of the most straightforward analyses you can ever conduct. You only need to compare data points side-by-side.
One of the comparative analysis strategies we recommend is using charts and graphs.
Remember, our brains process visual data faster than texts and figures. And this creates a concrete argument for using comparison-oriented charts and graphs, such as Matrix and Radar Graphs.
How much did you enjoy this article?

Related articles
KPIs for Operations: Unlocking Operational Insights
Elevate your operational strategies with our in-depth analysis of key performance indicators for operations. Uncover actionable insights to enhance efficiency.
Creating Financial Models in Excel: What is it & Top Tricks
Empower yourself with our guide to Creating Financial Models in Excel. Uncover tips, streamline processes, & master the art of financial modeling for insights.
15 Recruitment KPIs to Guage Hiring Effectiveness
Delve into the realm of recruitment key performance indicators (KPIs) to optimize the process. Explore essential metrics, strategies, & insights for recruiter success.
Crafting Long-Term Financial Goals: Practical Examples
Unlock financial potential! This guide offers long-term financial goals examples with analysis to kick start planning. Set realistic goals & achieve financial security.
Cost Volume Profit (CVP) Chart: Analysis & Example
Maximize profitability with insightful cost volume profit chart analysis. Understand the relationship between costs, volume, and profit for better financial planning.
- Why Blitzllama?
Comparative analysis: An essential guide (with examples) 2024
Transform your decision-making approach with our essential guide on comparative analysis, featuring real-world examples for practical insights.
In product management, understanding comparative analysis is crucial. Many struggle with how to effectively compare options and make informed decisions. Product owners and managers often face challenges in discerning the best choices among alternatives.
This article provides a practical guide, offering clear examples and actionable strategies. By mastering comparative analysis, professionals can confidently assess features, prices, and functionalities. Through concise explanations and real-world scenarios, this guide empowers decision-makers to streamline their evaluation processes.
With the right tools and insights, product owners and managers can navigate complex decision-making tasks efficiently. Let's delve into the essentials of comparative analysis for informed and effective decision-making.
What is comparative analysis?
Comparative analysis involves comparing two or more items to identify similarities and differences. It helps product owners and managers make informed decisions. By analyzing various aspects such as features, performance, and costs, they can assess which option best suits their needs.
Comparative analysis enables objective evaluation, aiding in selecting the most effective solutions for their products or services. It involves gathering data, organizing it systematically, and drawing meaningful conclusions.
Through this process, product owners and managers can understand market trends, competitor strengths, and areas for improvement. Ultimately, comparative analysis empowers decision-making by providing clear insights into available options and their respective merits.
Now that we understand the basics of comparative analysis, let's explore why it's crucial for product owners to leverage this approach.
Why is comparative analysis important to product owners?
Product owners rely on comparative analysis to make informed decisions about their products. By comparing features, performance, and user feedback, product owners can enhance their offerings and stay competitive in the market:

1) Informed decision-making
Comparative analysis equips product owners with vital insights to make informed decisions. By evaluating competitors, product owners gain clarity on market trends and consumer preferences. They can identify gaps in their offerings and adapt strategies accordingly. This analysis guides decisions on features, pricing, and positioning, ensuring products meet customer needs effectively.
2) Resource allocation
Efficient resource allocation is paramount for product success. Through comparative analysis, product owners discern where to allocate resources for maximum impact. By evaluating competitors' strengths and weaknesses, they optimize resource distribution across development, marketing, and support functions. This ensures resources are utilized effectively, driving product performance and profitability.
3) Continuous improvement
Continuous improvement is fundamental in the competitive business landscape. Comparative analysis enables product owners to benchmark against industry standards and identify areas for enhancement. By evaluating competitors' innovations and customer feedback, they refine product features and user experience iteratively. This iterative process fosters continuous improvement, keeping products relevant and competitive in evolving markets.
4) Stakeholder communication
Effective stakeholder communication is vital for product success. Comparative analysis provides product owners with valuable insights to communicate effectively with stakeholders. By presenting competitive intelligence, they substantiate strategic decisions and gain stakeholders' confidence. Clear communication of market dynamics and competitive positioning fosters alignment among stakeholders, facilitating collective efforts towards product goals.
Understanding why comparative analysis is essential sets the stage for distinguishing it from competitive analysis. Let's dissect this difference in the upcoming section.
Comparative vs. competitive analysis—what’s the difference?
Comparative analysis and competitive analysis are two distinct approaches utilized by product owners and managers to evaluate their products and understand market dynamics. While both methods involve assessing various aspects of products and their market environment, they differ in the following aspects:
Now that we've clarified the disparity between comparative and competitive analysis, let's pinpoint when product owners should employ comparative analysis in their decision-making process.
When to use comparative analysis?
Product owners should utilize comparative analysis when assessing market trends, understanding customer preferences, or evaluating new features. Recognizing the right time to employ this method ensures strategic decision-making and product improvement:

1) Evaluating competitor products
Comparative analysis is crucial when evaluating competitor products. It helps product owners and managers understand how their offerings stack up against others in the market.
By comparing features, pricing, and performance metrics, businesses can identify competitive advantages and areas for improvement. This analysis enables informed decision-making and enhances strategic planning for staying ahead in the market.
2) Analyzing different marketing strategies
Comparative analysis is instrumental in analyzing different marketing strategies. By comparing the effectiveness of various approaches, product owners and managers can determine which strategies yield the highest return on investment.
This analysis involves evaluating metrics such as customer engagement, conversion rates, and brand visibility across different marketing channels. Through comparative analysis, businesses can optimize their marketing efforts and allocate resources more efficiently.
3) Assessing design approaches
Comparative analysis plays a crucial role in assessing design approaches. It allows product owners and managers to evaluate the user experience, aesthetic appeal, and functionality of different design options.
By comparing prototypes or design concepts, businesses can gather valuable insights into customer preferences and usability. This analysis helps identify strengths and weaknesses in design, facilitating iterative improvements and ensuring that the final product meets user expectations.
4) Making informed product development decisions
Comparative analysis is essential for making informed product development decisions. By comparing market trends, customer feedback, and technological advancements, product owners and managers can identify opportunities for innovation and differentiation.
This analysis enables businesses to prioritize features, allocate resources effectively, and mitigate risks associated with product development. By leveraging comparative analysis, organizations can streamline the product development process and deliver solutions that resonate with their target audience.
With a clear understanding of when to leverage comparative analysis, let's explore the key steps involved in conducting a thorough comparative analysis.
Key steps in conducting a comparative analysis
Conducting a comparative analysis involves defining objectives, selecting criteria, gathering data, analyzing findings, and drawing conclusions. These steps provide a systematic approach for product owners to derive actionable insights and drive product innovation:

Step 1: Define Your Goals and Questions
When embarking on a comparative analysis, it's crucial to start with a clear understanding of your goals and the specific questions you aim to answer. This initial step lays the foundation for a focused and purposeful comparison.
What are you trying to achieve with the analysis?
Clearly articulate the overarching objectives of your comparative analysis. Are you seeking insights to enhance your product's features, understand market positioning, or identify potential areas for improvement? Defining your goals provides a roadmap for the entire process.
What specific questions do you need answers to?
List down the precise questions that need resolution. For instance, if you're comparing products, inquire about specific functionalities, user experience, or pricing strategies. This clarity ensures that your analysis remains targeted, saving time and resources.
Step 2: Identify Relevant Subjects for Comparison
Selecting the right subjects for comparison is pivotal to obtaining meaningful insights. Consider exploring the following categories:
Direct Competitors
Identify products or services that directly compete with yours in the market. This could include similar solutions with overlapping functionalities or offerings.
Alternative Solutions
Look beyond direct competitors and explore alternative solutions that cater to similar needs. This widens your perspective, allowing you to understand diverse approaches to solving user problems.
Industry Benchmarks
Include industry benchmarks to gauge where your product stands in comparison to the broader market standards. This broader context aids in recognizing areas of excellence or potential gaps.
Step 3: Gather Data and Information
Accurate and comprehensive data collection forms the backbone of any comparative analysis. The information you gather should cover various aspects of the subjects under consideration.
Product Features and Functionalities
Compile a detailed inventory of features and functionalities for each subject. This includes both core and unique attributes that contribute to the product's value proposition.
Pricing and Market Positioning
Examine the pricing strategies of your subjects and understand their market positioning. This information is critical for evaluating your product's competitiveness in terms of value.
User Reviews and Feedback
Aggregate user reviews and feedback to grasp the real-world experiences of consumers with each subject. This qualitative data provides insights into user satisfaction, pain points, and expectations.
Financial Performance and Market Share
Analyze the financial performance and market share of each subject. This quantitative data aids in understanding the overall success and reach of the products in the market.
Step 4: Choose the Right Comparison Framework
Selecting an appropriate framework for comparison ensures a systematic and meaningful evaluation. Tailor your approach based on the nature of your analysis.
Feature-by-Feature Comparison
Break down the analysis by comparing specific features and functionalities. This granular approach helps in identifying strengths and weaknesses in each area.
SWOT Analysis (Strengths, Weaknesses, Opportunities, Threats)
Conduct a SWOT analysis to comprehensively assess the internal strengths and weaknesses of your product, alongside external opportunities and threats in the market.
Value Proposition Analysis
Evaluate the unique value propositions of each subject. This analysis focuses on what sets each product apart and how it addresses user needs in a distinctive way.
Step 5: Analyze and Interpret the Data
With data in hand, delve into the analysis phase, aiming to draw meaningful insights and actionable conclusions.
Identify Key Similarities and Differences
Highlight the commonalities and disparities across the subjects. This provides a clear snapshot of the landscape, aiding in understanding the market dynamics.
Uncover Trends and Patterns
Look for trends or recurring patterns in the data. This could include customer preferences, market shifts, or emerging industry norms. Identifying these trends helps in future-proofing your product strategy.
Evaluate Strengths and Weaknesses of Each Subject
Assess the strengths and weaknesses of each subject objectively. This critical evaluation sets the stage for informed decision-making and strategic planning.
Step 6: Draw Conclusions and Recommendations
Synthesize the findings into actionable conclusions and recommendations that directly inform your product strategy.
How Do the Findings Inform Your Product Strategy?
Clearly articulate how the analysis findings impact your product strategy. Identify areas for improvement, potential areas for innovation, and strategies for staying competitive in the market.
What Actionable Insights Can Be Derived?
Translate insights into concrete actions. Whether it's enhancing specific features, adjusting pricing strategies, or refining marketing approaches, provide actionable steps based on your analysis.
Present Your Findings in a Clear and Concise Manner
Communication is key. Present your conclusions and recommendations in a clear and concise manner. Use visuals, charts, and graphs to enhance understanding and facilitate decision-making.
Having outlined the key steps, let's delve into best practices that can enhance the effectiveness of comparative analysis for product owners.
Best practices for effective comparative analysis
To maximize the benefits of comparative analysis, product owners should prioritize clear objectives, select relevant criteria, ensure data accuracy, and remain open to insights. By adhering to best practices, product owners can streamline decision-making and propel their products towards success:

1) Focus on relevant and comparable data
Effective comparative analysis hinges on focusing solely on data that is pertinent and can be compared directly. Ensure that the data you gather is relevant to the specific aspects you're analyzing.
Avoid including extraneous information that might obscure the comparison process. By narrowing your focus, you can better understand the nuances of the comparison and draw more actionable insights.
2) Use multiple sources of information for triangulation
To enhance the reliability and accuracy of your comparative analysis, utilize diverse sources of information. Triangulating data from various reputable sources helps validate your findings and minimizes the risk of bias.
Incorporate data from different perspectives or methodologies to gain a comprehensive understanding of the subject under analysis. By cross-referencing multiple sources, you can identify patterns, trends, and discrepancies more effectively.
3) Be objective and avoid bias in your analysis
Maintain objectivity throughout your comparative analysis process to ensure that your conclusions are grounded in factual evidence rather than personal opinions or preconceptions. Guard against biases that may skew your interpretation of data.
Approach the analysis with an open mind and remain impartial in your assessments. Objectivity fosters credibility and trust in the validity of your findings, enabling stakeholders to make informed decisions based on the analysis.
4) Visualize your data using charts and graphs for clarity
Enhance the clarity and comprehensibility of your comparative analysis by visualizing data through charts, graphs, and other visual representations. Visual aids facilitate the interpretation of complex information, enabling stakeholders to grasp key insights at a glance.
Choose appropriate visualization techniques based on the nature of the data and the comparisons being made. Well-designed visuals not only simplify complex concepts but also highlight important trends and patterns for easier interpretation.
5) Tailor your analysis to your specific audience and goals
Customize your comparative analysis to align with the needs, preferences, and expectations of your target audience. Consider the knowledge level, interests, and priorities of stakeholders when presenting findings and insights.
Tailoring the analysis ensures relevance and resonance with the intended audience, maximizing its impact and utility. Furthermore, clarify the goals and objectives of the analysis from the outset to guide the selection of data, methodologies, and presentation formats. Aligning the analysis with specific goals enhances its relevance and actionable outcomes for decision-making.
In conclusion, conducting comparative analysis empowers product owners and managers to make informed decisions. By evaluating similarities and differences, they gain valuable insights into market trends and consumer preferences.
Through practical examples, this guide illustrates the significance of comparing data, features, and performance metrics. Implementing a structured approach to analysis enhances product development strategies and fosters competitive advantage.
As decision-makers prioritize resources and optimize strategies, they foster innovation and adaptability in their products. Embracing comparative analysis as a fundamental practice ensures continual improvement and relevance in a dynamic marketplace. In essence, it is a cornerstone for effective decision-making and sustained success in product management.
Latest articles

Balancing Core Product Improvements with Bold Bets: A Three Horizons Approach to Product Prioritization

User Research at Netflix

In-Depth: Blitzllama vs. Sprig
What Is Comparative Analysis and How to Conduct It? (+ Examples)
Appinio Research · 30.10.2023 · 35min read

Have you ever faced a complex decision, wondering how to make the best choice among multiple options? In a world filled with data and possibilities, the art of comparative analysis holds the key to unlocking clarity amidst the chaos.
In this guide, we'll demystify the power of comparative analysis, revealing its practical applications, methodologies, and best practices. Whether you're a business leader, researcher, or simply someone seeking to make more informed decisions, join us as we explore the intricacies of comparative analysis and equip you with the tools to chart your course with confidence.
What is Comparative Analysis?
Comparative analysis is a systematic approach used to evaluate and compare two or more entities, variables, or options to identify similarities, differences, and patterns. It involves assessing the strengths, weaknesses, opportunities, and threats associated with each entity or option to make informed decisions.
The primary purpose of comparative analysis is to provide a structured framework for decision-making by:
- Facilitating Informed Choices: Comparative analysis equips decision-makers with data-driven insights, enabling them to make well-informed choices among multiple options.
- Identifying Trends and Patterns: It helps identify recurring trends, patterns, and relationships among entities or variables, shedding light on underlying factors influencing outcomes.
- Supporting Problem Solving: Comparative analysis aids in solving complex problems by systematically breaking them down into manageable components and evaluating potential solutions.
- Enhancing Transparency: By comparing multiple options, comparative analysis promotes transparency in decision-making processes, allowing stakeholders to understand the rationale behind choices.
- Mitigating Risks : It helps assess the risks associated with each option, allowing organizations to develop risk mitigation strategies and make risk-aware decisions.
- Optimizing Resource Allocation: Comparative analysis assists in allocating resources efficiently by identifying areas where resources can be optimized for maximum impact.
- Driving Continuous Improvement: By comparing current performance with historical data or benchmarks, organizations can identify improvement areas and implement growth strategies.
Importance of Comparative Analysis in Decision-Making
- Data-Driven Decision-Making: Comparative analysis relies on empirical data and objective evaluation, reducing the influence of biases and subjective judgments in decision-making. It ensures decisions are based on facts and evidence.
- Objective Assessment: It provides an objective and structured framework for evaluating options, allowing decision-makers to focus on key criteria and avoid making decisions solely based on intuition or preferences.
- Risk Assessment: Comparative analysis helps assess and quantify risks associated with different options. This risk awareness enables organizations to make proactive risk management decisions.
- Prioritization: By ranking options based on predefined criteria, comparative analysis enables decision-makers to prioritize actions or investments, directing resources to areas with the most significant impact.
- Strategic Planning: It is integral to strategic planning, helping organizations align their decisions with overarching goals and objectives. Comparative analysis ensures decisions are consistent with long-term strategies.
- Resource Allocation: Organizations often have limited resources. Comparative analysis assists in allocating these resources effectively, ensuring they are directed toward initiatives with the highest potential returns.
- Continuous Improvement: Comparative analysis supports a culture of continuous improvement by identifying areas for enhancement and guiding iterative decision-making processes.
- Stakeholder Communication: It enhances transparency in decision-making, making it easier to communicate decisions to stakeholders. Stakeholders can better understand the rationale behind choices when supported by comparative analysis.
- Competitive Advantage: In business and competitive environments , comparative analysis can provide a competitive edge by identifying opportunities to outperform competitors or address weaknesses.
- Informed Innovation: When evaluating new products , technologies, or strategies, comparative analysis guides the selection of the most promising options, reducing the risk of investing in unsuccessful ventures.
In summary, comparative analysis is a valuable tool that empowers decision-makers across various domains to make informed, data-driven choices, manage risks, allocate resources effectively, and drive continuous improvement. Its structured approach enhances decision quality and transparency, contributing to the success and competitiveness of organizations and research endeavors.
How to Prepare for Comparative Analysis?
1. define objectives and scope.
Before you begin your comparative analysis, clearly defining your objectives and the scope of your analysis is essential. This step lays the foundation for the entire process. Here's how to approach it:
- Identify Your Goals: Start by asking yourself what you aim to achieve with your comparative analysis. Are you trying to choose between two products for your business? Are you evaluating potential investment opportunities? Knowing your objectives will help you stay focused throughout the analysis.
- Define Scope: Determine the boundaries of your comparison. What will you include, and what will you exclude? For example, if you're analyzing market entry strategies for a new product, specify whether you're looking at a specific geographic region or a particular target audience.
- Stakeholder Alignment: Ensure that all stakeholders involved in the analysis understand and agree on the objectives and scope. This alignment will prevent misunderstandings and ensure the analysis meets everyone's expectations.
2. Gather Relevant Data and Information
The quality of your comparative analysis heavily depends on the data and information you gather. Here's how to approach this crucial step:
- Data Sources: Identify where you'll obtain the necessary data. Will you rely on primary sources , such as surveys and interviews, to collect original data? Or will you use secondary sources, like published research and industry reports, to access existing data? Consider the advantages and disadvantages of each source.
- Data Collection Plan: Develop a plan for collecting data. This should include details about the methods you'll use, the timeline for data collection, and who will be responsible for gathering the data.
- Data Relevance: Ensure that the data you collect is directly relevant to your objectives. Irrelevant or extraneous data can lead to confusion and distract from the core analysis.
3. Select Appropriate Criteria for Comparison
Choosing the right criteria for comparison is critical to a successful comparative analysis. Here's how to go about it:
- Relevance to Objectives: Your chosen criteria should align closely with your analysis objectives. For example, if you're comparing job candidates, your criteria might include skills, experience, and cultural fit.
- Measurability: Consider whether you can quantify the criteria. Measurable criteria are easier to analyze. If you're comparing marketing campaigns, you might measure criteria like click-through rates, conversion rates, and return on investment.
- Weighting Criteria : Not all criteria are equally important. You'll need to assign weights to each criterion based on its relative importance. Weighting helps ensure that the most critical factors have a more significant impact on the final decision.
4. Establish a Clear Framework
Once you have your objectives, data, and criteria in place, it's time to establish a clear framework for your comparative analysis. This framework will guide your process and ensure consistency. Here's how to do it:
- Comparative Matrix: Consider using a comparative matrix or spreadsheet to organize your data. Each row in the matrix represents an option or entity you're comparing, and each column corresponds to a criterion. This visual representation makes it easy to compare and contrast data.
- Timeline: Determine the time frame for your analysis. Is it a one-time comparison, or will you conduct ongoing analyses? Having a defined timeline helps you manage the analysis process efficiently.
- Define Metrics: Specify the metrics or scoring system you'll use to evaluate each criterion. For example, if you're comparing potential office locations, you might use a scoring system from 1 to 5 for factors like cost, accessibility, and amenities.
With your objectives, data, criteria, and framework established, you're ready to move on to the next phase of comparative analysis: data collection and organization.
Comparative Analysis Data Collection
Data collection and organization are critical steps in the comparative analysis process. We'll explore how to gather and structure the data you need for a successful analysis.
1. Utilize Primary Data Sources
Primary data sources involve gathering original data directly from the source. This approach offers unique advantages, allowing you to tailor your data collection to your specific research needs.
Some popular primary data sources include:
- Surveys and Questionnaires: Design surveys or questionnaires and distribute them to collect specific information from individuals or groups. This method is ideal for obtaining firsthand insights, such as customer preferences or employee feedback.
- Interviews: Conduct structured interviews with relevant stakeholders or experts. Interviews provide an opportunity to delve deeper into subjects and gather qualitative data, making them valuable for in-depth analysis.
- Observations: Directly observe and record data from real-world events or settings. Observational data can be instrumental in fields like anthropology, ethnography, and environmental studies.
- Experiments: In controlled environments, experiments allow you to manipulate variables and measure their effects. This method is common in scientific research and product testing.
When using primary data sources, consider factors like sample size, survey design, and data collection methods to ensure the reliability and validity of your data.
2. Harness Secondary Data Sources
Secondary data sources involve using existing data collected by others. These sources can provide a wealth of information and save time and resources compared to primary data collection.
Here are common types of secondary data sources:
- Public Records: Government publications, census data, and official reports offer valuable information on demographics, economic trends, and public policies. They are often free and readily accessible.
- Academic Journals: Scholarly articles provide in-depth research findings across various disciplines. They are helpful for accessing peer-reviewed studies and staying current with academic discourse.
- Industry Reports: Industry-specific reports and market research publications offer insights into market trends, consumer behavior, and competitive landscapes. They are essential for businesses making strategic decisions.
- Online Databases: Online platforms like Statista , PubMed , and Google Scholar provide a vast repository of data and research articles. They offer search capabilities and access to a wide range of data sets.
When using secondary data sources, critically assess the credibility, relevance, and timeliness of the data. Ensure that it aligns with your research objectives.
3. Ensure and Validate Data Quality
Data quality is paramount in comparative analysis. Poor-quality data can lead to inaccurate conclusions and flawed decision-making. Here's how to ensure data validation and reliability:
- Cross-Verification: Whenever possible, cross-verify data from multiple sources. Consistency among different sources enhances the reliability of the data.
- Sample Size: Ensure that your data sample size is statistically significant for meaningful analysis. A small sample may not accurately represent the population.
- Data Integrity: Check for data integrity issues, such as missing values, outliers, or duplicate entries. Address these issues before analysis to maintain data quality.
- Data Source Reliability: Assess the reliability and credibility of the data sources themselves. Consider factors like the reputation of the institution or organization providing the data.
4. Organize Data Effectively
Structuring your data for comparison is a critical step in the analysis process. Organized data makes it easier to draw insights and make informed decisions. Here's how to structure data effectively:
- Data Cleaning: Before analysis, clean your data to remove inconsistencies, errors, and irrelevant information. Data cleaning may involve data transformation, imputation of missing values, and removing outliers.
- Normalization: Standardize data to ensure fair comparisons. Normalization adjusts data to a standard scale, making comparing variables with different units or ranges possible.
- Variable Labeling: Clearly label variables and data points for easy identification. Proper labeling enhances the transparency and understandability of your analysis.
- Data Organization: Organize data into a format that suits your analysis methods. For quantitative analysis, this might mean creating a matrix, while qualitative analysis may involve categorizing data into themes.
By paying careful attention to data collection, validation, and organization, you'll set the stage for a robust and insightful comparative analysis. Next, we'll explore various methodologies you can employ in your analysis, ranging from qualitative approaches to quantitative methods and examples.
Comparative Analysis Methods
When it comes to comparative analysis, various methodologies are available, each suited to different research goals and data types. In this section, we'll explore five prominent methodologies in detail.
Qualitative Comparative Analysis (QCA)
Qualitative Comparative Analysis (QCA) is a methodology often used when dealing with complex, non-linear relationships among variables. It seeks to identify patterns and configurations among factors that lead to specific outcomes.
- Case-by-Case Analysis: QCA involves evaluating individual cases (e.g., organizations, regions, or events) rather than analyzing aggregate data. Each case's unique characteristics are considered.
- Boolean Logic: QCA employs Boolean algebra to analyze data. Variables are categorized as either present or absent, allowing for the examination of different combinations and logical relationships.
- Necessary and Sufficient Conditions: QCA aims to identify necessary and sufficient conditions for a specific outcome to occur. It helps answer questions like, "What conditions are necessary for a successful product launch?"
- Fuzzy Set Theory: In some cases, QCA may use fuzzy set theory to account for degrees of membership in a category, allowing for more nuanced analysis.
QCA is particularly useful in fields such as sociology, political science, and organizational studies, where understanding complex interactions is essential.
Quantitative Comparative Analysis
Quantitative Comparative Analysis involves the use of numerical data and statistical techniques to compare and analyze variables. It's suitable for situations where data is quantitative, and relationships can be expressed numerically.
- Statistical Tools: Quantitative comparative analysis relies on statistical methods like regression analysis, correlation, and hypothesis testing. These tools help identify relationships, dependencies, and trends within datasets.
- Data Measurement: Ensure that variables are measured consistently using appropriate scales (e.g., ordinal, interval, ratio) for meaningful analysis. Variables may include numerical values like revenue, customer satisfaction scores, or product performance metrics.
- Data Visualization: Create visual representations of data using charts, graphs, and plots. Visualization aids in understanding complex relationships and presenting findings effectively.
- Statistical Significance: Assess the statistical significance of relationships. Statistical significance indicates whether observed differences or relationships are likely to be real rather than due to chance.
Quantitative comparative analysis is commonly applied in economics, social sciences, and market research to draw empirical conclusions from numerical data.
Case Studies
Case studies involve in-depth examinations of specific instances or cases to gain insights into real-world scenarios. Comparative case studies allow researchers to compare and contrast multiple cases to identify patterns, differences, and lessons.
- Narrative Analysis: Case studies often involve narrative analysis, where researchers construct detailed narratives of each case, including context, events, and outcomes.
- Contextual Understanding: In comparative case studies, it's crucial to consider the context within which each case operates. Understanding the context helps interpret findings accurately.
- Cross-Case Analysis: Researchers conduct cross-case analysis to identify commonalities and differences across cases. This process can lead to the discovery of factors that influence outcomes.
- Triangulation: To enhance the validity of findings, researchers may use multiple data sources and methods to triangulate information and ensure reliability.
Case studies are prevalent in fields like psychology, business, and sociology, where deep insights into specific situations are valuable.
SWOT Analysis
SWOT Analysis is a strategic tool used to assess the Strengths, Weaknesses, Opportunities, and Threats associated with a particular entity or situation. While it's commonly used in business, it can be adapted for various comparative analyses.
- Internal and External Factors: SWOT Analysis examines both internal factors (Strengths and Weaknesses), such as organizational capabilities, and external factors (Opportunities and Threats), such as market conditions and competition.
- Strategic Planning: The insights from SWOT Analysis inform strategic decision-making. By identifying strengths and opportunities, organizations can leverage their advantages. Likewise, addressing weaknesses and threats helps mitigate risks.
- Visual Representation: SWOT Analysis is often presented as a matrix or a 2x2 grid, making it visually accessible and easy to communicate to stakeholders.
- Continuous Monitoring: SWOT Analysis is not a one-time exercise. Organizations use it periodically to adapt to changing circumstances and make informed decisions.
SWOT Analysis is versatile and can be applied in business, healthcare, education, and any context where a structured assessment of factors is needed.
Benchmarking
Benchmarking involves comparing an entity's performance, processes, or practices to those of industry leaders or best-in-class organizations. It's a powerful tool for continuous improvement and competitive analysis.
- Identify Performance Gaps: Benchmarking helps identify areas where an entity lags behind its peers or industry standards. These performance gaps highlight opportunities for improvement.
- Data Collection: Gather data on key performance metrics from both internal and external sources. This data collection phase is crucial for meaningful comparisons.
- Comparative Analysis: Compare your organization's performance data with that of benchmark organizations. This analysis can reveal where you excel and where adjustments are needed.
- Continuous Improvement: Benchmarking is a dynamic process that encourages continuous improvement. Organizations use benchmarking findings to set performance goals and refine their strategies.
Benchmarking is widely used in business, manufacturing, healthcare, and customer service to drive excellence and competitiveness.
Each of these methodologies brings a unique perspective to comparative analysis, allowing you to choose the one that best aligns with your research objectives and the nature of your data. The choice between qualitative and quantitative methods, or a combination of both, depends on the complexity of the analysis and the questions you seek to answer.
How to Conduct Comparative Analysis?
Once you've prepared your data and chosen an appropriate methodology, it's time to dive into the process of conducting a comparative analysis. We will guide you through the essential steps to extract meaningful insights from your data.

1. Identify Key Variables and Metrics
Identifying key variables and metrics is the first crucial step in conducting a comparative analysis. These are the factors or indicators you'll use to assess and compare your options.
- Relevance to Objectives: Ensure the chosen variables and metrics align closely with your analysis objectives. When comparing marketing strategies, relevant metrics might include customer acquisition cost, conversion rate, and retention.
- Quantitative vs. Qualitative : Decide whether your analysis will focus on quantitative data (numbers) or qualitative data (descriptive information). In some cases, a combination of both may be appropriate.
- Data Availability: Consider the availability of data. Ensure you can access reliable and up-to-date data for all selected variables and metrics.
- KPIs: Key Performance Indicators (KPIs) are often used as the primary metrics in comparative analysis. These are metrics that directly relate to your goals and objectives.
2. Visualize Data for Clarity
Data visualization techniques play a vital role in making complex information more accessible and understandable. Effective data visualization allows you to convey insights and patterns to stakeholders. Consider the following approaches:
- Charts and Graphs: Use various types of charts, such as bar charts, line graphs, and pie charts, to represent data. For example, a line graph can illustrate trends over time, while a bar chart can compare values across categories.
- Heatmaps: Heatmaps are particularly useful for visualizing large datasets and identifying patterns through color-coding. They can reveal correlations, concentrations, and outliers.
- Scatter Plots: Scatter plots help visualize relationships between two variables. They are especially useful for identifying trends, clusters, or outliers.
- Dashboards: Create interactive dashboards that allow users to explore data and customize views. Dashboards are valuable for ongoing analysis and reporting.
- Infographics: For presentations and reports, consider using infographics to summarize key findings in a visually engaging format.
Effective data visualization not only enhances understanding but also aids in decision-making by providing clear insights at a glance.
3. Establish Clear Comparative Frameworks
A well-structured comparative framework provides a systematic approach to your analysis. It ensures consistency and enables you to make meaningful comparisons. Here's how to create one:
- Comparison Matrices: Consider using matrices or spreadsheets to organize your data. Each row represents an option or entity, and each column corresponds to a variable or metric. This matrix format allows for side-by-side comparisons.
- Decision Trees: In complex decision-making scenarios, decision trees help map out possible outcomes based on different criteria and variables. They visualize the decision-making process.
- Scenario Analysis: Explore different scenarios by altering variables or criteria to understand how changes impact outcomes. Scenario analysis is valuable for risk assessment and planning.
- Checklists: Develop checklists or scoring sheets to systematically evaluate each option against predefined criteria. Checklists ensure that no essential factors are overlooked.
A well-structured comparative framework simplifies the analysis process, making it easier to draw meaningful conclusions and make informed decisions.
4. Evaluate and Score Criteria
Evaluating and scoring criteria is a critical step in comparative analysis, as it quantifies the performance of each option against the chosen criteria.
- Scoring System: Define a scoring system that assigns values to each criterion for every option. Common scoring systems include numerical scales, percentage scores, or qualitative ratings (e.g., high, medium, low).
- Consistency: Ensure consistency in scoring by defining clear guidelines for each score. Provide examples or descriptions to help evaluators understand what each score represents.
- Data Collection: Collect data or information relevant to each criterion for all options. This may involve quantitative data (e.g., sales figures) or qualitative data (e.g., customer feedback).
- Aggregation: Aggregate the scores for each option to obtain an overall evaluation. This can be done by summing the individual criterion scores or applying weighted averages.
- Normalization: If your criteria have different measurement scales or units, consider normalizing the scores to create a level playing field for comparison.
5. Assign Importance to Criteria
Not all criteria are equally important in a comparative analysis. Weighting criteria allows you to reflect their relative significance in the final decision-making process.
- Relative Importance: Assess the importance of each criterion in achieving your objectives. Criteria directly aligned with your goals may receive higher weights.
- Weighting Methods: Choose a weighting method that suits your analysis. Common methods include expert judgment, analytic hierarchy process (AHP), or data-driven approaches based on historical performance.
- Impact Analysis: Consider how changes in the weights assigned to criteria would affect the final outcome. This sensitivity analysis helps you understand the robustness of your decisions.
- Stakeholder Input: Involve relevant stakeholders or decision-makers in the weighting process. Their input can provide valuable insights and ensure alignment with organizational goals.
- Transparency: Clearly document the rationale behind the assigned weights to maintain transparency in your analysis.
By weighting criteria, you ensure that the most critical factors have a more significant influence on the final evaluation, aligning the analysis more closely with your objectives and priorities.
With these steps in place, you're well-prepared to conduct a comprehensive comparative analysis. The next phase involves interpreting your findings, drawing conclusions, and making informed decisions based on the insights you've gained.
Comparative Analysis Interpretation
Interpreting the results of your comparative analysis is a crucial phase that transforms data into actionable insights. We'll delve into various aspects of interpretation and how to make sense of your findings.
- Contextual Understanding: Before diving into the data, consider the broader context of your analysis. Understand the industry trends, market conditions, and any external factors that may have influenced your results.
- Drawing Conclusions: Summarize your findings clearly and concisely. Identify trends, patterns, and significant differences among the options or variables you've compared.
- Quantitative vs. Qualitative Analysis: Depending on the nature of your data and analysis, you may need to balance both quantitative and qualitative interpretations. Qualitative insights can provide context and nuance to quantitative findings.
- Comparative Visualization: Visual aids such as charts, graphs, and tables can help convey your conclusions effectively. Choose visual representations that align with the nature of your data and the key points you want to emphasize.
- Outliers and Anomalies: Identify and explain any outliers or anomalies in your data. Understanding these exceptions can provide valuable insights into unusual cases or factors affecting your analysis.
- Cross-Validation: Validate your conclusions by comparing them with external benchmarks, industry standards, or expert opinions. Cross-validation helps ensure the reliability of your findings.
- Implications for Decision-Making: Discuss how your analysis informs decision-making. Clearly articulate the practical implications of your findings and their relevance to your initial objectives.
- Actionable Insights: Emphasize actionable insights that can guide future strategies, policies, or actions. Make recommendations based on your analysis, highlighting the steps needed to capitalize on strengths or address weaknesses.
- Continuous Improvement: Encourage a culture of continuous improvement by using your analysis as a feedback mechanism. Suggest ways to monitor and adapt strategies over time based on evolving circumstances.
Comparative Analysis Applications
Comparative analysis is a versatile methodology that finds application in various fields and scenarios. Let's explore some of the most common and impactful applications.
Business Decision-Making
Comparative analysis is widely employed in business to inform strategic decisions and drive success. Key applications include:
Market Research and Competitive Analysis
- Objective: To assess market opportunities and evaluate competitors.
- Methods: Analyzing market trends, customer preferences, competitor strengths and weaknesses, and market share.
- Outcome: Informed product development, pricing strategies, and market entry decisions.
Product Comparison and Benchmarking
- Objective: To compare the performance and features of products or services.
- Methods: Evaluating product specifications, customer reviews, and pricing.
- Outcome: Identifying strengths and weaknesses, improving product quality, and setting competitive pricing.
Financial Analysis
- Objective: To evaluate financial performance and make investment decisions.
- Methods: Comparing financial statements, ratios, and performance indicators of companies.
- Outcome: Informed investment choices, risk assessment, and portfolio management.
Healthcare and Medical Research
In the healthcare and medical research fields, comparative analysis is instrumental in understanding diseases, treatment options, and healthcare systems.
Clinical Trials and Drug Development opment
- Objective: To compare the effectiveness of different treatments or drugs.
- Methods: Analyzing clinical trial data, patient outcomes, and side effects.
- Outcome: Informed decisions about drug approvals, treatment protocols, and patient care.
Health Outcomes Research
- Objective: To assess the impact of healthcare interventions.
- Methods: Comparing patient health outcomes before and after treatment or between different treatment approaches.
- Outcome: Improved healthcare guidelines, cost-effectiveness analysis, and patient care plans.
Healthcare Systems Evaluation
- Objective: To assess the performance of healthcare systems.
- Methods: Comparing healthcare delivery models, patient satisfaction, and healthcare costs.
- Outcome: Informed healthcare policy decisions, resource allocation, and system improvements.
Social Sciences and Policy Analysis
Comparative analysis is a fundamental tool in social sciences and policy analysis, aiding in understanding complex societal issues.
Educational Research
- Objective: To compare educational systems and practices.
- Methods: Analyzing student performance, curriculum effectiveness, and teaching methods.
- Outcome: Informed educational policies, curriculum development, and school improvement strategies.
Political Science
- Objective: To study political systems, elections, and governance.
- Methods: Comparing election outcomes, policy impacts, and government structures.
- Outcome: Insights into political behavior, policy effectiveness, and governance reforms.
Social Welfare and Poverty Analysis
- Objective: To evaluate the impact of social programs and policies.
- Methods: Comparing the well-being of individuals or communities with and without access to social assistance.
- Outcome: Informed policymaking, poverty reduction strategies, and social program improvements.
Environmental Science and Sustainability
Comparative analysis plays a pivotal role in understanding environmental issues and promoting sustainability.
Environmental Impact Assessment
- Objective: To assess the environmental consequences of projects or policies.
- Methods: Comparing ecological data, resource use, and pollution levels.
- Outcome: Informed environmental mitigation strategies, sustainable development plans, and regulatory decisions.
Climate Change Analysis
- Objective: To study climate patterns and their impacts.
- Methods: Comparing historical climate data, temperature trends, and greenhouse gas emissions.
- Outcome: Insights into climate change causes, adaptation strategies, and policy recommendations.
Ecosystem Health Assessment
- Objective: To evaluate the health and resilience of ecosystems.
- Methods: Comparing biodiversity, habitat conditions, and ecosystem services.
- Outcome: Conservation efforts, restoration plans, and ecological sustainability measures.
Technology and Innovation
Comparative analysis is crucial in the fast-paced world of technology and innovation.
Product Development and Innovation
- Objective: To assess the competitiveness and innovation potential of products or technologies.
- Methods: Comparing research and development investments, technology features, and market demand.
- Outcome: Informed innovation strategies, product roadmaps, and patent decisions.
User Experience and Usability Testing
- Objective: To evaluate the user-friendliness of software applications or digital products.
- Methods: Comparing user feedback, usability metrics, and user interface designs.
- Outcome: Improved user experiences, interface redesigns, and product enhancements.
Technology Adoption and Market Entry
- Objective: To analyze market readiness and risks for new technologies.
- Methods: Comparing market conditions, regulatory landscapes, and potential barriers.
- Outcome: Informed market entry strategies, risk assessments, and investment decisions.
These diverse applications of comparative analysis highlight its flexibility and importance in decision-making across various domains. Whether in business, healthcare, social sciences, environmental studies, or technology, comparative analysis empowers researchers and decision-makers to make informed choices and drive positive outcomes.
Comparative Analysis Best Practices
Successful comparative analysis relies on following best practices and avoiding common pitfalls. Implementing these practices enhances the effectiveness and reliability of your analysis.
- Clearly Defined Objectives: Start with well-defined objectives that outline what you aim to achieve through the analysis. Clear objectives provide focus and direction.
- Data Quality Assurance: Ensure data quality by validating, cleaning, and normalizing your data. Poor-quality data can lead to inaccurate conclusions.
- Transparent Methodologies: Clearly explain the methodologies and techniques you've used for analysis. Transparency builds trust and allows others to assess the validity of your approach.
- Consistent Criteria: Maintain consistency in your criteria and metrics across all options or variables. Inconsistent criteria can lead to biased results.
- Sensitivity Analysis: Conduct sensitivity analysis by varying key parameters, such as weights or assumptions, to assess the robustness of your conclusions.
- Stakeholder Involvement: Involve relevant stakeholders throughout the analysis process. Their input can provide valuable perspectives and ensure alignment with organizational goals.
- Critical Evaluation of Assumptions: Identify and critically evaluate any assumptions made during the analysis. Assumptions should be explicit and justifiable.
- Holistic View: Take a holistic view of the analysis by considering both short-term and long-term implications. Avoid focusing solely on immediate outcomes.
- Documentation: Maintain thorough documentation of your analysis, including data sources, calculations, and decision criteria. Documentation supports transparency and facilitates reproducibility.
- Continuous Learning: Stay updated with the latest analytical techniques, tools, and industry trends. Continuous learning helps you adapt your analysis to changing circumstances.
- Peer Review: Seek peer review or expert feedback on your analysis. External perspectives can identify blind spots and enhance the quality of your work.
- Ethical Considerations: Address ethical considerations, such as privacy and data protection, especially when dealing with sensitive or personal data.
By adhering to these best practices, you'll not only improve the rigor of your comparative analysis but also ensure that your findings are reliable, actionable, and aligned with your objectives.
Comparative Analysis Examples
To illustrate the practical application and benefits of comparative analysis, let's explore several real-world examples across different domains. These examples showcase how organizations and researchers leverage comparative analysis to make informed decisions, solve complex problems, and drive improvements:
Retail Industry - Price Competitiveness Analysis
Objective: A retail chain aims to assess its price competitiveness against competitors in the same market.
Methodology:
- Collect pricing data for a range of products offered by the retail chain and its competitors.
- Organize the data into a comparative framework, categorizing products by type and price range.
- Calculate price differentials, averages, and percentiles for each product category.
- Analyze the findings to identify areas where the retail chain's prices are higher or lower than competitors.
Outcome: The analysis reveals that the retail chain's prices are consistently lower in certain product categories but higher in others. This insight informs pricing strategies, allowing the retailer to adjust prices to remain competitive in the market.
Healthcare - Comparative Effectiveness Research
Objective: Researchers aim to compare the effectiveness of two different treatment methods for a specific medical condition.
- Recruit patients with the medical condition and randomly assign them to two treatment groups.
- Collect data on treatment outcomes, including symptom relief, side effects, and recovery times.
- Analyze the data using statistical methods to compare the treatment groups.
- Consider factors like patient demographics and baseline health status as potential confounding variables.
Outcome: The comparative analysis reveals that one treatment method is statistically more effective than the other in relieving symptoms and has fewer side effects. This information guides medical professionals in recommending the more effective treatment to patients.
Environmental Science - Carbon Emission Analysis
Objective: An environmental organization seeks to compare carbon emissions from various transportation modes in a metropolitan area.
- Collect data on the number of vehicles, their types (e.g., cars, buses, bicycles), and fuel consumption for each mode of transportation.
- Calculate the total carbon emissions for each mode based on fuel consumption and emission factors.
- Create visualizations such as bar charts and pie charts to represent the emissions from each transportation mode.
- Consider factors like travel distance, occupancy rates, and the availability of alternative fuels.
Outcome: The comparative analysis reveals that public transportation generates significantly lower carbon emissions per passenger mile compared to individual car travel. This information supports advocacy for increased public transit usage to reduce carbon footprint.
Technology Industry - Feature Comparison for Software Development Tools
Objective: A software development team needs to choose the most suitable development tool for an upcoming project.
- Create a list of essential features and capabilities required for the project.
- Research and compile information on available development tools in the market.
- Develop a comparative matrix or scoring system to evaluate each tool's features against the project requirements.
- Assign weights to features based on their importance to the project.
Outcome: The comparative analysis highlights that Tool A excels in essential features critical to the project, such as version control integration and debugging capabilities. The development team selects Tool A as the preferred choice for the project.
Educational Research - Comparative Study of Teaching Methods
Objective: A school district aims to improve student performance by comparing the effectiveness of traditional classroom teaching with online learning.
- Randomly assign students to two groups: one taught using traditional methods and the other through online courses.
- Administer pre- and post-course assessments to measure knowledge gain.
- Collect feedback from students and teachers on the learning experiences.
- Analyze assessment scores and feedback to compare the effectiveness and satisfaction levels of both teaching methods.
Outcome: The comparative analysis reveals that online learning leads to similar knowledge gains as traditional classroom teaching. However, students report higher satisfaction and flexibility with the online approach. The school district considers incorporating online elements into its curriculum.
These examples illustrate the diverse applications of comparative analysis across industries and research domains. Whether optimizing pricing strategies in retail, evaluating treatment effectiveness in healthcare, assessing environmental impacts, choosing the right software tool, or improving educational methods, comparative analysis empowers decision-makers with valuable insights for informed choices and positive outcomes.
Comparative analysis is your compass in the world of decision-making. It helps you see the bigger picture, spot opportunities, and navigate challenges. By defining your objectives, gathering data, applying methodologies, and following best practices, you can harness the power of Comparative Analysis to make informed choices and drive positive outcomes.
Remember, Comparative analysis is not just a tool; it's a mindset that empowers you to transform data into insights and uncertainty into clarity. So, whether you're steering a business, conducting research, or facing life's choices, embrace Comparative Analysis as your trusted guide on the journey to better decisions. With it, you can chart your course, make impactful choices, and set sail toward success.
How to Conduct Comparative Analysis in Minutes?
Are you ready to revolutionize your approach to market research and comparative analysis? Appinio , a real-time market research platform, empowers you to harness the power of real-time consumer insights for swift, data-driven decisions. Here's why you should choose Appinio:
- Speedy Insights: Get from questions to insights in minutes, enabling you to conduct comparative analysis without delay.
- User-Friendly: No need for a PhD in research – our intuitive platform is designed for everyone, making it easy to collect and analyze data.
- Global Reach: With access to over 90 countries and the ability to define your target group from 1200+ characteristics, Appinio provides a worldwide perspective for your comparative analysis
Join the loop 💌
Be the first to hear about new updates, product news, and data insights. We'll send it all straight to your inbox.
Get the latest market research news straight to your inbox! 💌
Wait, there's more

28.03.2024 | 27min read
What is Sampling Error? Definition, Types, Examples

27.03.2024 | 31min read
Situational Analysis: Definition, Methods, Process, Examples

26.03.2024 | 31min read
What is Ad Hoc Analysis and Reporting? Process, Examples

Data at Depth

Comparative Analysis in Data Visualization: 3 Hands-on Examples Using Python Plotly
The value of data often lies in its comparability — prof. edward tufte.

The world is boiling over with data, making it a tough process to transform this information into understandable data visualizations.
Professor Edward Tufte, a pioneer in data visualization, has spent his entire career distilling complex information into clear, insigh…
Keep reading with a 7-day free trial
Subscribe to Data at Depth to keep reading this post and get 7 days of free access to the full post archives.
Join thousands of product people at Insight Out Conf on April 11. Register free.
Insights hub solutions
Analyze data
Uncover deep customer insights with fast, powerful features, store insights, curate and manage insights in one searchable platform, scale research, unlock the potential of customer insights at enterprise scale.
Featured reads

Inspiration
Three things to look forward to at Insight Out

Tips and tricks
Make magic with your customer data in Dovetail

Four ways Dovetail helps Product Managers master continuous product discovery
Events and videos
© Dovetail Research Pty. Ltd.
What is comparative analysis? A complete guide
Last updated
18 April 2023
Reviewed by
Jean Kaluza
Comparative analysis is a valuable tool for acquiring deep insights into your organization’s processes, products, and services so you can continuously improve them.
Similarly, if you want to streamline, price appropriately, and ultimately be a market leader, you’ll likely need to draw on comparative analyses quite often.
When faced with multiple options or solutions to a given problem, a thorough comparative analysis can help you compare and contrast your options and make a clear, informed decision.
If you want to get up to speed on conducting a comparative analysis or need a refresher, here’s your guide.
Make comparative analysis less tedious
Dovetail streamlines comparative analysis to help you uncover and share actionable insights
- What exactly is comparative analysis?
A comparative analysis is a side-by-side comparison that systematically compares two or more things to pinpoint their similarities and differences. The focus of the investigation might be conceptual—a particular problem, idea, or theory—or perhaps something more tangible, like two different data sets.
For instance, you could use comparative analysis to investigate how your product features measure up to the competition.
After a successful comparative analysis, you should be able to identify strengths and weaknesses and clearly understand which product is more effective.
You could also use comparative analysis to examine different methods of producing that product and determine which way is most efficient and profitable.
The potential applications for using comparative analysis in everyday business are almost unlimited. That said, a comparative analysis is most commonly used to examine
Emerging trends and opportunities (new technologies, marketing)
Competitor strategies
Financial health
Effects of trends on a target audience
- Why is comparative analysis so important?
Comparative analysis can help narrow your focus so your business pursues the most meaningful opportunities rather than attempting dozens of improvements simultaneously.
A comparative approach also helps frame up data to illuminate interrelationships. For example, comparative research might reveal nuanced relationships or critical contexts behind specific processes or dependencies that wouldn’t be well-understood without the research.
For instance, if your business compares the cost of producing several existing products relative to which ones have historically sold well, that should provide helpful information once you’re ready to look at developing new products or features.
- Comparative vs. competitive analysis—what’s the difference?
Comparative analysis is generally divided into three subtypes, using quantitative or qualitative data and then extending the findings to a larger group. These include
Pattern analysis —identifying patterns or recurrences of trends and behavior across large data sets.
Data filtering —analyzing large data sets to extract an underlying subset of information. It may involve rearranging, excluding, and apportioning comparative data to fit different criteria.
Decision tree —flowcharting to visually map and assess potential outcomes, costs, and consequences.
In contrast, competitive analysis is a type of comparative analysis in which you deeply research one or more of your industry competitors. In this case, you’re using qualitative research to explore what the competition is up to across one or more dimensions.
For example
Service delivery —metrics like the Net Promoter Scores indicate customer satisfaction levels.
Market position — the share of the market that the competition has captured.
Brand reputation —how well-known or recognized your competitors are within their target market.
- Tips for optimizing your comparative analysis
Conduct original research
Thorough, independent research is a significant asset when doing comparative analysis. It provides evidence to support your findings and may present a perspective or angle not considered previously.
Make analysis routine
To get the maximum benefit from comparative research, make it a regular practice, and establish a cadence you can realistically stick to. Some business areas you could plan to analyze regularly include:
Profitability
Competition
Experiment with controlled and uncontrolled variables
In addition to simply comparing and contrasting, explore how different variables might affect your outcomes.
For example, a controllable variable would be offering a seasonal feature like a shopping bot to assist in holiday shopping or raising or lowering the selling price of a product.
Uncontrollable variables include weather, changing regulations, the current political climate, or global pandemics.
Put equal effort into each point of comparison
Most people enter into comparative research with a particular idea or hypothesis already in mind to validate. For instance, you might try to prove the worthwhileness of launching a new service. So, you may be disappointed if your analysis results don’t support your plan.
However, in any comparative analysis, try to maintain an unbiased approach by spending equal time debating the merits and drawbacks of any decision. Ultimately, this will be a practical, more long-term sustainable approach for your business than focusing only on the evidence that favors pursuing your argument or strategy.
Writing a comparative analysis in five steps
To put together a coherent, insightful analysis that goes beyond a list of pros and cons or similarities and differences, try organizing the information into these five components:
1. Frame of reference
Here is where you provide context. First, what driving idea or problem is your research anchored in? Then, for added substance, cite existing research or insights from a subject matter expert, such as a thought leader in marketing, startup growth, or investment
2. Grounds for comparison Why have you chosen to examine the two things you’re analyzing instead of focusing on two entirely different things? What are you hoping to accomplish?
3. Thesis What argument or choice are you advocating for? What will be the before and after effects of going with either decision? What do you anticipate happening with and without this approach?
For example, “If we release an AI feature for our shopping cart, we will have an edge over the rest of the market before the holiday season.” The finished comparative analysis will weigh all the pros and cons of choosing to build the new expensive AI feature including variables like how “intelligent” it will be, what it “pushes” customers to use, how much it takes off the plates of customer service etc.
Ultimately, you will gauge whether building an AI feature is the right plan for your e-commerce shop.
4. Organize the scheme Typically, there are two ways to organize a comparative analysis report. First, you can discuss everything about comparison point “A” and then go into everything about aspect “B.” Or, you alternate back and forth between points “A” and “B,” sometimes referred to as point-by-point analysis.
Using the AI feature as an example again, you could cover all the pros and cons of building the AI feature, then discuss the benefits and drawbacks of building and maintaining the feature. Or you could compare and contrast each aspect of the AI feature, one at a time. For example, a side-by-side comparison of the AI feature to shopping without it, then proceeding to another point of differentiation.
5. Connect the dots Tie it all together in a way that either confirms or disproves your hypothesis.
For instance, “Building the AI bot would allow our customer service team to save 12% on returns in Q3 while offering optimizations and savings in future strategies. However, it would also increase the product development budget by 43% in both Q1 and Q2. Our budget for product development won’t increase again until series 3 of funding is reached, so despite its potential, we will hold off building the bot until funding is secured and more opportunities and benefits can be proved effective.”
Get started today
Go from raw data to valuable insights with a flexible research platform
Editor’s picks
Last updated: 21 December 2023
Last updated: 16 December 2023
Last updated: 17 February 2024
Last updated: 19 November 2023
Last updated: 5 March 2024
Last updated: 15 February 2024
Last updated: 11 March 2024
Last updated: 12 December 2023
Last updated: 6 March 2024
Last updated: 10 April 2023
Last updated: 20 December 2023
Latest articles
Related topics, log in or sign up.
Get started for free

Comparative Graphs: An Explanation With Examples
Every day, 2.5 quintillion bytes of data are generated. If you are working with data, you know that presenting it in a way that is easy to understand and analyze is key. That’s where comparative graphs come in.
By displaying information visually, comparative graphs can help you identify patterns , trends, and relationships between variables that might not be immediately apparent in raw data.
But not all of them are created equal, and choosing the right type of visualization can be crucial to effectively communicate your message.
In this blog, we will explore the different types of comparative graphs and provide real-life examples.
We’ll also provide step-by-step instructions on how to create them, so you can start using graphs to enhance your data analysis skills and improve your presentations.
What Are Comparative Graphs?

Comparative graphs are visual representations of data that are used to compare and contrast two or more data sets.
They are commonly used in data analysis to identify patterns, trends, and relationships between variables.
Such graphs come in many different types, including bar graphs, line graphs, scatterplots, and more.
They can be used to compare data across different categories, over time, or across different variables.
By displaying information visually, graphs can make it easier to understand complex data and draw meaningful insights from it.
Whether you are a student, researcher, or data analyst, knowing how to create and interpret graphs can be a valuable skill that can help you to communicate your findings more effectively and make better-informed decisions based on data.
Examples Of Comparison Graphs

There are many different types of comparative graphs , each with its own strengths and weaknesses. Here are some examples of the most common types:
1. Bar Graphs
Comparative bar graphs are used to compare data across different categories. They are made up of bars that represent the value of each category.
Comparative bar graphs are useful when you want to compare data that is discrete and non-continuous.
2. Line Graphs
Line graphs are used to show trends over time. They are made up of a series of points connected by lines, with each point representing the value of the data at a specific time.
3. Scatterplots
Scatterplots are used to show the relationship between two variables. They are made up of points that represent each data point, with one variable plotted on the x-axis and the other on the y-axis.
4. Stacked Bar Graphs
Stacked bar graphs are used to compare the composition of two or more data sets. They are made up of bars that are divided into sections, with each section representing a different category.
5. Comparative Advantage Graphs
A comparative advantage graph is a visual representation of the concept of comparative advantage in economics.
Comparative advantage graphs show the relationship between two countries and their respective production possibilities frontiers (PPFs) for two goods.
The PPF represents the maximum amount of goods that a country can produce given its resources and technology.
These are just a few examples of graphs for comparison, and there are many others to choose from depending on the type of data you are working with and the insights you want to draw from it.
How To Create Effective Comparative Graphs For Data Visualization

Creating effective comparative graphs requires more than just putting numbers and labels on a chart.
To truly communicate insights and trends, it is essential to understand how to design graphs in a way that is easy to read, visually engaging, and accurately conveys the message you want to share.
In this section, we will explore some key principles and tips for creating effective comparison graphs that will help you present your data clearly and compellingly.
1. Choose the Right Type of Graph
The first step to creating an effective comparison graph is to choose the right type of graph for your data.
There are many different types of graphs, and each has its strengths and weaknesses.
For example, if you want to compare data across different categories, a bar graph might be the best choice, while if you want to show trends over time, a line graph might be more appropriate.
Make sure to choose a graph type that effectively communicates the information you want to convey.
2. Simplify the Graph
While it might be tempting to include as much information as possible in your graph, it’s important to keep it simple and easy to understand.
Avoid cluttering the graph with unnecessary data or labels, and make sure that the important information is visible. Use color sparingly and strategically to highlight important data points or to group related data.
3. Label Axes Clearly
One of the most important elements of any graph is the axis labels .
Make sure to label both the x and y axes clearly, and include units of measurement where appropriate. This will help the viewer understand what the graph is showing and how to interpret the data.
For example, if you are graphing the height of two different buildings, make sure to label the y-axis with “height (in feet).” This way, the viewer can easily see how tall each building is and compare them side-by-side.
Similarly, if you are comparing temperatures in two different cities, be sure to label the x-axis with “temperature (in degrees Fahrenheit).”
By including this information, viewers will be able to understand your data and make informed comparisons.
4. Use Consistent Scales
When creating a graph for comparison, it is extremely important to use consistent scales on both the x and y axes.
This will ensure that the viewer can accurately compare the data points and draw meaningful conclusions. If you need to use different scales, make sure to indicate this on the graph.
Otherwise, the viewer will not be able to discern the differences between the data sets, and your graph will be meaningless.
5. Provide Context
If you want to make your graph more meaningful, it’s important to provide context.
This might include adding a title that clearly describes the data being presented, including a brief explanation of the data source, or providing a key or legend to explain any symbols or colors used in the graph.
By doing this, you’ll help your audience understand what the data means and how to interpret it correctly.
6. Choose Appropriate Data Range
When creating a graph, it is important to carefully consider which data to include and which to leave out. You don’t want to include too much data, as this can make the graph difficult to read, but you also don’t want to leave out any important information.
The best way to select the appropriate range of data is to look at all of the data points and identify any outliers or extreme values.
Once you have identified these values, you can then adjust the range of the graph accordingly so that all of the data is accurately represented.
By following these tips, you can create effective comparison graphs that effectively communicate your data and help you draw meaningful insights.
Revolutionize Your Data Visualization: Create Eye-Catching and Insightful Graphs with Dotnet Report
Dotnet Report is a game-changing ad hoc reporting engine that empowers users to generate powerful comparative graphs with ease.
As an embeddable solution, it seamlessly integrates with existing applications to provide users with a comprehensive reporting tool right at their fingertips.
Dotnet Report’s intuitive interface and user-friendly design make it accessible to users of all skill levels, enabling them to create comparative graphs that effectively communicate data insights.
Here are some of the features that make Dotnet Report stand out in the market:
- Customizable dashboards, charts, and graphs
- Open source f ront-end
- Restricted data access
- Automated report scheduler
- Drill-down reports
With Dotnet Report , users have complete control over the look and feel of their graphs, from the color scheme to the labeling and formatting options.
By offering a flexible and customizable solution, we enable users to create truly useful graphs that accurately and effectively convey important data trends and insights.
So what are you waiting for? Schedule a demo with Dotnet Report today and see how we can take your data visualization to the next level!
Final Thoughts
Whether you are working with numerical data, categorical data, or a combination of both, many different types of comparison graphs can be used to effectively communicate insights and findings.
By using some of the best practices and principles discussed in this article, you can create graphs that are both visually appealing and informative and that help you make better data-driven decisions.
So don’t be afraid to experiment with different graph types and customization options, and remember that the most effective comparative graphs are the ones that best convey the insights you want to share.
Frequently Asked Questions
1. what is comparative analysis in simple words.
Comparative analysis is the process of comparing two or more things to understand how they are similar or different.
It involves identifying and analyzing the key characteristics, attributes, or variables of the things being compared, and using this information to draw meaningful conclusions or insights.
Comparative analysis can be used in a wide range of fields, from business and economics to social sciences and humanities, and can help us better understand complex systems, phenomena, or relationships.
2. What is an example of big data in statistics?
One common application of big data in statistics is in analyzing consumer behavior and preferences in online shopping.
Online retailers like Amazon and eBay collect massive amounts of data on customer browsing and purchasing patterns, which can be used to identify trends and develop targeted marketing strategies.
By analyzing big data sets that include customer demographics, purchase histories, and online interactions, statisticians can gain insights into consumer behavior that can inform business decisions and improve the customer experience.
Leave a Reply Cancel reply
Your email address will not be published. Required fields are marked *
Save my name, email, and website in this browser for the next time I comment.

dotnet Report Builder is led by software developers, and we are dedicated to providing a fast, simple and secure Reporting and Analytics solution to other Software Developers.
Useful Links
Copyright © www.dotnetreport.com 2024. All Rights Reserved. Privacy and Cookies Policy

Self Service Embedded Analytics
Need Reporting & Analytics?
Join us for a live product demo!We’ll walk you through our solution and answer any questions you have.

- Utility Menu
GA4 Tracking Code
Gen ed writes, writing across the disciplines at harvard college.
- Comparative Analysis
What It Is and Why It's Useful
Comparative analysis asks writers to make an argument about the relationship between two or more texts. Beyond that, there's a lot of variation, but three overarching kinds of comparative analysis stand out:
- Coordinate (A ↔ B): In this kind of analysis, two (or more) texts are being read against each other in terms of a shared element, e.g., a memoir and a novel, both by Jesmyn Ward; two sets of data for the same experiment; a few op-ed responses to the same event; two YA books written in Chicago in the 2000s; a film adaption of a play; etc.
- Subordinate (A → B) or (B → A ): Using a theoretical text (as a "lens") to explain a case study or work of art (e.g., how Anthony Jack's The Privileged Poor can help explain divergent experiences among students at elite four-year private colleges who are coming from similar socio-economic backgrounds) or using a work of art or case study (i.e., as a "test" of) a theory's usefulness or limitations (e.g., using coverage of recent incidents of gun violence or legislation un the U.S. to confirm or question the currency of Carol Anderson's The Second ).
- Hybrid [A → (B ↔ C)] or [(B ↔ C) → A] , i.e., using coordinate and subordinate analysis together. For example, using Jack to compare or contrast the experiences of students at elite four-year institutions with students at state universities and/or community colleges; or looking at gun culture in other countries and/or other timeframes to contextualize or generalize Anderson's main points about the role of the Second Amendment in U.S. history.
"In the wild," these three kinds of comparative analysis represent increasingly complex—and scholarly—modes of comparison. Students can of course compare two poems in terms of imagery or two data sets in terms of methods, but in each case the analysis will eventually be richer if the students have had a chance to encounter other people's ideas about how imagery or methods work. At that point, we're getting into a hybrid kind of reading (or even into research essays), especially if we start introducing different approaches to imagery or methods that are themselves being compared along with a couple (or few) poems or data sets.
Why It's Useful
In the context of a particular course, each kind of comparative analysis has its place and can be a useful step up from single-source analysis. Intellectually, comparative analysis helps overcome the "n of 1" problem that can face single-source analysis. That is, a writer drawing broad conclusions about the influence of the Iranian New Wave based on one film is relying entirely—and almost certainly too much—on that film to support those findings. In the context of even just one more film, though, the analysis is suddenly more likely to arrive at one of the best features of any comparative approach: both films will be more richly experienced than they would have been in isolation, and the themes or questions in terms of which they're being explored (here the general question of the influence of the Iranian New Wave) will arrive at conclusions that are less at-risk of oversimplification.
For scholars working in comparative fields or through comparative approaches, these features of comparative analysis animate their work. To borrow from a stock example in Western epistemology, our concept of "green" isn't based on a single encounter with something we intuit or are told is "green." Not at all. Our concept of "green" is derived from a complex set of experiences of what others say is green or what's labeled green or what seems to be something that's neither blue nor yellow but kind of both, etc. Comparative analysis essays offer us the chance to engage with that process—even if only enough to help us see where a more in-depth exploration with a higher and/or more diverse "n" might lead—and in that sense, from the standpoint of the subject matter students are exploring through writing as well the complexity of the genre of writing they're using to explore it—comparative analysis forms a bridge of sorts between single-source analysis and research essays.
Typical learning objectives for single-sources essays: formulate analytical questions and an arguable thesis, establish stakes of an argument, summarize sources accurately, choose evidence effectively, analyze evidence effectively, define key terms, organize argument logically, acknowledge and respond to counterargument, cite sources properly, and present ideas in clear prose.
Common types of comparative analysis essays and related types: two works in the same genre, two works from the same period (but in different places or in different cultures), a work adapted into a different genre or medium, two theories treating the same topic; a theory and a case study or other object, etc.
How to Teach It: Framing + Practice
Framing multi-source writing assignments (comparative analysis, research essays, multi-modal projects) is likely to overlap a great deal with "Why It's Useful" (see above), because the range of reasons why we might use these kinds of writing in academic or non-academic settings is itself the reason why they so often appear later in courses. In many courses, they're the best vehicles for exploring the complex questions that arise once we've been introduced to the course's main themes, core content, leading protagonists, and central debates.
For comparative analysis in particular, it's helpful to frame assignment's process and how it will help students successfully navigate the challenges and pitfalls presented by the genre. Ideally, this will mean students have time to identify what each text seems to be doing, take note of apparent points of connection between different texts, and start to imagine how those points of connection (or the absence thereof)
- complicates or upends their own expectations or assumptions about the texts
- complicates or refutes the expectations or assumptions about the texts presented by a scholar
- confirms and/or nuances expectations and assumptions they themselves hold or scholars have presented
- presents entirely unforeseen ways of understanding the texts
—and all with implications for the texts themselves or for the axes along which the comparative analysis took place. If students know that this is where their ideas will be heading, they'll be ready to develop those ideas and engage with the challenges that comparative analysis presents in terms of structure (See "Tips" and "Common Pitfalls" below for more on these elements of framing).
Like single-source analyses, comparative essays have several moving parts, and giving students practice here means adapting the sample sequence laid out at the " Formative Writing Assignments " page. Three areas that have already been mentioned above are worth noting:
- Gathering evidence : Depending on what your assignment is asking students to compare (or in terms of what), students will benefit greatly from structured opportunities to create inventories or data sets of the motifs, examples, trajectories, etc., shared (or not shared) by the texts they'll be comparing. See the sample exercises below for a basic example of what this might look like.
- Why it Matters: Moving beyond "x is like y but also different" or even "x is more like y than we might think at first" is what moves an essay from being "compare/contrast" to being a comparative analysis . It's also a move that can be hard to make and that will often evolve over the course of an assignment. A great way to get feedback from students about where they're at on this front? Ask them to start considering early on why their argument "matters" to different kinds of imagined audiences (while they're just gathering evidence) and again as they develop their thesis and again as they're drafting their essays. ( Cover letters , for example, are a great place to ask writers to imagine how a reader might be affected by reading an their argument.)
- Structure: Having two texts on stage at the same time can suddenly feel a lot more complicated for any writer who's used to having just one at a time. Giving students a sense of what the most common patterns (AAA / BBB, ABABAB, etc.) are likely to be can help them imagine, even if provisionally, how their argument might unfold over a series of pages. See "Tips" and "Common Pitfalls" below for more information on this front.
Sample Exercises and Links to Other Resources
- Common Pitfalls
- Advice on Timing
- Try to keep students from thinking of a proposed thesis as a commitment. Instead, help them see it as more of a hypothesis that has emerged out of readings and discussion and analytical questions and that they'll now test through an experiment, namely, writing their essay. When students see writing as part of the process of inquiry—rather than just the result—and when that process is committed to acknowledging and adapting itself to evidence, it makes writing assignments more scientific, more ethical, and more authentic.
- Have students create an inventory of touch points between the two texts early in the process.
- Ask students to make the case—early on and at points throughout the process—for the significance of the claim they're making about the relationship between the texts they're comparing.
- For coordinate kinds of comparative analysis, a common pitfall is tied to thesis and evidence. Basically, it's a thesis that tells the reader that there are "similarities and differences" between two texts, without telling the reader why it matters that these two texts have or don't have these particular features in common. This kind of thesis is stuck at the level of description or positivism, and it's not uncommon when a writer is grappling with the complexity that can in fact accompany the "taking inventory" stage of comparative analysis. The solution is to make the "taking inventory" stage part of the process of the assignment. When this stage comes before students have formulated a thesis, that formulation is then able to emerge out of a comparative data set, rather than the data set emerging in terms of their thesis (which can lead to confirmation bias, or frequency illusion, or—just for the sake of streamlining the process of gathering evidence—cherry picking).
- For subordinate kinds of comparative analysis , a common pitfall is tied to how much weight is given to each source. Having students apply a theory (in a "lens" essay) or weigh the pros and cons of a theory against case studies (in a "test a theory") essay can be a great way to help them explore the assumptions, implications, and real-world usefulness of theoretical approaches. The pitfall of these approaches is that they can quickly lead to the same biases we saw here above. Making sure that students know they should engage with counterevidence and counterargument, and that "lens" / "test a theory" approaches often balance each other out in any real-world application of theory is a good way to get out in front of this pitfall.
- For any kind of comparative analysis, a common pitfall is structure. Every comparative analysis asks writers to move back and forth between texts, and that can pose a number of challenges, including: what pattern the back and forth should follow and how to use transitions and other signposting to make sure readers can follow the overarching argument as the back and forth is taking place. Here's some advice from an experienced writing instructor to students about how to think about these considerations:
a quick note on STRUCTURE
Most of us have encountered the question of whether to adopt what we might term the “A→A→A→B→B→B” structure or the “A→B→A→B→A→B” structure. Do we make all of our points about text A before moving on to text B? Or do we go back and forth between A and B as the essay proceeds? As always, the answers to our questions about structure depend on our goals in the essay as a whole. In a “similarities in spite of differences” essay, for instance, readers will need to encounter the differences between A and B before we offer them the similarities (A d →B d →A s →B s ). If, rather than subordinating differences to similarities you are subordinating text A to text B (using A as a point of comparison that reveals B’s originality, say), you may be well served by the “A→A→A→B→B→B” structure.
Ultimately, you need to ask yourself how many “A→B” moves you have in you. Is each one identical? If so, you may wish to make the transition from A to B only once (“A→A→A→B→B→B”), because if each “A→B” move is identical, the “A→B→A→B→A→B” structure will appear to involve nothing more than directionless oscillation and repetition. If each is increasingly complex, however—if each AB pair yields a new and progressively more complex idea about your subject—you may be well served by the “A→B→A→B→A→B” structure, because in this case it will be visible to readers as a progressively developing argument.
As we discussed in "Advice on Timing" at the page on single-source analysis, that timeline itself roughly follows the "Sample Sequence of Formative Assignments for a 'Typical' Essay" outlined under " Formative Writing Assignments, " and it spans about 5–6 steps or 2–4 weeks.
Comparative analysis assignments have a lot of the same DNA as single-source essays, but they potentially bring more reading into play and ask students to engage in more complicated acts of analysis and synthesis during the drafting stages. With that in mind, closer to 4 weeks is probably a good baseline for many single-source analysis assignments. For sections that meet once per week, the timeline will either probably need to expand—ideally—a little past the 4-week side of things, or some of the steps will need to be combined or done asynchronously.
What It Can Build Up To
Comparative analyses can build up to other kinds of writing in a number of ways. For example:
- They can build toward other kinds of comparative analysis, e.g., student can be asked to choose an additional source to complicate their conclusions from a previous analysis, or they can be asked to revisit an analysis using a different axis of comparison, such as race instead of class. (These approaches are akin to moving from a coordinate or subordinate analysis to more of a hybrid approach.)
- They can scaffold up to research essays, which in many instances are an extension of a "hybrid comparative analysis."
- Like single-source analysis, in a course where students will take a "deep dive" into a source or topic for their capstone, they can allow students to "try on" a theoretical approach or genre or time period to see if it's indeed something they want to research more fully.
- DIY Guides for Analytical Writing Assignments

- Types of Assignments
- Unpacking the Elements of Writing Prompts
- Formative Writing Assignments
- Single-Source Analysis
- Research Essays
- Multi-Modal or Creative Projects
- Giving Feedback to Students
Assignment Decoder
What is a Comparison Chart and How Do You Use It?

As its name implies, a comparison chart or comparison graph draws a comparison between two or more items across different parameters. You might use a comparison chart to look at similarities and differences between items, weigh multiple products or services in order to choose one, or present a lot of data in an easy-to-read format.
If you need help choosing which to use for your presentation, read about the different comparison charts Beautiful.ai offers for your presentation below.
Venn Diagram
A Venn diagram is one of the most well-known diagrams used to compare and contrast data. It’s made up of multiple overlapping circles, each representing a set of data. The common elements between each set of data are represented by the areas of overlap within the circles.
.jpeg "comparative analysis example graph")
Venn diagrams make it easy for the viewer to understand how multiple things are alike and different at the same time. It can also show a specific relationship between sets of data. For example, if you want to explain that your ideal client for your arts and crafts business is 25 to 34 years old, creative, and lives in the United States, you might use a Venn diagram template in your presentation to show that easily.
Also called a scatter plot or scatter graph, an XY plot uses dots to display values for two variables.

An XY plot shows one of three types of relationships (typically called correlation):
- positive correlation: as one variable increases, so does the other
- negative correlation: as one variable increases, the other decreases
- no correlation: there is no apparent relationship between the variables
Use an XY plot if you need to find a pattern or relationship within a set of multiple data points.
A quadrant chart is visually similar to an XY plot. However, instead of a horizontal x-axis and a vertical y-axis, a quadrant chart is divided into four quarters (quadrants). Quadrant charts are also sometimes called matrix models or bubble charts. You can use a quadrant chart to plot data categorized into these quadrants, and use the dot size to indicate quantity.

Quadrant charts are often used for an Eisenhower Matrix for time management, a PEST analysis, or a SWOT analysis.
SWOT Analysis
“SWOT” stands for strengths, weaknesses, opportunities, and threats. It’s often displayed in a quadrant chart format to analyze a person or an organization. A SWOT analysis helps you figure out what you do well, what could be improved, which opportunities you can take advantage of, and what threats you need to be aware of.
.jpeg "comparative analysis example graph")
A SWOT analysis slide might be used in a company-wide annual meeting to get all employees on the same page. It might also be used in an employee performance review to discuss progress so far and goals for the future.
Pictograph/Percentage Comparison
If you want to give a more engaging view of small sets of data, you can use a percentage comparison or pictograph template in your presentation. Instead of plotting number data on a graph or quadrant, a pictograph chart uses rows of icons to represent data subjects or categories. You can also use it to represent data in percentages.

Let’s say you want to display the number of people in the United States who bought a new car last year, which was 40%. You could create a row of ten icons and make four of them a different color or fill. It’s a more compelling, interesting way to display a data fact.
Radial Bar Chart and Compare Bars
Looking for a different way to display percentages, or an interesting twist on a regular bar chart ? Try a radial bar chart. You might use one radial bar chart with multiple bars to compare and contrast different data sets. In this kind of bar chart, each bar is plotted along a circular grid instead of an XY-axis.

Or, you can create one radial chart (one circle) for each data set and compare them side by side to display different percentages. A compare bars chart displays information in a similar way to a radial bar chart. One bar represents the percentage of a whole, and is displayed next to other bars representing different percentages.
Compare Slices and Compare Columns
A compare slice chart is another way to display percentages. A compare slice chart is visually similar to a pie chart. Instead of cutting a circle into “pie” slices, a compare slice chart partitions a bar into smaller blocks. In a compare slice chart, you can show how multiple blocks make up part of the whole bar.

Compare columns are handy for comparing or contrasting related statistics. Similar to a bar graph but not requiring a grid, compare columns can easily provide visual representation of your data. For example, you might create multiple columns to express how many customers your company has reached compared to your competitors.
Compare Circles and Floating Circles
Prefer a different visual layout? Try compare circles . Compare circles provide a clear snapshot of how data relates to one another using differently sized circles. The viewer can see at a glance the relationship between circles and their respective statistics.

If you have multiple data points and you need to give a broad overview of their impact, a floating circle chart might be more appropriate for your presentation.

When you need a minimalist yet slightly dressed up list, try arrow bars to add some impact to your presentation. Arrow bars can be used to list steps in a process, share statistics, or explain relationships between items. Rather than plain black dots in a bullet list, arrow bars imply change, movement, and direction. They can make the data in your list more compelling and dynamic.
.jpeg "comparative analysis example graph")
Compare your data with Beautiful.ai
When you’re ready to display your data in a compelling and easy to read comparison chart, choose one of Beautiful.ai’s customizable slide templates . From comparison graphs to diagrams to lists and more, Beautiful.ai has everything you need to build an effective, memorable presentation.

Beautiful.AI Team
Beautiful is an AI-powered presentation tool that makes it fast and easy for anyone to build clean, modern and professionally designed slides that they can be proud of.
Recommended Articles
Battle of the charts: gantt vs. kanban, a data visualization duel: scattergraph vs. quadrant, communicating accounting data across the org in a way everyone will understand, presentation design 201: brain-friendly hacks for visualizing your data.
- Skip to main content
- Skip to primary sidebar
- Skip to footer
- QuestionPro

- Solutions Industries Gaming Automotive Sports and events Education Government Travel & Hospitality Financial Services Healthcare Cannabis Technology Use Case NPS+ Communities Audience Contactless surveys Mobile LivePolls Member Experience GDPR Positive People Science 360 Feedback Surveys
- Resources Blog eBooks Survey Templates Case Studies Training Help center
Home Market Research Research Tools and Apps
Comparative Analysis: What It Is & How to Conduct It

When a business wants to start a marketing campaign or grow, a comparative analysis can give them information that helps them make crucial decisions. This analysis gathers different data sets to compare different options so a business can make good decisions for its customers and itself. If you or your business want to make good decisions, learning about comparative analyses could be helpful.
In this article, we’ll explain the comparative analysis and its importance. We’ll also learn how to do a good in-depth analysis .
What is comparative analysis?
Comparative analysis is a way to look at two or more similar things to see how they are different and what they have in common.
It is used in many ways and fields to help people understand the similarities and differences between products better. It can help businesses make good decisions about key issues.
One meaningful way it’s used is when applied to scientific data. Scientific data is information that has been gathered through scientific research and will be used for a certain purpose.
When it is used on scientific data, it determines how consistent and reliable the data is. It also helps scientists make sure their data is accurate and valid.
Importance of comparative analysis
Comparative analyses are important if you want to understand a problem better or find answers to important questions. Here are the main goals businesses want to reach through comparative analysis.
- It is a part of the diagnostic phase of business analytics. It can answer many of the most important questions a company may have and help you figure out how to fix problems at the company’s core to improve performance and even make more money.
- It encourages a deep understanding of the opportunities that apply to specific processes, departments, or business units. This analysis also ensures that we’re addressing the real reasons for performance gaps.
- It is used a lot because it helps people understand the challenges an organization has faced in the past and the ones it faces now. This method gives objective, fact-based information about performance and ways to improve it.
How to successfully conduct it
Consider using the advice below to carry out a successful comparative analysis:
Conduct research
Before doing an analysis, it’s important to do a lot of research . Research not only gives you evidence to back up your conclusions, but it might also show you something you hadn’t thought of before.
Research could also tell you how your competitors might handle a problem.
Make a list of what’s different and what’s the same.
When comparing two things in a comparative analysis, you need to make a detailed list of the similarities and differences.
Try to figure out how a change to one thing might affect another. Such as how increasing the number of vacation days affects sales, production, or costs.
A comparative analysis can also help you find outside causes, such as economic conditions or environmental analysis problems.
Describe both sides
Comparative analysis may try to show that one argument or idea is better, but the analysis must cover both sides equally. The analysis shows both sides of the main arguments and claims.
For example, to compare the benefits and drawbacks of starting a recycling program, one might examine both the positive effects, such as corporate responsibility and the potential negative effects, such as high implementation costs, to make wise, practical decisions or come up with alternate solutions.
Include variables
A thorough comparison unit of analysis is usually more than just a list of pros and cons because it usually considers factors that affect both sides.
Variables can be both things that can’t be changed, like how the weather in the summer affects shipping speeds, and things that can be changed, like when to work with a local shipper.
Do analyses regularly
Comparative analyses are important for any business practice. Consider the different areas and factors that a comparative analysis looks at:
- Competitors
- How well do stocks
- Financial position
- Profitability
- Dividends and revenue
- Development and research
Because a comparative analysis can help more than one department in a company, doing them often can help you keep up with market changes and stay relevant.
We’ve talked about how good a comparative analysis is for your business. But things always have two sides. It is a good workaround, but still do your own user interviews or user tests if you can.
We hope you have fun doing comparative analyses! Comparative analysis is always a method you like to use, and the point of learning from competitors is to add your own ideas. In this way, you are not just following but also learning and making.
QuestionPro can help you with your analysis process, create and design a survey to meet your goals, and analyze data for your business’s comparative analysis.
At QuestionPro, we give researchers tools for collecting data, like our survey software and a library of insights for all kinds of l ong-term research . If you want to book a demo or learn more about our platform, just click here.
LEARN MORE FREE TRIAL
MORE LIKE THIS

In-App Feedback Tools: How to Collect, Uses & 14 Best Tools
Mar 29, 2024

11 Best Customer Journey Analytics Software in 2024

17 Best VOC Software for Customer Experience in 2024
Mar 28, 2024

CEM Software: What it is, 7 Best CEM Software in 2024
Other categories.
- Academic Research
- Artificial Intelligence
- Assessments
- Brand Awareness
- Case Studies
- Communities
- Consumer Insights
- Customer effort score
- Customer Engagement
- Customer Experience
- Customer Loyalty
- Customer Research
- Customer Satisfaction
- Employee Benefits
- Employee Engagement
- Employee Retention
- Friday Five
- General Data Protection Regulation
- Insights Hub
- Life@QuestionPro
- Market Research
- Mobile diaries
- Mobile Surveys
- New Features
- Online Communities
- Question Types
- Questionnaire
- QuestionPro Products
- Release Notes
- Research Tools and Apps
- Revenue at Risk
- Survey Templates
- Training Tips
- Uncategorized
- Video Learning Series
- What’s Coming Up
- Workforce Intelligence
Comparison Charts

Table of Contents
What is a comparison chart.
Also known as a comparative diagram, a comparison chart provides a visual representation of different choices or options. This helps you draw a comparison between two or more items across different parameters. Making a comparison chart is a useful way to compare either quantitative or qualitative information.
Comparison charts are typically made in the form of a table, with each option or item in its own column. This tabular format makes it easy to quickly compare the details of your options.
For instance, let’s say you’re trying to decide between different project management software solutions. With a comparison chart, you can look at each solution’s advantages, disadvantages, prices, reviews, and features, making it easier to choose between them.
Comparison charts are used to compare various things and ideas. They can provide a visual representation of strategies, ideas, actions, products, competitors, suppliers, and so much more. Visualizing different routes and consequences is a great way for managers to gain clarity on the best steps to take. It is especially helpful in strategic planning for business growth.
Advantages of comparison charts
Here’s why comparison charts are so helpful for making decisions and comparing data:
They can help you compare lots of options
Comparison charts are useful in just about any situation that requires you to make a decision. They aren’t constrained by certain types of decisions but instead are used to weigh up pretty much anything against something else.
You can use comparison charts to compare not just two options but entire data sets. From simple day-to-day choices to complex decisions with far-reaching consequences, comparison charts are useful, versatile tools.
They can help you make informed decisions
It can be tempting to make a decision based on a gut feeling. In some cases, this can lead to a positive outcome. But for a business to have sustained, long-term success, it’s important to make informed decisions based on facts.
Compiling information and taking your time before jumping into a decision is the least risky way to ensure long-term business growth and success. Decisions don’t have to be “make or break” if they’re properly considered and each option’s merits are carefully weighed.
They’re a great tool for drawing ideas from your team
It’s good practice to create comparison charts with your team. Getting different perspectives and ideas on decisions, products, and competitors can lead you to innovate ideas you may never have thought of before.
They’re easy to interpret
One of the best parts about comparison charts is that they are simple and concise. They use tables and simple language, making it easy for any team member to interpret and help with the decision-making process.
They’re a good way to influence others
Comparison charts are helpful tools to bring to meetings and presentations with people like clients or shareholders. Showing your decision-making process might convince potential clients that going with your company is the right move.
How to create a comparison chart
Follow these steps to create a comparison chart customized to your needs:
1. List the available options
The point of a comparison chart is to compare different options and decisions. If you have only one option, then there is nothing to compare. Before you start creating your table, list your top options so you know what you’ll be comparing.
2. Create a table, and customize it to your needs
Use the correct number of rows and columns to split up the various options you want to compare. If you want to create your own table from scratch, try out Miro’s comparison chart maker .
Or, if you’d rather build onto an already-made template, take a look at this Comparison Chart Template for a quick way to get started.

3. Brainstorm and gather ideas
Brainstorming is a great exercise to gather different ideas and identify the finer details of your options. Plan a brainstorming session with your team to map out each option’s pros, cons, consequences, and more.
4. Map them onto the table
Now it’s time to do the actual comparison. Place all your ideas into the different sections that you’ve mapped out on your chart. Collaborate with your team and begin deciding which options will be best for your business.
5. Add visuals and color
Don’t be afraid to add a bit of pizzazz to your chart. This is ultimately a visual tool, so adding color and media will help keep your audience engaged. Once your comparison chart is complete, share it with your team to get their feedback.
Comparison chart examples
Let’s look at some examples of comparison charts in action.
Comparing tools or software
A comparison chart makes it easy to visually compare different types of software, such as the various CRM tools on the market. Whether you’re a business or a freelancer, you’ll want to make the right choices when it comes to the software you’ll use.
A comparison chart compares key features of each software, like email tracking, process automation, and app integrations. By the end of this comparison, the team should have a better idea of which software offers the best features for the best price.

Deciding between job opportunities
Comparison charts aren’t only useful for company-wide business decisions — they’re also helpful for making personal decisions. If you are applying for jobs and have different job offers on the table, a comparison chart is a great way to compare and contrast the opportunities.
In this example a comparison chart compares key data points, like role, manager, colleagues, and company culture, between different jobs. Mapping this important information into a table can help make an informed career decision about what job is the best fit.
Comparison chart best practices
Follow these tips to ensure your chart guides you toward a well-balanced, properly considered decision:
Use the right tool
Creating charts and tables from scratch can be tricky, especially if it’s your first time doing so. Instead, you could make use of online chart-making tools, like Miro’s comparison chart maker . This tool will help you create a chart that’s effective and easy to interpret right from the get-go.
Include your team
If the decision is going to impact your team, you should include them in the decision-making process. Gaining and using different perspectives will only enhance the comparison and decision-making process.
Take note of formatting
Comparison charts are meant to be easy to interpret because of their simple format. Take note of the comparison chart examples above and try not to deviate from their format too much. Don’t add too much text, and keep it simple. If your chart gets cluttered, your decision-making process suffers, too.
Use visuals to your advantage
Use color and media to your advantage to make the chart more engaging. This will also make it more impactful and memorable and encourage your viewers to retain the information.
Other ways to compare your ideas
Comparison charts aren’t the only solution for comparing ideas and making informed decisions. Many other charts, tables, and other tools have been devised for the same reason.
Here are a few templates to get you started.
A T-Chart, like a comparison chart, is a visual tool that allows you to input information, ideas, and more to help you decide between two different options. Miro’s T-Chart Template is structured specifically to compare the advantages and disadvantages of two choices.
Like other comparison charts, a comparison matrix is used to compare different elements, components, or data sets. These charts are particularly useful if you have more than two options to compare.
The Feature Comparison Matrix Template is designed to help organizations evaluate the capabilities of different software options. It can help decision-makers compare tools by considering product capabilities like user experience, app integrations, and available templates.
Bar graphs are sometimes thought of not as a comparative tool but rather a tool to display different sets of data. But by displaying different sets of data alongside one another, this Bar Graph Template inherently allows you to compare those data sets.
You can use colors, labels, and categories to easily analyze data by comparing the rectangular bars next to each other. In addition to comparing data, bar graphs are useful for tracking trends over time.
Pie charts are a popular visual tool for providing an easy-to-read comparative analysis. Imagine a situation where you have a room of potential shareholders and want to compare the current stockholders’ percentages in the company. Is there any better way to do that than by using a simple Pie Chart Template ? Easy to understand at a glance, there’s a reason these colorful charts are used all the time.

Venn diagram
Venn diagrams are useful for comparative purposes, as they allow you to see the differences between two or more options while also conveying what your options have in common. A Venn Diagram Template is ideal for visualizing the logical relation between multiple sets of data.
What’s the next step after making a comparison chart?
So you’ve spent time making the chart and comparing different options with your team — now what?
Once completed, comparison charts can help you decide on a business strategy or course of action for personal growth. Once you’ve decided on this strategy, you can implement it with other tools.
Frameworks like the Action Plan Template or Strategic Planning Template can give you the right guidance. Or, if needed, you can use another comparison chart to help you make informed decisions on the next actions to take.
Another great way to use comparison charts is to add them to infographics to make them more informative and engaging. You can showcase these infographics in an eye-catching presentation using Miro’s Presentation Maker . Highlight the best features of your product using a comparison table to show customers or investors how your product or service will benefit them.
Get on board in seconds
Join thousands of teams using Miro to do their best work yet.
Discover 20 Essential Types Of Graphs And Charts And When To Use Them

Table of Contents
1) What Are Graphs And Charts?
2) Charts And Graphs Categories
3) 20 Different Types Of Graphs And Charts
4) How To Choose The Right Chart Type
Data and statistics are all around us. It is very likely that you have found yourself looking at a chart or graph at work, in the news, sports, media, advertising, and many other places at some point in your life. That is because graphical representations of data make it easier to convey important information to different audiences. That said, there is still a lack of charting literacy due to the wide range of visuals available to us and the misuse of statistics . In many cases, even the chart designers are not picking the right visuals to convey the information in the correct way.
So, how do you make sure you are using and understanding graphs and charts in the right way? In this post, we will provide you with the necessary knowledge to recognize the top 20 most commonly used types of charts and graphs and give insights into when and how to use them correctly. Each type of chart will have a visual example generated with datapine’s professional dashboard software .
This knowledge will be valuable if you are a data visualization designer, a business user looking to incorporate visual analytics into his/her work, or just an average viewer looking to learn more about the topic. Let’s start this journey by looking at a definition.
What Are Graphs And Charts?
A graph or chart is a graphical representation of qualitative or quantitative data. It uses different symbols such as bars, lines, columns, tables, box plots, maps, and more, to give meaning to the information, making it easier to understand than raw data.
As you probably already know, multiple kinds of graphs and charts are widely used in various fields and industries such as business decision-making or research studies. These visual tools are used to find relationships between different data sets and extract valuable conclusions from them. In some cases, they are built by hand, and in others, most commonly, they are built using visualization tools.
That said, the type of chart or graph you use will vary depending on the aim of the analysis. For instance, percentages are better viewed through a pie or bar chart while data that is changing over time is better viewed over a line chart. For that reason, it is important to have a clear understanding of the different chart types to make sure you are using the right one.
Below we will discuss the graph and chart categories. These categories will build a solid foundation that will help you pick the right visual for your analytical aims. Let’s dive into them.
Charts And Graphs Categories
As mentioned, asking the right questions will form the foundations for choosing the right types of visualization graphs for your project, strategy, or business goals. The fundamental categories that differentiate these questions are based on:
- Relationship : Understanding connections between different data points can significantly help discover new relevant insights. For instance, in the medical field, analyzing relationships between diseases and gene interactions can help discover a treatment for a particular disease. When it comes to visuals, a few graphics can help you easily identify and represent relationships. Scatter plots are valuable when you want to represent smaller data sets of two variables while bubble graphs are best for larger information with three or more variables.
- Distribution: In statistics, distribution refers to the possibility of the occurrence of an outcome. To understand this, scientists and analysts use charts to represent the frequency distribution of the data and extract conclusions from it. For this purpose, they use line charts to analyze trends, scatter plots to highlight similarities across variables, and histograms to see the frequency distribution of a single variable across categories.
- Composition : The purpose of business graphs and charts for composition is to compare parts to a whole in absolute numbers and normalized forms, usually a percentage. It is one of the most common and traditionally used visualization categories and it is usually limited by the simplicity of the chart types. Common composition graphs include pies, tree maps, and stacked bar charts.
- Comparison: As its name suggests, this category refers to the comparison of multiple variables or multiple categories within a single variable. When comparing information it is fundamental to pick a chart that will make it easier to understand the differences. These differences can be within multiple elements, for example, top-selling products, or over time, such as the development of sales for different products over a year. For this purpose, tables, spiders, lines, columns, or area graphs are always a good choice.
To get a clearer impression, here is a visual overview of which chart to select based on what kind of data you need to show:

**click to enlarge**
Discover 20 Different Types Of Graphs And Charts
Now that you understand the key charting categories you are ready to dive into the main types of graphs and when to use them. Here, we will focus on the 20 most common types of visuals to represent your data in the most meaningful way possible. Each chart type has a visual example generated with datapine .
1) Number Chart

When to use
A real-time number chart is essentially a ticker that will give you an immediate overview of a particular KPI . At a glance, you can see any total such as sales, percentage of evolution, number of visitors, etc. This is probably the easiest visualization type to build with the only consideration being the period you want to track. Do you want to show an entire history or simply the latest quarter? It is crucial to label the period clearly so your audience understands what story you are telling. Adding a trend indicator compares your number to the previous period (or to a fixed goal, depending on what you are tracking).
Other considerations
Number charts are often the first thing people see and are the quickest to read, so if there are too many, your narrative can get diluted. Using too many can also make your dashboard a little superficial. If you want more in-depth information, limit the number of number graphs and leave room for other types of data visualization that drill down a little deeper.
When you add a trend indicator, we suggest you compare numbers from the same period. For example, if you are tracking total sales for the current quarter, compare that data to the same quarter last year (or last period – depending on your story). If you select a target manually (perhaps you have no accurate past data), be sure to set realistic goals to be able to get on top of your KPI management practice. Again, remember to label the trend indicator clearly so your audience knows exactly what they are looking at.
2) Line Chart

The purpose of a line chart is to show trends, accelerations (or decelerations), and volatility. They display relationships in how data changes over a period of time. In our example above, we are showing Revenue by Payment Method for all of 2019 . Right away, you can see that the credit card payments were the highest and that everything took a dip in September. The takeaways are quick to register yet have depth.
Too many lines (variables) can make your chart complicated and hard to decipher. You may also find your audience constantly referencing the legend to remind them which one they are looking at. If you have too many variables, it’s time to consider a second (or even third) chart to tell this story.
When it comes to layout, keep your numbers relevant. When you set up your axis scale, keep it close to the highest data point. For example, if we had set the y-axis above to track all the way to 200K (when our highest data point is just over 90K), our chart would have been squished and hard to read. The top half would have been wasted space, and the data crammed. Let your data breathe a little!
One more thing!
A great feature of line graphs is that you can combine them with other types of visualizations, such as bar graphs. Using a double y-axis, one for the bar graph and one for the line, allows you to show two elements of your story in one graph. The primary y-axis below shows orders (bar graph), and the secondary y-axis is sales totals (line). The metrics are different and useful independently, but together, they tell a compelling story.

Maps are great at visualizing your geographic data by location. The information on a map is often displayed in a colored area map (like above) or a bubble map. Because maps are so effective at telling a story, they are used by governments, media, NGOs, nonprofits, public health departments – the list goes on. Maps aren’t just for displaying data; they also direct action. This was seen most recently through the Zika outbreak. Mapping the spread of the disease has helped health officials track it and effectively distribute resources where they are most needed.
Even if you aren’t saving the world from Zika, maps can help! For example, they are great at comparing your organization’s sales in different regions.
Everyone loves maps. However, that doesn’t mean you always need to display one. If the location isn’t a necessary part of your analytics story, you don’t need a map. They take up a lot of room, so only use them when necessary. Also, don’t just fill your maps with data points. Clickhole did a good job of satirizing this common data visualization type by placing 700 red dots on a map. Filling your map with data points doesn’t tell a compelling story; it just overwhelms the audience.
4) Waterfall Chart

This extremely useful chart depicts the power of visualizing data in a static, yet informative manner. It shows the composition of data over a set time period, illustrating the positive or negative values that help in understanding the overall cumulative effect. The decrements and increments can cause the cumulative to fall below or above the axis at various points, causing a clear overview of how the initial value is affected. It is often used in financial departments for analytical purposes, usually depicting the changes in revenue or profit. For example, your MRR ( monthly recurring revenue ), new revenue, upsell, lost, and current revenue. In our example above, we can conclude that our current revenue increased in our set time period.
Waterfall charts are static in their presentation so if you need to show dynamic data sets, then stacked graphs would be a better choice. Also, showing the relationship between selected multiple variables is not optimal for waterfall charts (also known as Cascade charts), as bubble plots or scatter plots would be a more effective solution.
5) Bar Graphs
There are three key types of bar graphs that we will cover in this section: Horizontal, Grouped and Stacked. Although all are in the same chart family, each serves a distinct purpose. Let’s discuss each of them in detail below.
a) Horizontal Bar Graphs

Horizontal charts are perfect for comparative ranking, like a top-five list. They are also useful if your data labels are really long or complex. Keep them in an order that makes sense, though. Either list by value (like we did above) or, if that’s not the strength, choose a logic for the labels that makes sense, like listing them alphabetically.
Because time is best expressed left to right, it’s better to leave showing an evolution for the column chart. Also, like many charts, when you have too many values, a horizontal bar graph quickly becomes cluttered.
b) Grouped bar graph

When to Use
Grouped bar charts follow the same logic as horizontal bars, except that they show values for two variables instead of one. The two variables are often displayed in disparate colors to help differentiate them from each other. It is recommended to use this chart type when you want to compare elements within a specific category or across other categories on the chart. For instance, in our example generated with a customer service analytics tool, we can see customer service tickets by channel divided between the total and solved ones. In this case, the grouped chart can help compare the values between the total and unsolved tickets as well as compare the number of solved tickets across channels and extract conclusions.
Just like with the horizontal one, you need to be careful not to add too many categories into this graph type as they can make it look cluttered. The chart becomes difficult to read with the increase in categories, therefore, it is not the best when it comes to relationship or distribution analysis.
c) Stacked bar chart

When to Use
A stacked bar chart is a variation of the traditional bar graph but, instead of dealing with one categorical variable, it deals with two or more. Each bar is divided into multiple subcategories that are compared with each other usually using a percentage. In the example above, the chart is comparing management and non-management positions (first categorical variable) that are being occupied by female and diverse employees vs male employees (second categorical variable). This allows the users of the bar to not only focus on the comparisons between the bars themselves but also extract conclusions based on the subcategories from each individual bar.
When building a successful stacked bar graph it is important to carefully decide which of the two categorical variables will be the primary one. The primary one is the most important one and it will define the overall bar lengths. The secondary one will define the subcategories. Usually, if you are dealing with time ranges or numerical values, these make the best primary variables. However, it will vary from case to case.
6) Column Graphs

When to use
Column charts are the standard for showing chronological data, such as growth over specific periods, and for comparing data across categories (you can see this in the example where the accounts payable turnover is being compared based on date ranges). In general, for these kinds of charts, the categories are typically displayed on the horizontal axis while the numerical values are displayed vertically using rectangular columns. The size of the columns is proportional to the values displayed on the chart and their height allows people to easily extract conclusions at a glance. Unlike the bar chart which can display larger or more complex datasets, the column chart has a size limitation making it best to display smaller data. This makes it the go-to visualization for anyone looking for an easy and understandable way to display their information.
Aside from the obvious design mistakes like using too many colors or too many categories, other things you want to make sure of are: if there is no natural order for the data (e.g. age categories or time ranges), it is recommended to order the values from higher to lowest or lowest to highest. Additionally, the y-axis should always start at 0, otherwise, the height of the columns can become misleading.
c) Grouped column chart

Just like the grouped bar chart, the grouped column chart compares two categorical variables instead of one using vertical columns instead of horizontal bars. The purpose of this graph is to see how the subcategories from the secondary variable change within each subcategory of the primary variable. Comparisons can be done within-group or between groups depending on the aim of the analysis. In our sales data analysis example, Amount of Sales per Channel and Country (last year) , it is clear that we are comparing six regions and five channels. The color coding keeps the audience clued into which region we are referencing, and the proper spacing shows the channels (good design is at the heart of it all!). At a glance, you can see that SEM was the highest-earning channel, and with a little effort, the Netherlands stands out as the region that likely enjoyed the highest sales.
An important consideration when it comes to this graphic is to not use it to compare totals within the different levels of the categorical values. For this purpose, it is better to use a stacked column chart which we will discuss below.
b) Stacked Column Chart

Stacked charts handle part-to-whole relationships. This is when you are comparing data to itself rather than seeing a total – often in the form of percentages. In the example above, the story isn’t about the total number of customers aged 15-25, but that 22% of the customers were 15-25 in the first quarter of 2014 (and 26% in Q4). The numbers we are working with are relative only to our total.
When showing single part-to-whole relationships, pie charts are the simplest way to go. Twenty-two percent of our customers are 15-25, leaving the other 78% to fit into the pie somehow. People get pie charts. They’re easy. But what if we want to show the same information over different periods? This would be a multiple part-to-whole relationship, and for this, we use a stacked bar graph. Again, we are telling the story of the percentage of customers in a certain age range, per quarter . The total number of each isn’t relevant here (although that information is used in the calculations). With proper spacing, we see each quarter clearly, and the color coding shows that overall, 46-55-year-olds are the most difficult customers to attract.
Aesthetically speaking, when you have too much data, columns become very thin and ugly. This also leaves little room to properly label your chart. Imagine we had 10 different age ranges per column. Some results, if not most, would be only slivers. To make your chart easy to understand, use good colors, proper spacing, and a balanced layout. This invites people to look at your chart and even enjoy it. A pretty chart is a much nicer way to consume data than squinting at a table.
7) Pie Charts

The much-maligned pie chart has had a bad couple of years. In fact, it has become pretty cliché to talk about how bad pie charts are. We understand the pie chart doesn’t do a lot, but it does do some things quite well. Pie charts are useful when demonstrating the proportional composition of a particular variable over a static timeframe. Let’s look at some particular cases:
- When the parts add up to 100%: The “part-to-whole relationship” is built right into it a pie chart in an obvious way. At a glance, any user knows a pie chart is splitting a population into parts and that the total of those parts equals 100%.
- When approximating is okay: The pie chart is particularly effective when eyeballing values are enough to get the conversation going. Also, it’s easier to estimate the percentage value of a pie chart compared to, let’s say, a bar chart. That’s because pies have an invisible scale with 25%, 50%, 75%, and 100% built-in at four points of the circle. Our eyes can easily decipher these proportions, driving the conversation about what variables do and don’t take up most of the pie. Your audience doesn’t have to guess the proportions – you can easily add data labels or build the sister of the pie chart, the donut chart, to display additional information.
- When there aren’t many proportions to the variable or they are combined: Pie charts are great when answering questions like, “What two largest suppliers control 65% of the market?”
Your audience isn’t always going to be comprised of data scientists. Accordingly, your presentation should be tailored to your particular audience. This brings us to another pie chart strength: people are familiar with pie charts. Any audience member will feel comfortable interpreting what the pie chart is presenting. As a bonus, circles generate more positive emotions: our brains like to look at circles over sharp corners. In the end, a pie chart simplifies the data story and encourages the audience.
Data visualization guru Edward Tufte famously declared that “pie charts are bad, and the only thing worse than one pie chart is lots of them.” We already talked about the pros of pie charts and why we don’t adhere to this strict no-pie-chart philosophy. We should also state that there are plenty of instances where you should not use a pie chart. First off, pie charts portray a stagnate time frame, so trending data is off the table with this visualization method. Make sure your audience understands the timeframe portrayed and try to document or label this applied filter somewhere.
Pie charts are also not the best types of data charts to make precise comparisons. This is especially true when there are multiple small pieces to the pie. If you need to see that one slice is 1% larger than another, it’s better to go with a bar chart. Another thing about multiple pieces to your pie – you don’t want too many. Pie charts are most effective when just displaying two portions. They lose presentation value after six segments. After six, it is hard for the eyes to decipher the slice's proportion. It also becomes difficult to label the pie chart, and valuable online dashboard /reporting real estate is often wasted in the process.
This brings us to the last issue: circles take up space. If you are using multiple pie charts in a dashboard, it is probably best to combine the data in one chart. We recommend checking out the stacked bar chart for these cases. You can also have a look at the different pie charts that are commonly used and explore the disadvantages of pie charts .
8) Gauge Charts

Gauge charts , also known as dial charts or speedometer charts, use needles and colors to show data similar to reading on a dial/speedometer, and they provide an easily digested visual. They are great for displaying a single value/measure within a quantitative context, such as to the previous period or to a target value. The gauge chart is often used in executive dashboards and reports to display progress against key business indicators. All you need to do is assign minimum and maximum values and define a color range, and the gauge chart will display an immediate trend indication.
Gauge charts are great for KPIs and single data points. After that, they can get a bit messy. With only one data point, you can’t easily compare different variables. You also can’t trend data using gauge charts. All of this makes taking actionable insight from a gauge chart difficult. Furthermore, they take up a lot of space – if your live dashboard has precious real estate, it may not be most efficient to fill it with multiple gauge charts. Using one chart to summarize multiple KPIs, you will likely get more bang for your buck.
9) Scatter Plot

Scatter plot is not only fun to say – it’s what you need when looking for the correlation in a large data set. The data sets need to be in pairs with a dependent variable and an independent variable. The dependent (the one the other relies on) becomes the y-axis, and the independent – the x-axis. When the data is distributed on the plot, the results show the correlation to be positive, negative (each to varying degrees), or nonexistent. Adding a trend line will help show the correlation and how statistically significant it is.
Scatter plots only work when you have a lot of data points and a correlation. If you are only talking about a few pieces of information, a scatter plot will be empty and pointless. The value comes through only when there are enough data points to see clear results. If you only have a little data or if your scatter plot shows no correlation at all, this chart has no place on your business dashboard.
10) Spider Chart

Spider charts, or radar charts, are comparative charts used when multivariate data is displayed with three or more quantitative variables (aspects). This is useful when you want to evaluate two or more “things” using more than three aspects, all of which are similarly quantifiable. It’s certainly a mouthful, but it’s simple when you put it into use. Spider charts are great for rankings, appraisals, and reviews. For example, the three “things” we are comparing in our e-commerce example above are regions: Australia, Europe, and North America. The aspects we are comparing against are products sold are Cameras, TVs, Cell Phones, Games, and Computers. Each variable is being compared by how many units were sold – between 0 and 500. Europe is clearly outselling in all areas, and Australia is particularly weak in Cameras and Cell Phones. The concentration of strengths and weaknesses is evident at a glance.
This is not the easiest data analysis chart to pull off, but it really impresses when done correctly. Using this chart if you have more than five values in your dimension (five “things” to evaluate) makes it hard to read, which can make it pointless altogether. Whether you use solid lines or shaded areas, too many layers are difficult to interpret. Naturally, it is not a choice when you want to show time (the whole circular thing...).

We know – tables aren’t technically a graph. But sometimes, you really just need a table to portray your data in its raw format. With a table, you can display a large number of precise measures and dimensions. You can easily look up or compare individual values while also displaying grand totals. This is particularly beneficial when your audience needs to know the underlying data or get into the “weeds.” Tables are also effective if you have a diverse audience where each person wants to look at their own piece of the table. They are also great at portraying a lot of text or string values.
Remember – just because you are using a table doesn’t mean it can’t be visually pleasing. You can use various colors, border styles, font types, number formats, and icons to highlight and present your data effectively.
There are many reasons to use a table, but there are also many instances where different types of charts are a better choice. It all comes down to our eyes and brain. Tables interact primarily with the verbal system – we read tables. This reading includes processing the displayed information in a sequential fashion. Users read down columns or across rows of numbers, comparing one number to another. The keywords here are reading, processing, and time. Tables take longer to digest.
Graphs, on the other hand, are perceived by our visual system. They give numbers shape and form and tell a data story. They can present an immense amount of data quickly and in an easy-to-consume fashion. If data visualization is needed to identify patterns and relationships, a table is not the best choice. Also, while it is fun to get creative with colors, formatting, and icons, make sure your formatting and presentation choices are increasing your perception. The tables are hard enough to read as is!
12) Area Charts

The area chart is closely related to the line chart. Both chart types depict a time-series relationship, show continuity across a dataset, and are good for seeing trends rather than individual values. That said, there are some key differences between the two. Because of these differences, “when to use area charts” does not equal “when to use line charts.”
Line charts connect discrete but continuous data points through straight line segments. This makes them effective for facilitating trend analyses. Area charts technically do the same, except that the area below the plotted lines is filled with color. In this case, an un-stacked area chart is the same thing as a line chart – just with more coloring. The problem you run into here is occlusion: when you start comparing multiple variables/categories in an unstacked area chart, the upper layers obscure the lower layers. You can play around with transparency, but after three variables, un-stacked area charts are hard to read.
This brings us to the most commonly used area chart: the stacked area chart. Like stacked bar charts, stacked area charts portray a part-to-whole relationship. The total vertical of a stacked area chart shows the whole, while the height of each different dataset shows the parts. For example, a stacked area chart can show the sales trends for each region and the total sales trend. There are two different stacked area chart types you can use to portray the part-to-whole relationship.
Traditional Stacked Area Chart: The raw values are stacked, showing how the whole changes over time.
Stacked Percentage Area Chart: Percentages are stacked to show how the relationship between the different parts changes over time. This is best used to show the distribution of categories as parts of a whole where the cumulative total is less important.
As we hinted earlier, for the most part, you should stay away from un-stacked area charts. If you are just comparing 2-3 different variables that don’t obscure each other, then go ahead. But in general, they are often messy and don’t follow data visualization and dashboard design best practices . When it comes to stacked area charts, don’t use them when you don’t need to portray a part-to-whole relationship – use a line graph instead. Also, if you are trying to compare 7+ series, a stacked area graph becomes hard to read. In this case, you should once again turn to the line graph.
13) Bubble Plots

Bubble charts, or bubble graphs, are among the best types of data graphs for comparing several values or sets of data at a glance. If you’re looking to show the relationship between different product categories, revenue streams, investment risks, costs, or anything similar, bubble charts or plots are incredibly effective.
For instance, our example bubble plot showcases the relationship between a mix of retail product categories, primarily the number of orders and profit margin.
Here, you can tell that the TV & Home Theater product category has the highest number of orders (around 3,000 as you can see from the number scale on the left) as well as the highest profit margin, and therefore, it is the biggest bubble on the chart. Comparatively, the camera category shows the lowest number of orders in addition to the smallest profit margin and naturally is the smallest bubble on the chart.
The bubble plot is extremely powerful for visualizing two or more variables with multiple dimensions. And here, the bigger the bubble, the higher the profit margin. Not only are bubble plots visually stimulating, but they are also incredibly effective when building a comparative narrative for a specific audience.
It's difficult to go too far wrong with bubble charts, but the most common mistake with these types of business charts is focusing on varying the “radius” of the values rather than the “area” they take up on the chart. Doing so sometimes makes the bubbles on the plot disproportionate to the graph, making the information misleading at a glance. In short, your bubbles should be accurate in terms of size compared to the values. Get this right, and you’ll get the results you deserve.
14) Boxplot

Just like the histogram, the box plot is a graph that is used to represent the distribution of numeric data using boxes and lines. Each box is composed of five elements also known as the “Five-number summary” which are the minimum, first quartile, median (second quartile), third quartile, and maximum. Each of these elements represents a value and how it is distributed within the data set. Anything outside these values would be considered an outlier. An outlier is any value that is extremely high or extremely low compared to the nearest data point. Outliers (which are usually plotted as dots in the chart) need to be identified because they can affect the end result of the analysis and box plots are the best visuals to do so.
Just like other types of charts on this list, box plots are not the best choice when it comes to big data sets. Their visual simplicity makes it hard to see details about the distribution results which makes it more difficult to interpret, especially when dealing with complex data. Plus, this chart works at its best when comparing different groups (as seen in our example above). So, if you are trying to look at the distribution of one single group a histogram is a better choice.
15) Funnel chart

As its name suggests, a funnel chart is a visualization type used to show how data moves or flows through a specific process. They are commonly utilized to display sales, recruitment, or order fulfillment funnels where the values are often decreasing as the funnel becomes smaller. This can be seen in the example above in which the number of potential clients decreases at each stage of the sales funnel. This is a natural progression that happens because not every person that shows interest in the opportunities stage will end up buying the product or subscribing to the service.
In some cases, the sizes of the sections of the funnel chart are plotted proportionately with the value they are representing. This means the top section is 100% and the rest will represent their corresponding percentage with their size. This is not the case with our example in which the sections are sized to match the funnel shape, not the values contained in each section.
Funnel graphics are very specific visuals that can only be used in particular cases. You should only use it if your data goes through a sequence of stages and the values are decreasing with each stage. Plus, they are only useful to represent a single variable which means they cannot be used to visualize relationships between variables. A good alternative for a funnel graph is a bar or column chart.
16) Bullet chart

A bullet chart is a variation of a bar or column chart but it provides some extra visual elements to give more context to the data. It is usually used for performance tracking to make comparisons against a goal or other relevant values and it is composed of three key elements. A single measure is represented by a darker shade bar with a length that represents the performance of that value, qualitative ranges are represented by lighter shades in the background, and a target or comparative measure which is represented with a small line that is perpendicular to the orientation of the graph. Bullet charts are great alternatives to gauge charts, especially when you are working with a KPI dashboard and don’t want to take up too much space from it.
It is important to note that bullet charts are complex visuals that might be challenging to understand for non-technical audiences. In some cases, some people might choose to remove the shaded background to focus only on the actual value against the target or remove the target and focus on the qualitative ranges to make the chart friendlier to analyze. This variation is also known as an overlapping bullet chart and it can be done using columns and bars, as we will see in our two examples below.
1. Overlapping bars bullet chart

As we saw with different graph types previously, the bullet chart can be vertical (using columns) or horizontal (using bars). It is recommended to use bars when you want to display more categories or longer category names to avoid making the visual cluttered. In the example above, we can see the number of orders by product of the current year compared to a target. In this case, due to the number of products, a bar bullet graph is the best choice as it contains a lot of information without affecting the readability of the data.
2. Overlapping columns bullet chart

On the other side, a bullet column chart is a better choice when you want to organize categories from left to right or when you have fewer categories to show. In this case, we can see the number of orders by product category. Given that product categories are fewer than the actual number of products, it is a good choice to pick columns to represent this data. In a traditional bullet chart, the number of orders by a quarter could be added for additional context as qualitative measures.
17) Treemap chart

A treemap is a chart type used to display hierarchical data through rectangles that decrease their size as the value decreases, this process is also referred to as nesting. It is used to display large amounts of raw data in a visually appealing way that allows users to easily extract valuable conclusions at a glance. Its name comes from the shape of a tree, as the chart can be divided into multiple categories with different “branches” and “sub-branches”. Each of these categories should have a different color and the dimensions of the rectangles are based on the size of the data being displayed.
Given that a treemap is used to visualize massive amounts of raw data, they can display an infinite amount of subcategories (or sub-branches) which can make them harder to understand. However, in most cases, users can drill down into the different categories to dig deeper into the data and answer different questions that might arise.
If you are not trying to show hierarchical data then you should stay away from treemaps. Just like it happens with pie charts, this visualization is simply showing parts-to-whole relationships, therefore, it becomes useless for other purposes. You should also avoid treemaps if the data being displayed is too close in size. This defeats the purpose of the graph which is to easily identify the largest item from a specific category. A few alternatives for treemaps include column charts and scatter plots.
18) Stream charts

A stream graph is considered a variation of the area chart with the difference that, while the area chart is plotted with a fixed x-axis, the stream graph has values displayed around a central axis. Hence, the flowing river-like shape. They are frequently used to identify trends and patterns in big datasets with multiple categories and evaluate how they change over time. Just like with other kinds of charts on this list, the width and length of the streams are proportional to the values being displayed. The colors can represent different categories or other specific criteria. In our example above, we can see the number of orders by product categories each month. The width of each stream can provide valuable insights into the performance of each category. For instance, from June to August orders for TVs and Home Theaters decreased a lot compared to other months so some conclusions need to be drawn.
In general, if your aim is to use the chart to deeply analyze the data and extract conclusions from it, then the stream is not your best option. They are often cluttered with a lot of information which can lead to legibility issues. This can happen especially when you have smaller categories that end up looking way too small compared to bigger ones. For that reason, it is best to use stream charts as interactive visuals instead of static or printed ones.
19) Word Cloud

A word cloud is a straightforward type of graph that displays a set of words concerning a specific topic. The words are arranged in different directions and the sizes of the words will vary depending on specific criteria. For example, if a word cloud is generated based on a text from product reviews, the size of the words can be influenced by the number of times each word is mentioned within the text. On the other hand, if you are generating a word cloud of all the countries in the world, the names of the countries can be bigger or smaller depending on their population. From an analytical perspective, word clouds don’t provide a lot of value apart from being an engaging and visually appealing way of presenting a topic or supporting discussions.
There is no general rule when it comes to colors on a word cloud. Some might use different colors to provide meaning to certain words while others might use standard colors to match their branding. Whichever case you are using, the rule of not adding too many colors to avoid overcrowding the visual still applies when it comes to word clouds.
20) Progress chart
As its name suggests, this chart is used to track the progress of a specific activity or scenario usually in a percentage form. It can be represented using bars or columns and is often tracked against a set target, as seen in the graph examples below, in which you can see a colored area representing the completed percentage and a lighter shade representing the remaining percentage to complete 100%. Progress graphs are wildly popular when tracking the development of a project as they provide a clear overview of the status of different tasks. They are also valuable visuals when you are trying to show any kind of percentage value or progress against a target.
Progress charts are very straightforward and don’t provide a lot more information than the development of a metric. If you want to gain more insights you can explore using a bullet chart as they provide more context to the data.
- Progress bar graph

The progress bar chart is used to track the progress of a specific activity or metric using horizontal bars. The example above is tracking the percentage of purchases in time and budget from a procurement department. Ideally, the end goal for each category would be 100% as this means all purchases are made on the expected time and budget. However, this is not always the case and the progress bar is a great way to see how far from the expected target the values actually are. In this case, the average is represented by a darker color of green, and the remaining percentage to reach 100% is represented by a lighter shade.
- Progress column graph

The progress column chart is a type of progress chart that uses columns to represent different data values. In this case, our example is showing the average time to fill a position by the department where each department has a predefined target they are expected to reach. In this case, the target value is represented by a dark purple dot, in other cases, it could be represented with a lighter shade of the same purple from the column. Using a progress chart to represent this metric is a great way to compare the different departments and see if any of the processes need to be optimized to better reach the expected target.
How To Choose The Right Chart Type: 9 Essential Questions To Ask
To go further into detail, we have selected the top 9 questions you need to consider to ensure success from the very start of your journey.
1. What story do you want to tell?
At its core, data charts are about taking data and transforming it into actionable insight by using visuals to tell a story. Data-driven storytelling is a powerful force as it takes stats and metrics and puts them into context through a narrative that everyone inside or outside of the organization can understand.
By asking yourself what kind of story you want to tell with your data and what message you want to convey to your audience, you’ll be able to choose the right data visualization types for your project or initiative. And ultimately, you’re likely to enjoy the results you're aiming for.
For more on data storytelling, check out our full guide for dashboard presentation and storytelling.
2. Who do you want to tell it to?
Another key element of choosing the right data visualization types is gaining a clear understanding of who you want to tell your story to – or in other words, asking yourself the question, “ Who is my audience ?”
You may be aiming your data visualization efforts at a particular team within your organization, or you may be trying to communicate a set of trends or predictive insights to a selection of corporate investors. Take the time to research your audience, and you’ll be able to make a more informed decision on which data visualization chart types will make the most tangible connection with the people you’ll be presenting your findings to.
3. How big is your data?
As you probably learned from our list of the essential types of charts and when to use them, the size of your data will significantly affect the type of visualization you decide to use. Some charts are not meant to be used with massive amounts of data due to design aspects while others are perfect for displaying larger information.
For example, pie charts are not good if you are trying to show multiple categories. For that purpose, a scatter plot works best. Another example is with column and bar charts. Bar charts use horizontal bars that make it easier to represent larger data sets. On the other side, column charts are limited by size due to their vertical orientation, making them better for smaller data.
4. What is the type of data you are using?
Another important question to ask yourself is what type of data you are using. As we saw at the beginning of the post, there are 4 key categories when it comes to data visualization: composition, distribution, relationship, and comparison. There are also qualitative and quantitative data that can be better represented using a particular graphic. For this reason, it is important to carefully define the type of data you are using before thinking about visualizing it. In the following questions, we will see what you need to ask yourself based on the mentioned categories.
5. Are you looking to analyze particular trends?
Every data visualization project or initiative is slightly different, which means that different data visualization chart types will suit varying goals, aims, or topics.
After gaining a greater level of insight into your audience as well as the type of story you want to tell, you should decide whether you're looking to communicate a particular trend relating to a particular data set, over a predetermined time period. What will work best?
- Line charts
- Column charts
- Area charts
6. Do you want to demonstrate the composition of your data?
If your primary aim is to showcase the composition of your data – in other words, show how individual segments of data make up the whole of something – choosing the right types of data visualizations is crucial in preventing your message from becoming lost or diluted.
In these cases, the most effective types of visual charts include:
- Waterfall charts
- Stacked charts
- Map-based graphs (if your information is geographical)
7. Do you want to compare two or more sets of values?
While most types of data visualizations will allow you to compare two or more trends or data sets, there are certain graphs or charts that will make your message all the more powerful.
If your main goal is to show a direct comparison between two or more sets of information, the best choice would be:
- Bubble charts
- Spider charts
- Columned visualizations
- Scatter plots
Data visualization is based on painting a picture with your data rather than leaving it sitting static in a spreadsheet or table. Technically, any way you choose to do this count, but as outlined here, there are some charts that are way better at telling a specific story.
8. Is timeline a factor?
By understanding whether the data you’re looking to extract value from is time-based or time-sensitive, you’ll be able to select a graph or chart that will provide you with an instant overview of figures or comparative trends over a specific period.
In these instances, incredibly effective due to their logical, data-centric designs, functionality and features are:
- Dynamic line charts
9. How do you want to show your KPIs?
It’s important to ask yourself how you want to showcase your key performance indicators as not only will this dictate the success of your analytical activities but it will also determine how clearly your visualizations or data-driven stories resonate with your audience.
Consider what information you’re looking to gain from specific KPIs within your campaigns or activities and how they will resonate with those that you’ll be sharing the information with - if necessary, experiment with different formats until you find the graphs or charts that fit your goals exactly.
Here are two simple bonus questions to help make your data visualization types even more successful:
- Are you comparing data or demonstrating a relationship?
- Would you like to demonstrate a trend?
At datapine, data visualization is our forte. We know what it takes to make a good dashboard – and this means crafting a visually compelling and coherent story.
"Visualization gives you answers to questions you didn’t know you had." – Ben Shneiderman
Design-thinking In Data Visualization
When it comes to different data visualization types, there is no substitute for a solid design. If you take the time to understand the reason for your data visualization efforts, the people you’re aiming them at, and the approaches you want to take to tell your story, you will yield great results.
Here at datapine, we’ve developed the very best design options for our dashboard reporting software , making them easy to navigate yet sophisticated enough to handle all your data in a way that matters.
With our advanced dashboard features , including a host of global styling options, we enable you to make your dashboard as appealing as possible to the people being presented with your data.
Your part in creating an effective design for the different types of data charts boils down to choosing the right visualization to tell a coherent, inspiring, and widely accessible story. Rarely will your audience understand how much strategic thought you have put into your selection of dashboards – as with many presentational elements, the design is often undervalued. However, we understand how important this is, and we’re here to lend a helping hand.
In this guide, we covered different types of charts to represent data, explored key questions you need to ask yourself to choose the right ones, and saw examples of graphs to put their value into perspective. By now, you should have a better understanding of how each type of visual works and how you can use them to convey your message correctly.
To summarize, here are the top types of charts and their uses:
- Number Chart - gives an immediate overview of a specific value .
- Line Chart - shows trends and changes in data over a period of time .
- Maps - visualizes data by geographical location.
- Waterfall Chart - demonstrates the static composition of data.
- Bar Graphs - used to compare data of large or more complex items .
- Column Chart - used to compare data of smaller items.
- Gauge Chart - used to display a single value within a quantitative context.
- Pie Chart - indicates the proportional composition of a variable.
- Scatter Plot - applied to express relations and distribution of large sets of data.
- Spider Chart - comparative charts great for rankings, reviews, and appraisals.
- Tables - show a large number of precise dimensions and measures .
- Area Chart - portrays a part-to-whole relationship over time .
- Bubble Plots - visualizes 2 or more variables with multiple dimensions.
- Boxplot - shows data distribution within multiple groups.
- Funnel Chart - to display how data moves through a process.
- Bullet Chart - comparing the performance of one or more primary measures .
- Treemap - to plot large volumes of hierarchical data across various categories.
- Stream Graph - shows trends and patterns over time in large volumes of data.
- Word Cloud - to observe the frequency of words within a text.
- Progress Chart - displays progress against a set target or goal.
But in our hyper-connected digital age, there are many more different kinds of graphs you can use to your advantage. Putting everything together in a professional business dashboard is even better. These visual tools provide centralized access to your most important data to get a 360-view of your performance so you can optimize it and ensure continuous growth.
Complete with stunning visuals, our advanced online data visualization software can make it easy for you to manipulate your data and visualize it using professional dashboards. The best part is, you can try it for a 14-day trial , completely free!
How to Make a Comparison Chart in Excel (4 Effective Ways)
If you are looking for ways to make a Comparison Chart in Excel, then this article will serve this purpose. Comparison Charts are widely used in data visualization. In Excel, we can easily make a Comparison Chart by following some simple steps. So let’s start with the article and learn all these steps to make a Comparison Chart in Excel.

Significance of a Comparison Chart
As the name refers, a Comparison Chart is a kind of chart where we can compare two or more different kinds of data and understand various correlations among them. With the help of a Comparison Chart , we can easily visualize our data along with their trends, correlations among different parameters, etc. And all of this can be done without going through the long, tedious datasets. For this reason, a Comparison Chart is a highly efficient way of visualizing datasets.
Read More: How to Compare Two Sets of Data in Excel Chart
In this article, we are going to learn 4 simple methods to make a Comparison Chart in Excel. After learning these methods, you will be able to create both simple and advanced Comparison Charts in Microsoft Excel. We have used Microsoft Excel 365 version for this article, you can use any other version according to your convenience.
1. Applying a Clustered Column Chart to Make a Comparison Chart in Excel
Clustered Column Chart is one of the most popular methods of creating a Comparison Chart. In the following dataset, we have sales data of ABC company for different states and cities. We will make a Comparison Chart of Sales among different States.
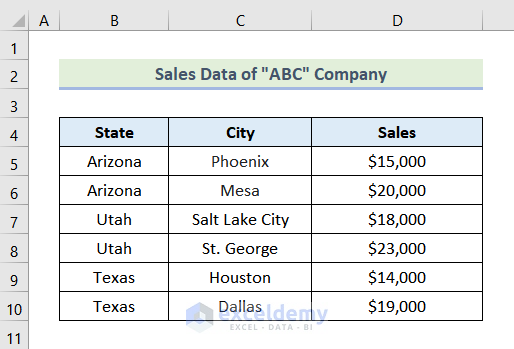
- If we look carefully, we can see that there are a total of 3 states in the 6 columns. So, firstly, select two cells of Arizona .
- After that, go to the Home tab.
- Then, from the Alignment group choose Merge & Center .

After selecting Merge & Center , you will be able to see the following image on the screen.
- After that, press OK .

Afterward, you will be able to see that the two cells are merged together.
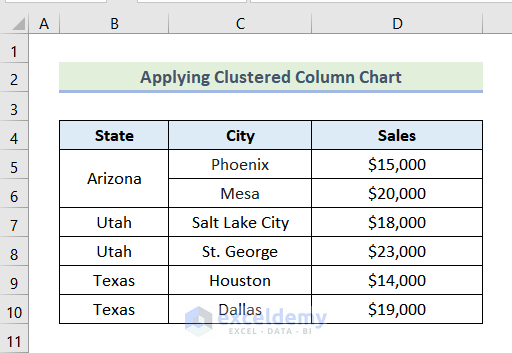
Similarly, for the other two states, we can follow the same procedure and merge them. Then, your dataset should be looking like this.

- Now, click on cell C7 . Here cell C7 represents Salt Lake City in the state of Utah .
- After that, go to the Home tab >> Insert dropdown >> Insert Sheet Rows option.

After that, you will be able to see the following picture on your screen.

Similarly, add another blank row over the city of Houston. After that, your dataset should be looking like the following image.
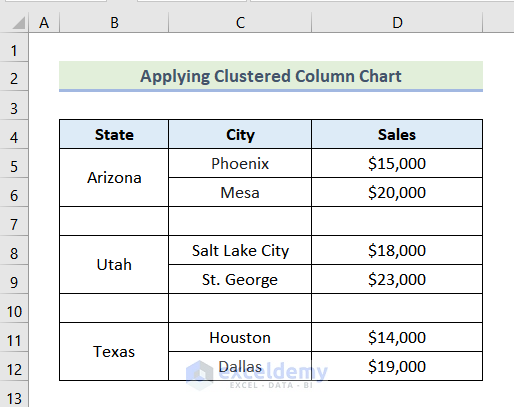
- Now, select the whole dataset.
- Go to the Insert tab >> Insert Column or Bar Chart dropdown >> Clustered 2-D Column option.

After that, a Clustered Column Chart should be visible on your screen like the below-given image.

At this stage, we are going to format our chart to give it a better look and visibility.
- First, click on the paintbrush icon as marked in the following image.
- After that, choose your preferred style.
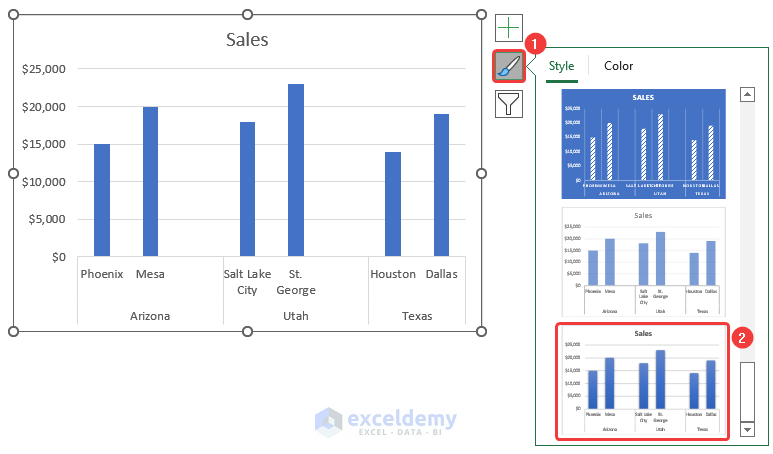
After selecting the style, you will be able to see that the chart has been formatted with your preferred style.
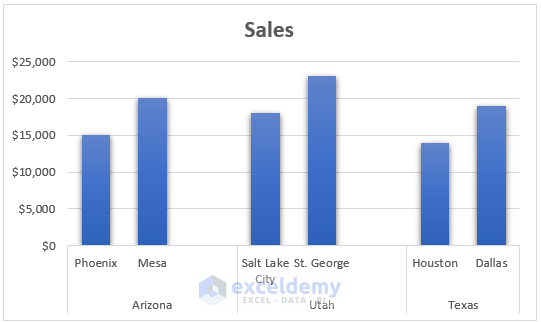
- Now, click on the Chart Elements .
- Then check the box of Data Labels.
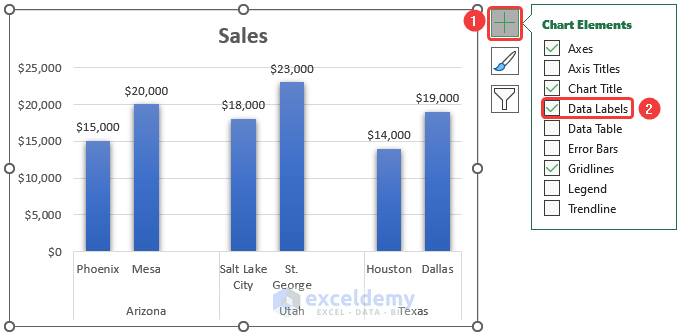
At this point, Data Labels will be added to the chart like the following picture.

- After that, click on the Chart Title as marked in the following image.

- Afterward, type your preferred chart title. In this case, we are typing Sales Data .
After typing your chart title, your Comparison Chart is created and it should be looking like the below-given image.
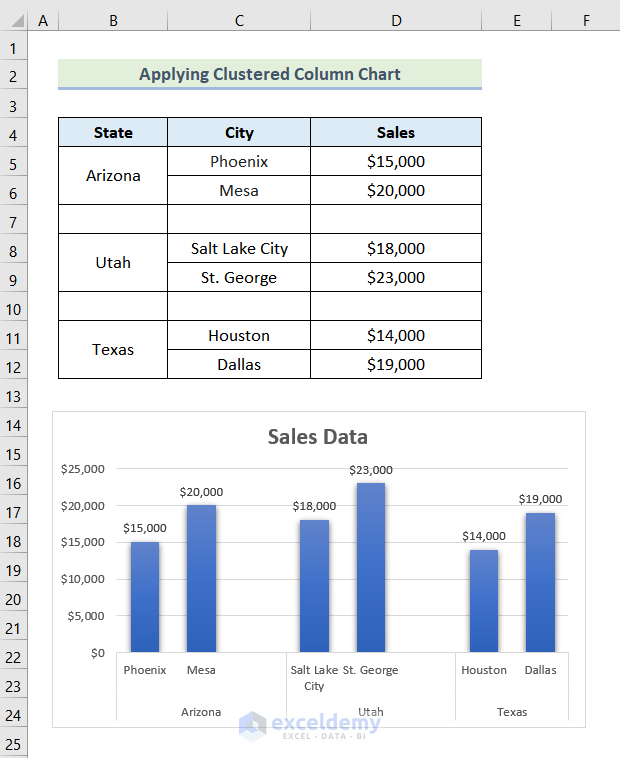
Read More: How to Use Comparison Bar Chart in Excel
2. Using a Scatter Chart to Create a Comparison Chart
In this portion of the article, we are going to use the Scatter Chart to create our Comparison Chart . In the following dataset, we have sales data of XYZ company for various States . Let’s learn the detailed steps to create a Comparison Chart using Scatter Chart .
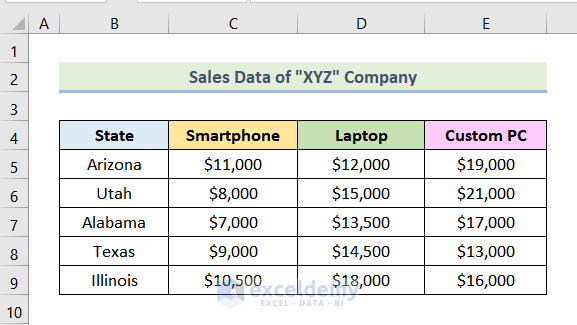
- First, select the entire dataset.
- After that, go to the Insert tab.
- Then select Insert Scatter (X, Y) or Bubble Chart .
- Afterward, choose Scatter from the drop-down.

After that, a Scatter Chart for the selected dataset will be visible on the screen like the following image.

Now select your preferred style of the chart by following the same steps mentioned before . After that, you will be able to see that your chart has been formatted with your preferred style.
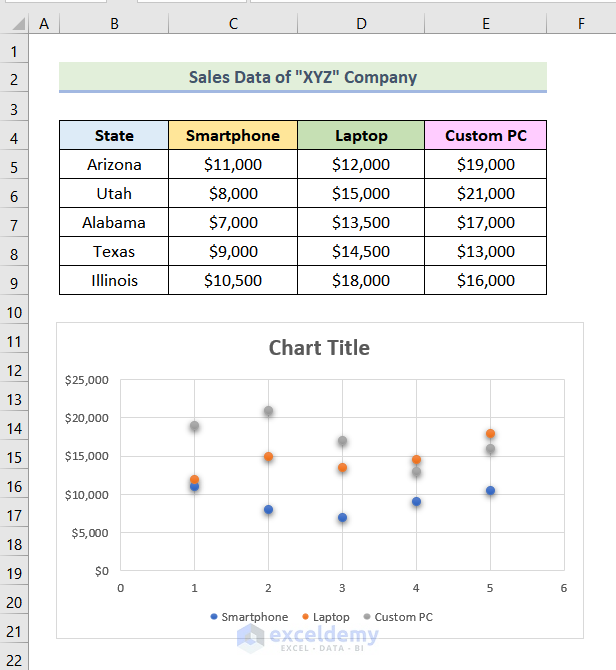
After that, edit the chart title by following the previously mentioned steps . In this case, we are using Sales Review as our chart title. Afterward, the following image will be visible on your screen and your Comparison Chart is created.

3. Using Combo Chart as Comparison Chart in Excel
Now, we are going to create a Comparison Chart using the Combo Chart feature of Excel. In the following dataset, we have half-yearly sales data of a company. We will create a Comparison Chart for the dataset for different Month .
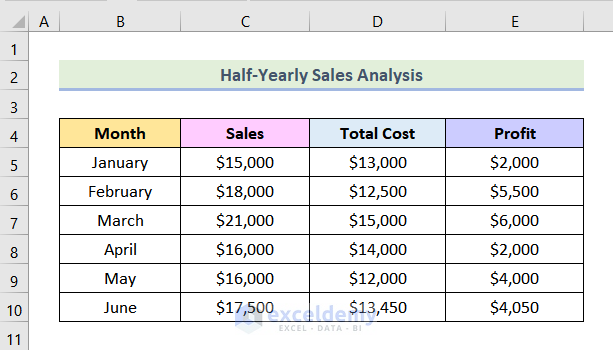
- Firstly, select the entire dataset.
- Then, click on Insert Combo Chart .
- Afterward, select Create Custom Combo Chart from the drop-down.

- Now, a dialogue box will pop up. Then, select Clustered Column for Sales and Total Cost .
- After that, select Line for Profit .
- Next, check the box of Secondary Axis beside Line .
- Afterward, press OK .

After that, your chart should be looking like the following image.
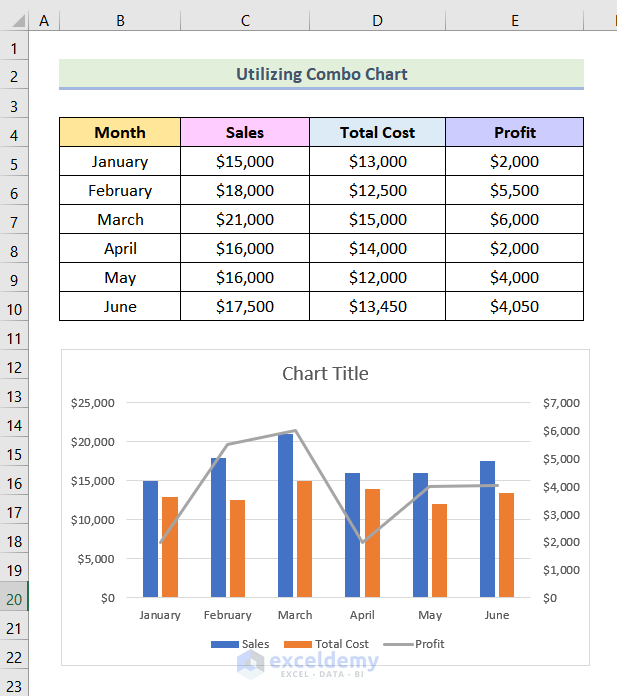
Now, choose your preferred style and edit the chart title by following the previously mentioned steps. At this stage, your Comparison Chart is ready and you will be able to see the below-given image on your screen

4. Applying Pivot Table and Line Chart to Create a Comparison Chart
This method is a somewhat advanced way of creating a Comparison Chart. By using Pivot Table and Line Chart we are going to create a dynamic Comparison Chart . In the following dataset, we have yearly sales data of a company for various states . Lets’s start learning the method in detailed steps.
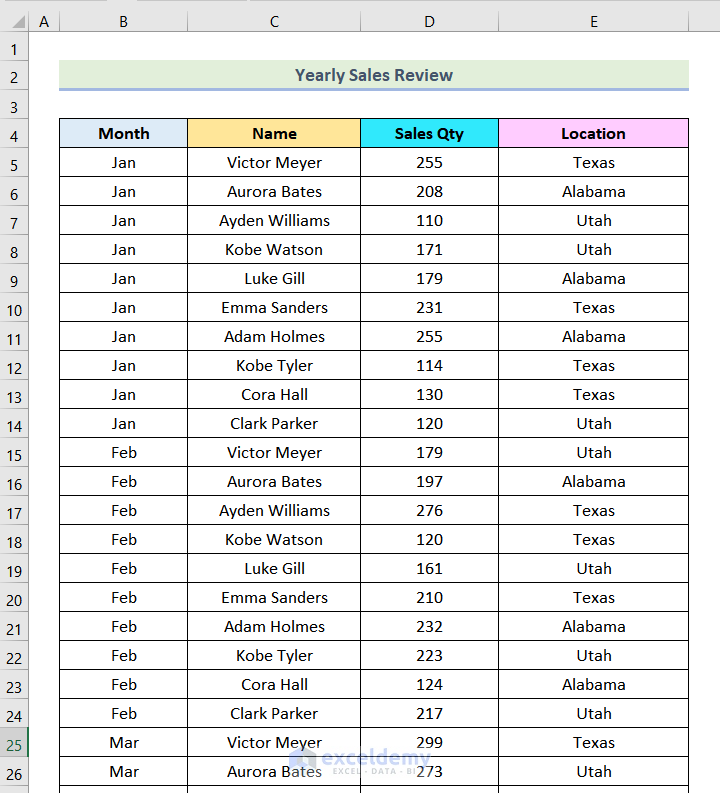
Step-01 : Inserting Pivot Table
Note: The dataset is quite large (it contains 124 rows). That is why it is shown in the following 5 images.

- After selecting the dataset, go to the Insert tab.
- Then click on Pivot Table from the Tables group.
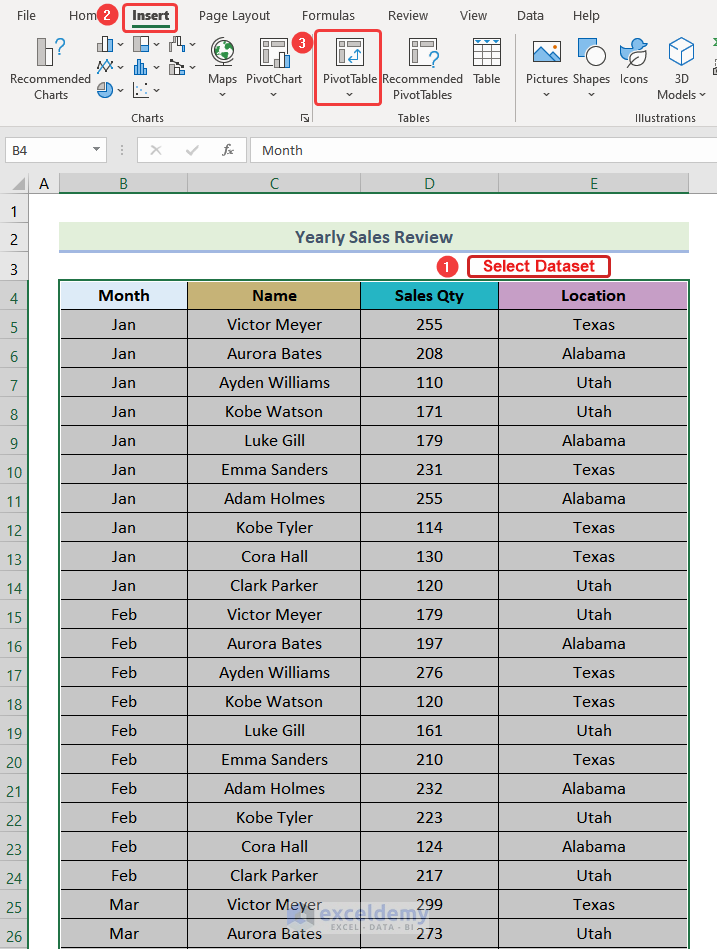
- After that, a dialogue box will pop up, and select Ok from the dialogue box as marked in the following picture.
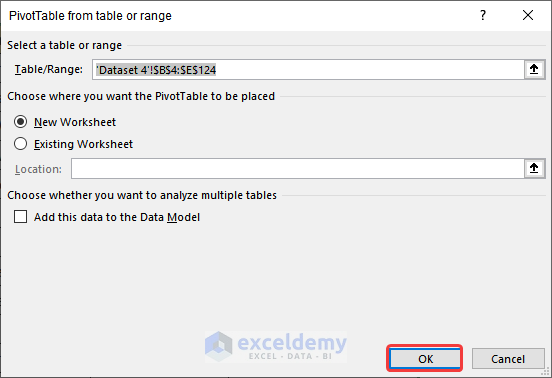
Afterward, another dialogue box will be visible on your screen named Pivot Table Fields .

- Next, drag Month in the Rows section, Sales Qty in the Values section, and the Name in the Filter section.

Afterward, you will be able to see the following Pivot Table on your screen.
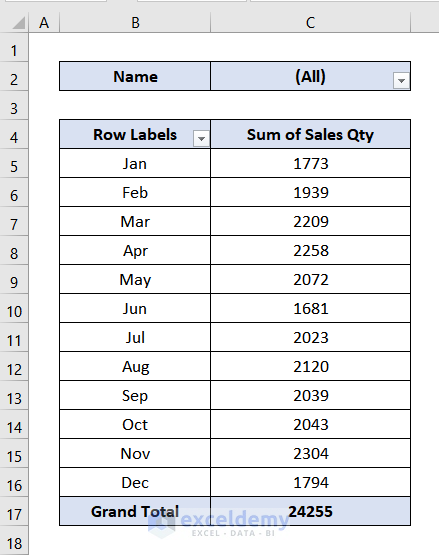
Step-02 : Editing Pivot Table
- Now, give a heading of the table like the following image. Here we are naming the table as Individual Sales Qty .

- After that, double-click on the Sum of Sales Qty as marked in the following image.
- Then, a dialogue box will open, and select Average from the dialogue box.
- Finally, press OK .

At this point, the following image will be available on your screen.
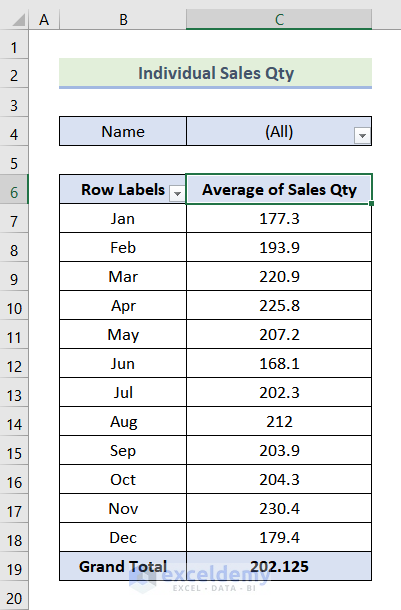
- Next, select the data of the Average of Sales Qty column as highlighted in the following picture.
- Then, go to the Home tab and click on the Decrease Decimal option once.

Afterward, the decimal points on the pivot table should be gone like the following image.
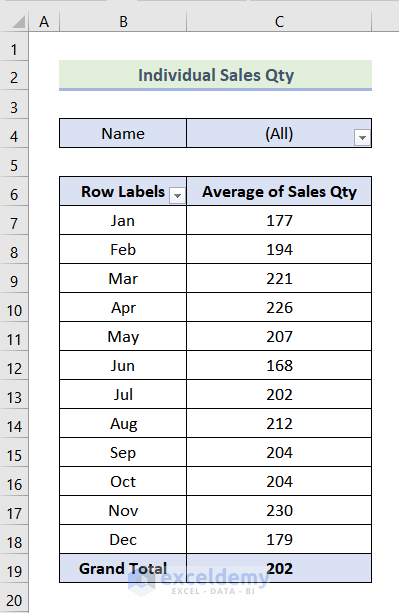
Step-03 : Creating Pivot Table Without Name Filter
- First, select the entire table.
- After that press CTRL+C to copy the table.

- Now press CTRL+V to paste the copied table in cell G4 and you will be able to see the following image on your screen.

- After that, click on any cell of the new Pivot Table .
- Afterward, from the Pivot Table Fields dialogue box, uncheck the Name box .
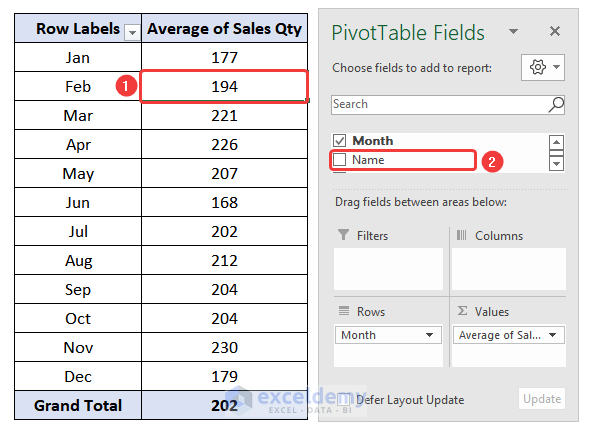
After doing this, the Name filter from your new Pivot Table should be removed.

- Now, give a heading to the table. In this case, we have used Average Sales of All Employee as the heading.

Step-04 : Constructing Table for Comparison Chart
- First, create a table consisting of 3 columns named Month , Individual , and Average and give a heading like a picture below.
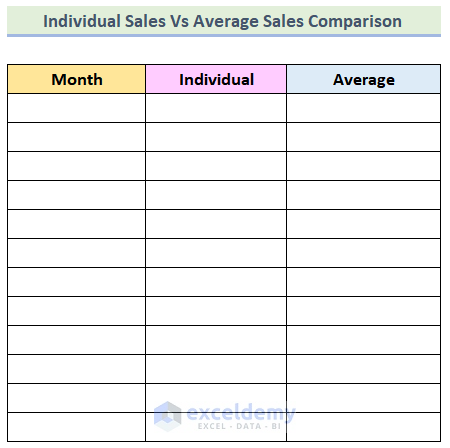
- After that, type Jan (abbreviation of January ) in the first cell under the Month column.

- Afterward, drag the Fill Handle up to the end of the table.

Then, you will be able to see the following image on your screen.
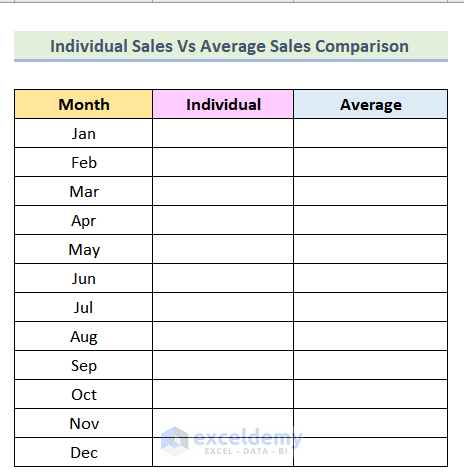
Step-05 : Using VLOOKUP Function
- First, use the following formula in cell M5 to extract values from the Average of Sales Qty column of the Individual Sales Qty Pivot Table .
Here L5 is the Month of Jan that is our lookup_value for the VLOOKUP function , and B: C is the table_array where will search for the lookup value, 2 is the column_index_number , and 0 means we are looking for an exact match .
- After that, hit ENTER .

Now, the VLOOKUP function should return 255 like the following image.

- Afterward, use Excel’s AutoFill Feature to complete the rest of the cell of the column and you will get the following output.
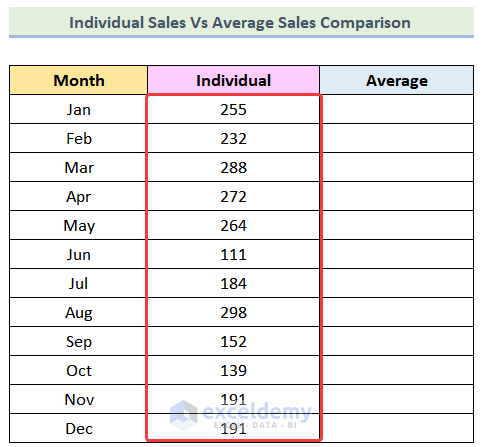
In the Average column, we are again going to use another VLOOKUP function. But in this case, our table_array will change.
- Now, we can use the following formula in cell N5 .
Here, G:H is the changed table_array .

- Afterward, use the AutoFill option to get the rest of the data.
- Consequently, your table should look like the image given below.

Step-06 : Inserting Name Slicer
In this step, we are going to introduce a Slicer for the names of our dataset. To do this, we need to follow these steps.
- First, click on any cell of the Individual Sales Qty Pivot Table like the following image.
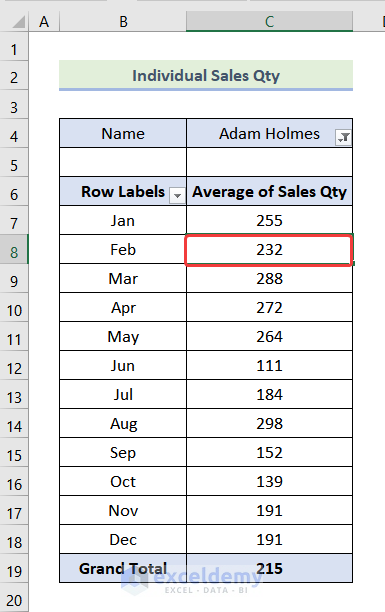
- When you select on the Pivot Table a new tab will be visible in the ribbon named PivotTable Analyze . Click on that.
- Afterward, select Insert Slicer from the Filter group.

- After that, an Insert Slicer dialogue box will open and check the box of Name from that dialogue box.
- Then, press Ok .
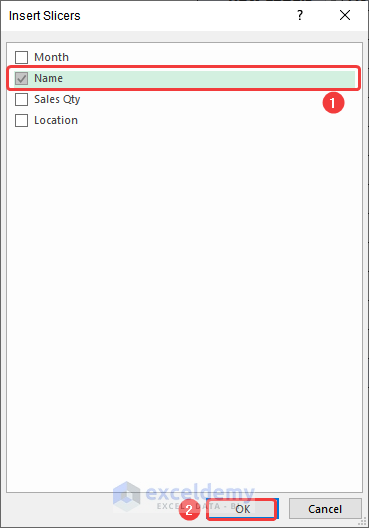
After doing this, a slicer should be added to your worksheet like the following image.

Step-07 : Adding Line Chart
- Then, go to the Insert tab >> Insert Line or Area Chart drop-down >> choose Line with Markers .

At this point, the line chart will be added to your worksheet.
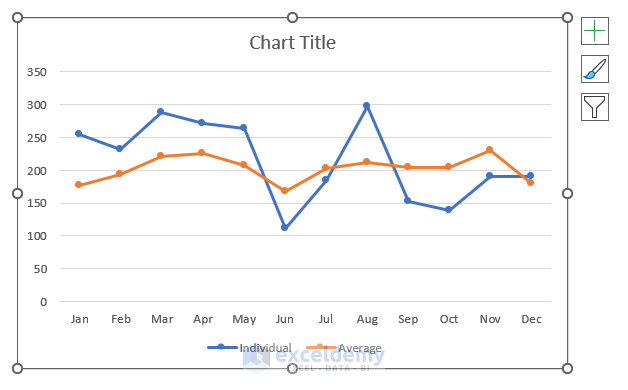
Step-08 : Creating a New Worksheet
- Now, create a new worksheet by pressing the Plus sign in the marked portion of the following image.

Step-09 : Adding Slicer and Line Chart to New Worksheet
- First, select the Slicer from the Support Sheet worksheet.
- After that, press CTRL+X .

- Next, go to the newly created worksheet and paste it here on cell B2 by pressing CTRL+V .
Consequently, you will be able to see that the Name slicer has been added to the new worksheet.
- Now, select the line chart from the Support Sheet worksheet and then press CTRL+X .

- After that, paste it into cell E2 of the new worksheet and your chart will be added like the following image.
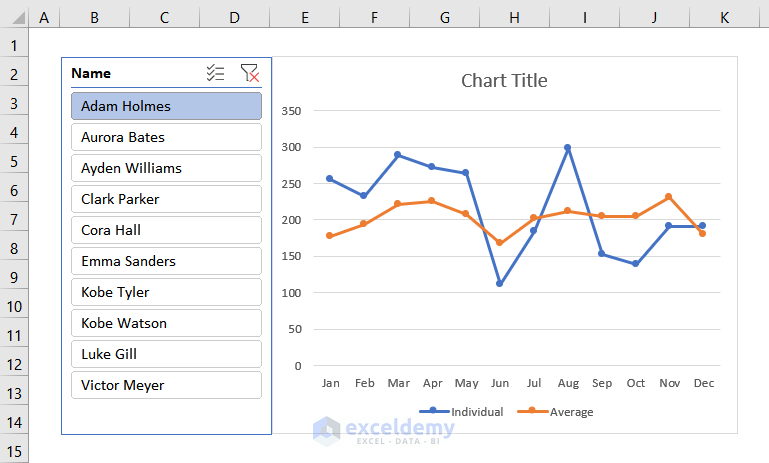
Step-10 : Formatting Chart
- First, edit the chart title by following the steps mentioned before. Here we are going to use Yearly Sales Review as our chart title.
After adding the chart title, you will see the picture given below, on your screen.

- Now, right-click on the Legend of the chart and then select the Format Legend option.

- Afterward, the Format Legend dialogue box will open and select Legend Options .
- Then choose Top as the Legend Position .
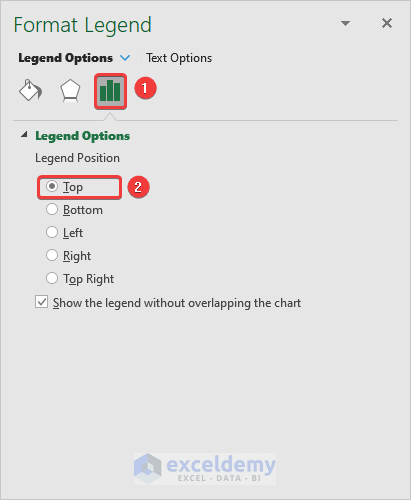
Now, the Legends should be moved to the top of the chart like the following image.

- Now, right-click on any point on the orange line and then click on the Format Data Series option.

- Next, the Format Data Series dialogue box will open, and select Fill & Line .
- After that, click on Line and select the following options.
Line → Solid Line Color → Pink (or whatever you want) Width → 1.5 pt Dash Type → Second option
- Finally, check the box of the Smoothed line .
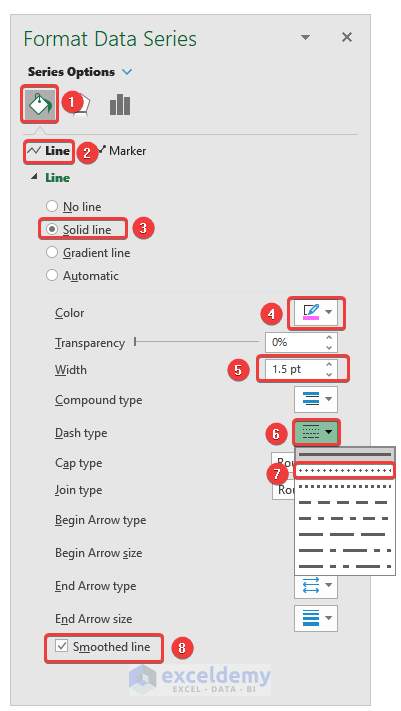
After selecting these options your chart should look like the following image.

- Now, click on Markers in the Format Data Series dialogue box.
- Select Solid Fill from the Fill option and add the same color that you choose in the previous step.
- After that, click on Border and select No line .
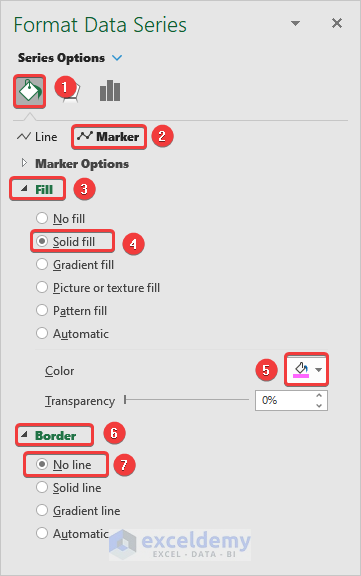
Afterward, your chart should look like the following image.

- After that, again go to the Format Data Series dialogue box for the other line by following the steps mentioned before.
- Then, click on the Fill & Line tab and select Line to choose the followings.
Line → Solid Line Color → Green (or any other color different from the previous one) Width → 1.5 pt

Eventually, you will be able to see the image given below on your screen.
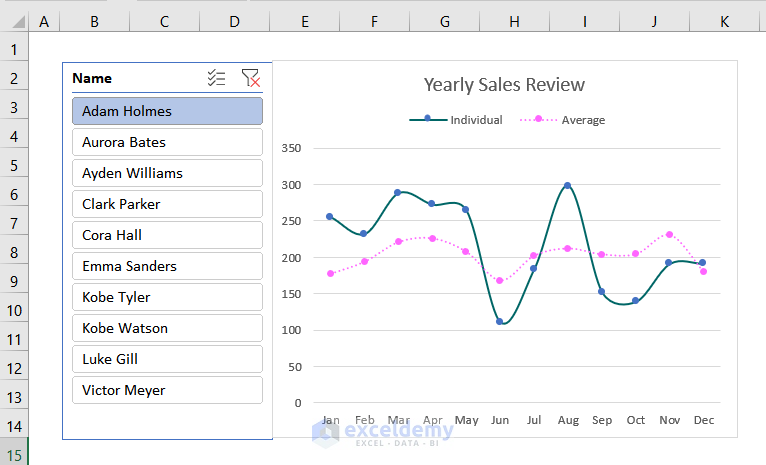
Now, by following the same steps mentioned before , edit the markers. Make sure that the color of the marker and the line are the same. After editing the markers, your chart should look like the following image. Here, the dashed line is the average sales of all employees and the solid line is the line for sales of the individual employee.

Step-11 : Inserting Location Slicer
- By following the steps mentioned before, open the Insert Slicers dialogue box.
- After that, check the box of Location and then hit Ok .

Afterward, Location Slicers will be added to the worksheet.
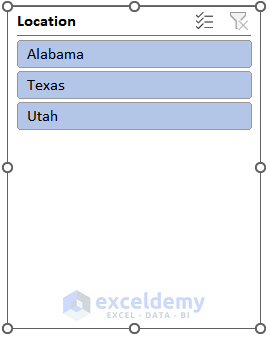
- Now, select the Slicer tab.
- After that, click on Buttons .
- Then select Columns and increase it to 2 from the drop-down.

- After that, the slicer will be in 2 columns like in the following picture.

- Now, resize the size of the slicer by dragging the marked point in the following image.
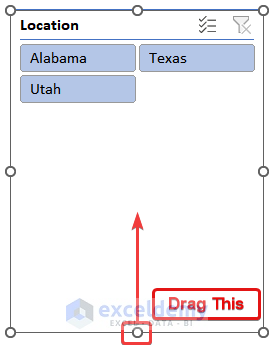
Afterward, you can see the following image on your screen.

Step-12 : Adding Location Slicer
- Firstly, select the slicer from the Support Sheet worksheet.

- Afterward, paste the slicer into the new worksheet that is created in Step-08 .
At this stage, your chart should be looking like the image given below.

Step-13 : Editing Location Slicer
- First, right-click on the location slicer .
- Then select Report Connections .
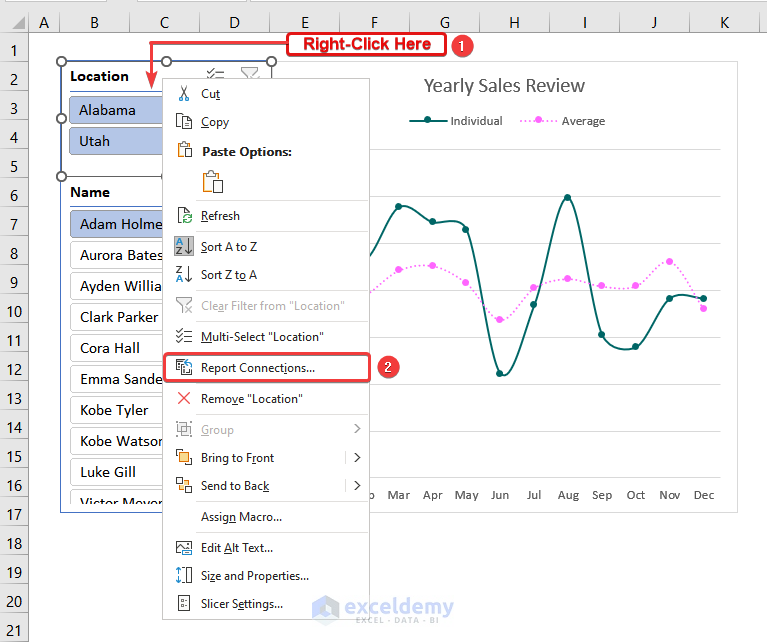
Afterward, Report Connections (Location) dialogue box will open like the following picture.

- Now, check the box of the Pivot Table 7 .
- After that, hit Ok .

- Then click on any location and name like the following image. Here we have selected Alabama and Adam Holmes .
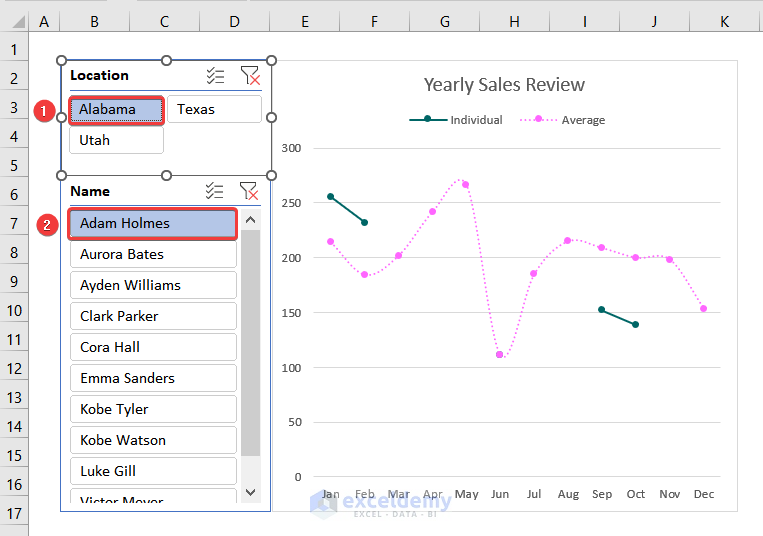
You can see that the line of individual sales is not continuous. It has happened because some employees didn’t have any sales in that particular location at a particular time of the year. Now, we will try to represent it in a better way.

- First, right-click on the data series that has broken lines.
- After that, click on Select Data .

- Now, the Select Data Source dialogue box will open, and click on Hidden and Empty Cells from the dialogue box.
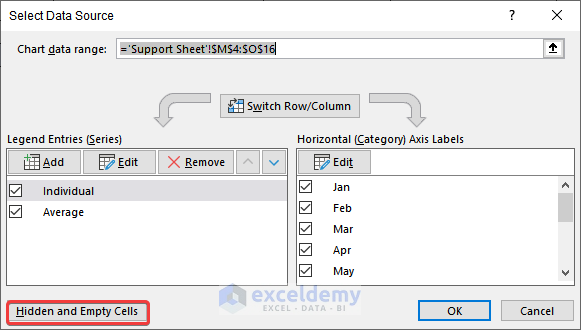
Afterward, the following image will be visible on your screen.

- Now, select Zero from the dialogue box.
- After that, press Ok .

After pressing OK you will be redirected to the Select Data Source dialogue box like the image given below.
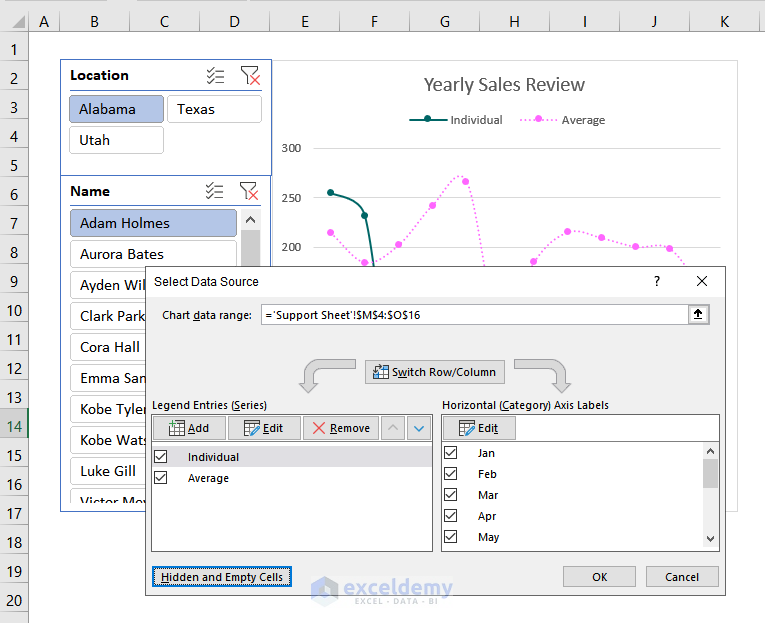
- Then hit OK again.

All of the broken lines are no longer visible. At this stage, you will see a continuous solid line in your chart.
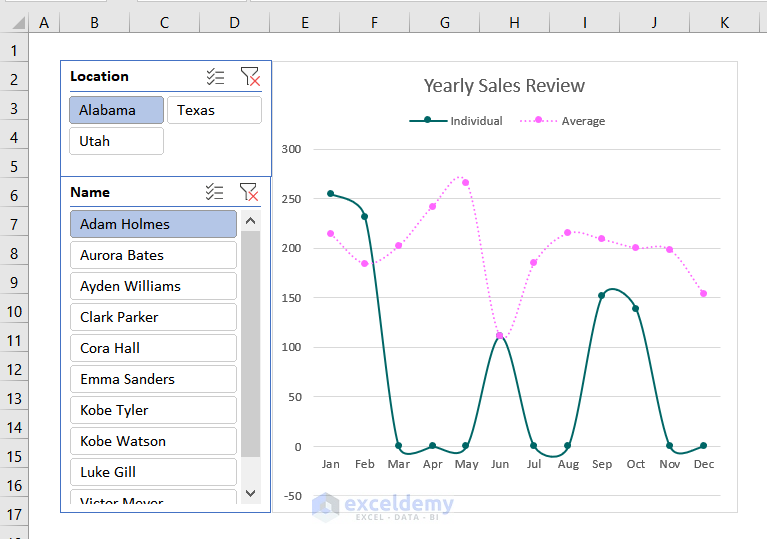
Step-14 : Checking If Comparison Chart Is Working or Not
- Now, you can click on any of the locations or names . The chart will automatically change. Here we have selected the location Texas and the name Kobe Tyler .

After selecting the location and name, your Comparison Chart should be changed like the following image.

Congratulations! You have successfully created the dynamic Comparison Chart with the help of the Pivot Table and Line Chart in Excel and you can change your chart quickly with some clicks.
Practice Section
For doing practice by yourself we have provided the practice sections in each worksheet on the right side. Please do it by yourself.
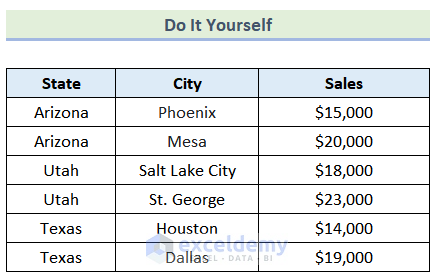
Things to Remember
- Do not forget to label the horizontal and vertical axes of the chart.
- Use appropriate scales to understand the chart clearly.
Download Practice Workbook
Finally, we have come to the very end of our article. I truly hope that this article was able to guide you to make a comparison chart in Excel. Please feel free to leave a comment if you have any queries or recommendations for improving the article’s quality. To learn more about Excel, you can visit our website, ExcelDemy. Happy learning!
Frequently Asked Questions
1. Can I create a comparison chart with a combination of different chart types?
Yes, you can create combination charts where you can use different chart types within the same chart in Excel.
2. Can I update my comparison chart automatically when the data changes?
Yes, you can update your chart automatically if it is based on a dynamic range or source. This is especially helpful when you have linked the chart to a table or a range using Excel formulas or named ranges.
3. Can I copy and paste my comparison chart from Excel to other documents or presentations? Yes, you can copy and paste your comparison chart from Excel to other documents or presentations. First, create the chart in Excel, simply select it, press Ctrl + C to copy and Ctrl + V to paste it into another presentation.
Comparison Chart in Excel: Knowledge Hub
- How to Compare 3 Sets of Data in Excel Chart
- How to Make a Salary Comparison Chart in Excel
- How to Create a Budget vs Actual Chart in Excel
- How to Make a Price Comparison Chart in Excel
- How to Make Sales Comparison Chart in Excel
- Side-by-Side Comparison Chart in Excel
- How to Create Weekly Comparison Chart in Excel
- How to Create Month to Month Comparison Chart in Excel
- How to Create Quarterly Comparison Chart in Excel
- Year Over Year Comparison Chart in Excel
<< Go Back to Excel Charts | Learn Excel
What is ExcelDemy?
Tags: Excel Charts

Zahid Hassan, BSc, Industrial and Production Engineering, Bangladesh University of Engineering and Technology, has worked with Exceldmy for 1.5 years. He has written 95+ articles for Exceldemy. He has worked as an Excel & VBA Content Developer. He also worked as a VBA Developer for the Template team. Currently, he is working as a Junior Software Developer for the Excel Add-in project. He is interested in Software Development, Python, VBA, VB.NET, and Data Science, expanding his expertise in... Read Full Bio
Leave a reply Cancel reply
ExcelDemy is a place where you can learn Excel, and get solutions to your Excel & Excel VBA-related problems, Data Analysis with Excel, etc. We provide tips, how to guide, provide online training, and also provide Excel solutions to your business problems.
Contact | Privacy Policy | TOS
- User Reviews
- List of Services
- Service Pricing

- Create Basic Excel Pivot Tables
- Excel Formulas and Functions
- Excel Charts and SmartArt Graphics
- Advanced Excel Training
- Data Analysis Excel for Beginners

Advanced Excel Exercises with Solutions PDF
Sciencing_Icons_Science SCIENCE
Sciencing_icons_biology biology, sciencing_icons_cells cells, sciencing_icons_molecular molecular, sciencing_icons_microorganisms microorganisms, sciencing_icons_genetics genetics, sciencing_icons_human body human body, sciencing_icons_ecology ecology, sciencing_icons_chemistry chemistry, sciencing_icons_atomic & molecular structure atomic & molecular structure, sciencing_icons_bonds bonds, sciencing_icons_reactions reactions, sciencing_icons_stoichiometry stoichiometry, sciencing_icons_solutions solutions, sciencing_icons_acids & bases acids & bases, sciencing_icons_thermodynamics thermodynamics, sciencing_icons_organic chemistry organic chemistry, sciencing_icons_physics physics, sciencing_icons_fundamentals-physics fundamentals, sciencing_icons_electronics electronics, sciencing_icons_waves waves, sciencing_icons_energy energy, sciencing_icons_fluid fluid, sciencing_icons_astronomy astronomy, sciencing_icons_geology geology, sciencing_icons_fundamentals-geology fundamentals, sciencing_icons_minerals & rocks minerals & rocks, sciencing_icons_earth scructure earth structure, sciencing_icons_fossils fossils, sciencing_icons_natural disasters natural disasters, sciencing_icons_nature nature, sciencing_icons_ecosystems ecosystems, sciencing_icons_environment environment, sciencing_icons_insects insects, sciencing_icons_plants & mushrooms plants & mushrooms, sciencing_icons_animals animals, sciencing_icons_math math, sciencing_icons_arithmetic arithmetic, sciencing_icons_addition & subtraction addition & subtraction, sciencing_icons_multiplication & division multiplication & division, sciencing_icons_decimals decimals, sciencing_icons_fractions fractions, sciencing_icons_conversions conversions, sciencing_icons_algebra algebra, sciencing_icons_working with units working with units, sciencing_icons_equations & expressions equations & expressions, sciencing_icons_ratios & proportions ratios & proportions, sciencing_icons_inequalities inequalities, sciencing_icons_exponents & logarithms exponents & logarithms, sciencing_icons_factorization factorization, sciencing_icons_functions functions, sciencing_icons_linear equations linear equations, sciencing_icons_graphs graphs, sciencing_icons_quadratics quadratics, sciencing_icons_polynomials polynomials, sciencing_icons_geometry geometry, sciencing_icons_fundamentals-geometry fundamentals, sciencing_icons_cartesian cartesian, sciencing_icons_circles circles, sciencing_icons_solids solids, sciencing_icons_trigonometry trigonometry, sciencing_icons_probability-statistics probability & statistics, sciencing_icons_mean-median-mode mean/median/mode, sciencing_icons_independent-dependent variables independent/dependent variables, sciencing_icons_deviation deviation, sciencing_icons_correlation correlation, sciencing_icons_sampling sampling, sciencing_icons_distributions distributions, sciencing_icons_probability probability, sciencing_icons_calculus calculus, sciencing_icons_differentiation-integration differentiation/integration, sciencing_icons_application application, sciencing_icons_projects projects, sciencing_icons_news news.
- Share Tweet Email Print
- Home ⋅
- Math ⋅
- Algebra ⋅
How to Make a Comparative Graph

The Difference Between Charts & Graphs
Simple graphs help you visualize and interpret data within a single subject, such as the amount of revenue one department brought in every year for several years. Comparative graphs, on the other hand, compare that same data across many subjects, such as how much revenue many departments brought in every year for several years. The two most common type of comparative graphs, which you can use separately or jointly, are bar graphs and line graphs.
Things You'll Need
Set your piece of paper on the table in the “Landscape” orientation. Draw an “L” shape so that the vertical line is two inches from the left side and the horizontal line is two inches from the bottom. Start the vertical line two inches from the top and end the horizontal line two inches from the right.
Write the information common to all subjects along the side and bottom. For example, compare the revenue brought in by different departments over a certain number of years by identifying the constants. In this instance, money and years are constants. Label money on the vertical axis and years along the horizontal axis.
Assign each subject a color. The example in Step 2 compares the revenue of different departments. Each department needs its own color. Write down which color correlates with which department in the top right-hand corner of the paper.
Draw a bar for each piece of information in the appropriate color. Line the bar up with the appropriate date, and extend it up to the correct number. For example, if the sales department brought in $50,000 in 2003, then the bar lines up with that date and extends to $50,000. Complete this process for each department.
Draw a line graph in addition to or instead of the bar. Color in a dot for each piece of data. Line the dot up with the information on the vertical and horizontal axis. For example, if the sales department made $30,000 in 2001, $45,000 in 2002 and $50,000 in 2003, a dot lines up with each appropriate date and number. Connect the dots. Repeat for each subject.
Allow the bars under each category to touch the others. For example, if there are three comparisons under the date “2003,” assign them the colors red, yellow and blue. Under the date 2003, draw the bars so that each different color bar touches the one to its left and right.
Related Articles
How to teach bar graphs to third-graders, histogram characteristics, the advantages of bar graphs, a science project on which nail polish lasts longer, difference between a bar graph & pie chart, the difference between bar graphs and line graphs, how to make a relative frequency table, how to calculate relative frequency distribution, how to find z-scores on a ti-84 plus, how to make a chart for a science fair project, how to interpret cogat scores, how to report a sample size, how to analyze graphs, how to calculate percent relative range, how to make a math brochure, how to make bar graphs, how to calculate phenotypic ratio, how to figure survey percentages, purpose of a histogram.
- Math Goodies: Line Graphs
- Allow the bars under each category to touch the others. For example, if there are three comparisons under the date "2003," assign them the colors red, yellow and blue. Under the date 2003, draw the bars so that each different color bar touches the one to its left and right.
About the Author
Colby Stream has been a writer since 2007. His work has appeared in "The Arbiter," the student newspaper of Boise State University, as well as various websites. Stream graduated with a Bachelor of Arts in communication as a presidential civic leadership scholar.
Photo Credits
Hemera Technologies/AbleStock.com/Getty Images
Find Your Next Great Science Fair Project! GO
We Have More Great Sciencing Articles!
Making behavior analysis fun and accessible
The AllDayABA Blog
Join our mailing list.
If you want to be the first to read new blog posts, gain access to awesome resources, and hear about upcoming projects, then click "Sign Up" to become a part of our family today!
Copyright © 2022 AllDayABA - All Rights Reserved.
Powered by GoDaddy
Cookie Policy
This website uses cookies. By continuing to use this site, you accept our use of cookies.
IMAGES
VIDEO
COMMENTS
One of the comparative analysis example strategies we recommend is using charts and graphs. Our brains process visual data 60,000 times faster than texts and figures. And this creates a concrete argument for using comparison-oriented charts and graphs, such as Matrix and Radar Graphs. These charts are amazingly easy to read and interpret.
Comparative analysis equips product owners with vital insights to make informed decisions. By evaluating competitors, product owners gain clarity on market trends and consumer preferences. They can identify gaps in their offerings and adapt strategies accordingly. This analysis guides decisions on features, pricing, and positioning, ensuring ...
Comparative analysis is a systematic approach used to evaluate and compare two or more entities, variables, or options to identify similarities, differences, and patterns. It involves assessing the strengths, weaknesses, opportunities, and threats associated with each entity or option to make informed decisions.
Example 1: Comparative Bar Chart. A simple and effective way to demonstrate comparisons is through a comparative bar chart. To create a simple comparative bar chart using Python's plotly library: import plotly.graph_objects as go. import pandas as pd. # Load your dataset here.
A comparative analysis is a side-by-side comparison that systematically compares two or more things to pinpoint their similarities and differences. The focus of the investigation might be conceptual—a particular problem, idea, or theory—or perhaps something more tangible, like two different data sets. For instance, you could use comparative ...
These days, anyone with a computer can download scientific data and graph data points for a comparative analysis. Using the example of the Earth's temperature, we first need to know the datasets ...
Here are some examples of the most common types: 1. Bar Graphs. Comparative bar graphs are used to compare data across different categories. They are made up of bars that represent the value of each category. Comparative bar graphs are useful when you want to compare data that is discrete and non-continuous. 2.
Comparative analyses can build up to other kinds of writing in a number of ways. For example: They can build toward other kinds of comparative analysis, e.g., student can be asked to choose an additional source to complicate their conclusions from a previous analysis, or they can be asked to revisit an analysis using a different axis of comparison, such as race instead of class.
Data Visualization. As its name implies, a comparison chart or comparison graph draws a comparison between two or more items across different parameters. You might use a comparison chart to look at similarities and differences between items, weigh multiple products or services in order to choose one, or present a lot of data in an easy-to-read ...
Determine the focus of your piece. Determine if you will focus on the similarities, the differences, or both. Be sure you treat each individual the same; each person deserves the same amount of focus-meaning, do not place most of the emphasis on you or the other person. Find a balance.
Describe both sides. Comparative analysis may try to show that one argument or idea is better, but the analysis must cover both sides equally. The analysis shows both sides of the main arguments and claims. For example, to compare the benefits and drawbacks of starting a recycling program, one might examine both the positive effects, such as ...
Also known as a comparative diagram, a comparison chart provides a visual representation of different choices or options. This helps you draw a comparison between two or more items across different parameters. ... Comparison chart examples. ... Pie charts are a popular visual tool for providing an easy-to-read comparative analysis. Imagine a ...
Make complex decisions easy by organizing your data in a comparison table. Our online comparison chart maker lets you create digestible comparison charts to present the different packages you offer, rate anything, or help your customers choose from a range of products. Start with a template, and use the suite of collaboration tools from Canva ...
Bar Charts: Using, Examples, and Interpreting. By Jim Frost 4 Comments. Use bar charts to compare categories when you have at least one categorical or discrete variable. Each bar represents a summary value for one discrete level, where longer bars indicate higher values. Types of summary values include counts, sums, means, and standard deviations.
Now we are ready to write some Python code for comparative analysis! Example 1: Comparative Bar Chart. A simple and effective way to demonstrate comparisons is through a comparative bar chart.
To summarize, here are the top types of charts and their uses: Number Chart - gives an immediate overview of a specific value. Line Chart - shows trends and changes in data over a period of time. Maps - visualizes data by geographical location. Waterfall Chart - demonstrates the static composition of data.
After that press CTRL+C to copy the table. Now press CTRL+V to paste the copied table in cell G4 and you will be able to see the following image on your screen. After that, click on any cell of the new Pivot Table. Afterward, from the Pivot Table Fields dialogue box, uncheck the Name box.
Draw a bar for each piece of information in the appropriate color. Line the bar up with the appropriate date, and extend it up to the correct number. For example, if the sales department brought in $50,000 in 2003, then the bar lines up with that date and extends to $50,000. Complete this process for each department.
The AllDayABA Blog. If you want to be the first to read new blog posts, gain access to awesome resources, and hear about upcoming projects, then click "Sign Up" to become a part of our family today!