
IB Economics Paper 1 Question Bank
Our IB Economics Paper 1 Question Bank is an incredible resource for students preparing for the IB Economics exam. The Question Bank is full of high-quality, properly formatted questions that cover all aspects of the IB Economics syllabus. The questions are clearly laid out and easy to understand, and the answer key provides detailed explanations for each question. This is an essential tool for any student who wants to do well on the IB Economics exam.
Microeconomics
1.) Using diagrams, to what extent does an indirect tax minimise negative consumption externalities? [15 marks]
There is an urgent need for increasing a tax on the sale of tobacco products, such as bidis, which are considered demerit goods as they are harmful to society. They create negative consumption externalities – costs that are suffered by a third party. For instance, as a consequence of passive smoking, non-smokers bear costs such as an increased risk of lung cancer. The market overallocates resources for this demerit good, leading to market failure. Let’s use the example of cigarettes to illustrate the impact of the indirect tax.
In Fig.1, the additional benefit incurred by the Indian consumers from consuming an extra tobacco product, Marginal Private Benefit (MPB), is greater than the additional benefits to society, Marginal Social Benefit (MSB). The demand curve depicts the MSB accrued to society, and MPB, whereas the supply curve represents the Marginal Social Cost (MSC), which includes the existing tax.
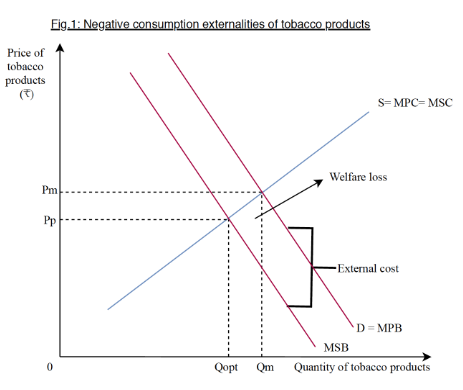
For tobacco, the external cost to society is represented by the vertical distance between MSB and MPB. The social optimum quantity is determined by the intersection of the MSB and MSC curves. However, there is excessive production of tobacco products as seen at Qm. Hence, the consumption of tobacco is greater than the socially optimal quantity, leading to a welfare loss.
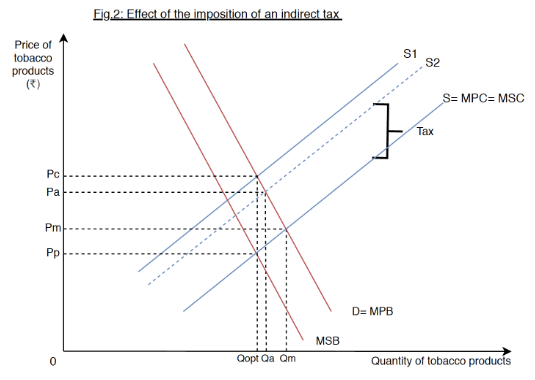
To minimize the production of such demerit goods to achieve the social optimum quantity (Qopt), economists recommend a hike in the indirect tax on tobacco products. Theoretically, this will lead to a decrease in tobacco supply as there is an increase in production costs. This is represented in Fig.2 by an upward shift of the supply curve from Marginal Private Cost (MPC) to S1. The quantity produced and consumed would drop from Qm to Qopt due to the intersection of curves S1 and MPB. As a result, the price would rise from Pm to Pc.
A high price may be a disincentive for consumers to purchase tobacco products or even initiate the usage of such, predominantly amongst the youth. Moreover, the Indian government would generate revenue. This revenue can not only be reinvested into crucial sectors of the economy such as healthcare and education.
However, there are several drawbacks to this policy since the addictive nature of tobacco products makes their demand inelastic, i.e. the market demand does not fall drastically when there is a price increase. Thus, the actual effect of this indirect tax likely does not completely shift the quantity of consumption close to Qopt (Fig 2). This is demonstrated in Fig 2 where the MPC curve does not fully overlap S1, but rather shifts to S2. It causes the price of tobacco products to rise from Pm to Pa, whereas quantity reduces from Qm to Qa (Fig 2). Shifting the quantity from Qm to Qopt will require a very high indirect tax which has regressive effects such as inefficiencies in correcting market failure as firms reduce production or may even close down in the long run. Although the recommendation of the tax amount is 75% of the retail price, the government may not have perfect information. While this level of taxation may be effective for lower socioeconomic classes, higher social classes may not be as affected. However, in the long run, millions of other lives would be affected as they depend on the trade of bidis for sustenance. Furthermore, there is a possibility of black markets emerging as individuals may not be willing to pay higher prices.
Instead, non-market-based policies, such as regulation, can be implemented to correct this market failure. For instance, the government could limit the amount of tobacco products produced or impose a ban on tobacco use in public places where consumption is high. They could impose severe penalties for consumers who violate the ban which further deters their consumption. Importantly, this policy is not affected by the price elasticity of demand, which is crucial in the case of tobacco products as they are highly inelastic. However, one major drawback with regulation is that it may disrupt equity between firms. If regulation policies are enforced upon firms who are not producers of tobacco products, but have a small percentage of tobacco in their products, the regulation may be unfair. Moreover, the government may incur significant costs to enforce this policy. Threats from black markets also remain an inevitable consequence under both policies. Overall, despite these drawbacks, regulation would be more effective than indirect taxes due to the inelastic nature of tobacco, lack of information and regressive effects.

Macroeconomics
1.) Evaluate the effectiveness of the expansionary monetary policy. [15 marks]
The Central Bank manipulates its interest rates in an attempt to bolster the economy from a recession. A recession is a period of a decline in economic activity, as a result of negative economic growth for two consecutive quarters. The Central Bank enforces an expansionary monetary policy – the reduction of interest rates – to increase the economy’s Aggregate Demand (AD). AD is the total demand for goods and services in an economy at different price levels.
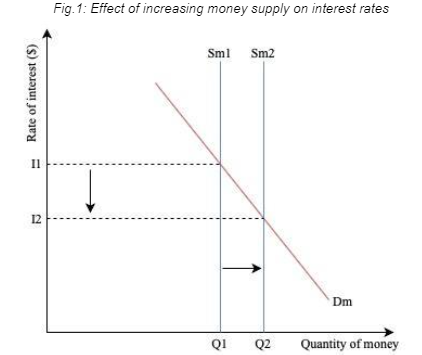
As seen in Fig.1, the reduction in interest rates from I1 to I2 does not occur on its own, but is a response from increasing the money supply from S1 to S2. As this supply rises, the demand for money (Dm) expands, reducing the cost of borrowing.
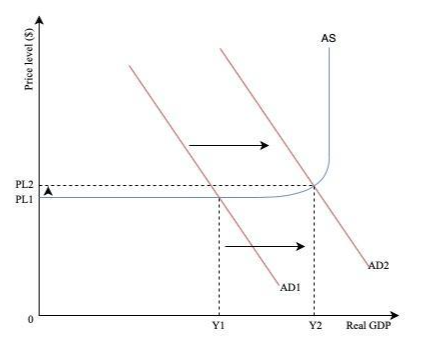
Reduced interest rates boost the components of AD such as consumption and investment as households and firms tend to spend more and save less, consequently increasing AD. This is represented by a rightward shift from AD1 to AD2 in Fig.2. To meet with higher demands, markets and businesses would expand production by increasing employment, which results in a hike in wages. This contributes to their cost of production, directly affecting price level as shown from PL1 to PL2.
Keynes, a British economist, argued that AD is the primary driving force in an economy for which prices and wages are inflexible. In the Keynesian model, an increase in AD leads to a higher real GDP. However, this only occurs while spare capacity is prevalent, as represented by the horizontal region of the Aggregate Supply (AS) curve. Once the spare capacity is exhausted, the firm is forced to produce at a higher price level. Hence it is efficient to produce at the full employment level of output (Y2), resulting in economic growth.
Firstly, the increase in AD will eventually lead to economic growth. It can then be inferred that economic growth will give rise to multiple benefits such as reduced poverty due to higher incomes and better education, improving society as a whole. Stakeholders such as consumers are able to borrow and spend with ease, hence resulting in higher living standards. Firms could benefit from the lower interest rates by increasing their investment in R&D, which could lead to increased efficiency and lower prices, making it prudent for the health of the economy in the long run.
However, there are a few drawbacks. Although consumption and investment may increase, it could take several months for a distinctive change to occur as interest rates are only a component of the various deciding factors. This policy also disfavors lower-income groups as it not only leads to inflation as firms set higher prices, but also reduces their ability to borrow loans as banks fear that the consumers will not pay them back. Lastly, the Federal Reserve may lose focus on pursuing other goals, such as exchange rate stability.
Alternatively, market-based supply side policies could be implemented as they increase the economy’s productive potential by improving quality and quantity of inputs . As market and business investments are one of the main ways by which the economy could prevent itself from entering recessionary territory, the appropriate policy must focus on those aspects mainly . The government may provide an incentive to work as disposable income rises when lowering income taxes. Whereas for the firms, a reduction in corporate tax gives incentive to raise productivity by increasing quality and quantity of capital. Furthermore, the government can increase spending on long term assets such as education and infrastructure, thereby creating jobs directly. As education allows the development of skills, there will be a larger skilled labour force in the economy, whereas infrastructure reduces production and transportation costs, increasing productivity and leading to long-run economic growth. This helps achieve all macro-economic objectives to a larger extent. However, as they are very expensive to do, it involves an opportunity cost.
To conclude, monetary policy benefits multiple stakeholders and promotes economic growth. Nevertheless, the policy could introduce harmful impacts to society due to time lags, unpredictability, and indirect effects. Hence, an alternative policy of increasing government expenditure is recommended to stimulate economic growth with greater efficiency.
Our Expert Tutors!

Barbara Centis
Cat 1 – ESS and Cat 2 – Biology. Chief of the IB program. Mentored 320+ students across various curricula.

Dr Rashmi Kapoor
IBDP Cat 1 – Biology. Specializes in IBDP and A Levels Biology. 10+ years in Medicine with seasoned professionals.

Jacqueline Francis
IBDP Cat 1 – Business Management, IBDP Cat 1 – TOK. Taught over 130+ students across 4+ countries.

Dr. Nikita Bhan
IBDP Cat 1 & 2 November 2019. Specializes in Global Politics. Many students scored 7s; mentors 200+ students in assessments.

Shreya Narula
IBDP Cat 2 – English, IBDP Cat 2 – TOK. Qualifications as IB Examiner & Supervisor. Taught over 120+ students.

Sreevidya KG
IBDP Cat 1 – Chemistry, IBDP Cat 3 – IA Chemistry, IBDP Cat 1 – TOK. Helped 2 out of 3 students achieve a 7 in IB Chemistry.
Get access to our free IB resources

ANNOUNCEMENT
Download our Successful College Application Guide developed by counselors from the University of Cambridge for institutions like Oxbridge alongside other Ivy Leagues . To join our college counseling program, call at +918825012255
We are hiring a Business Development Associate and Content Writer and Social Media Strategist at our organisation TYCHR to take over the responsibility of conducting workshops and excelling in new sales territory. View More
- Find A Tutor
- Geneva Tutors
- Lausanne Tutors
- Zurich Tutors
- Basel Tutors
- Online Tutors
- Maths Tutors
- Chemistry Tutors
- Physics Tutors
- Biology Tutors
- English Tutors
- History Tutors
- Geography Tutors
- Language Tutors
- Special Educational Needs
- Residential Tutors
- Primary School
- School Entrance Exams
- Middle School
- Combined Science
- Maths AA and AI
- IB Internal Assessment
- Environmental Systems & Societies (ESS)
- Sports, Exercise & Health Science
- Computer Science
- Global Politics
- Digital Society
- Business Management
- Visual Arts
- English A/B
- English Oral (IO)
- German Oral (IO)
- French Oral (IO)
- Spanish A/B
- French Ab Initio
- German Ab Initio
- Spanish Ab Initio
- IB Extended Essay
- IB Theory of Knowledge
- University Applications
- Our Approach
- Happy Parents
- School Choice
- Become a Tutor
How to Nail Your IB Economics Paper 1
By TutorsPlus

Wondering how to nail your IB Economics Paper 1? Being the first stage (out of 3 or 4, depending on your level) of your final exam, Paper 1 can make or break your IB result. Simultaneously stressful and thought-provoking, Paper 1 demands more than solid knowledge of theory.
In this post, we’re going to walk you through the structure of the IB Economics Paper 1, the best method to approach it, as well as some valuable tips to maximize your marks.
The Structure of IB Economics Paper 1
Paper 1 makes up 30% of your final score if you’re at SL and 20% if you’re at HL. There is a lot of work to do to nail your exam, but first of all, you need to understand how IB Economics Paper 1 is designed.
Paper 1 is basically an essay . i.e. the examiners for this part of your IB want to see extended responses. The duration of the assessment is 1 hour and 15 minutes regardless of your Level, plus you will have 5 minutes to read the questions. When it comes to the latter, you will be offered three, out of which you need to choose one to answer. These questions relate to one of the components of the IB Economics syllabus :
- Introduction to Economy.
- Microeconomics.
- Macroeconomics.
- The Global Economy.
Each question in Paper 1 consists of two parts. Part A is normally an ‘explain’ type of question and you will need roughly 30 minutes to complete it.
Part B features an ‘evaluation’ question even though the word ‘evaluation’ isn’t always used. You should spend approximately 45 minutes to answer it. Part A and Part bring a maximum of 10 and 15 marks respectively, and fully completed Paper 1 adds 25 marks to your total score.

Iordanis is an experienced IB teacher and official IBO examiner. He holds Bachelor degrees in Education, Business Administration and Economics. He has extensive experience teaching IBDP Business and Economics at a number of prestigious international schools and is currently Head of Economics at Berlin Cosmopolitan School.

DEED(E) Approach to Paper 1
When answering Paper 1, we recommend sticking to the so-called DEED(E) method, standing for:
- D efine – provide a definition of all the terms your answer contains.
- E xample – give real-life examples or hypothetical situations that illustrate economical terms or processes related to the questions of your Paper 1.
- E xplain – elaborate on your answer, connect it to other relevant keywords or terms, and explain their interconnection.
- D iagram – introduce a diagram that is most appropriate to your answer. It is also critical to explain your diagram (for example, how demand changes based on price/seasonality/competition/shortage of goods/whatever other factor you consider).
- E valuate – applicable only to part B of your Paper, it requests you to provide your own opinion on the matter, detail pros and cons, explain possible consequences of economic actions, etc.
Your answer doesn’t have to follow this particular order to the letter. The explanation part can go before the examples, and you can move definitions of terms to the very end. The most important thing is that you organize your answer in a straightforward manner where everything makes sense and it is easy to track your flow of thoughts.
Tips for IB Economics Paper 1
The DEED(E) approach lends an outline for your answer to Paper 1 . Now that you have the plan to follow, let us give you a few tips on how to tackle each section.
Definitions
Definitions are a foundation to build your entire answer for Paper 1. They show how well you understand the question and economic theory as a whole. You need to know the terms like the back of your hand to score as many marks as possible.
Learning textbook definitions of all the terms is a daunting task. Instead of memorizing, you should try to understand them. For example, it is beneficial to highlight and trace factors that trigger or underline certain economic processes. This will allow you to see a broader picture and the relationship of its elements rather than focusing on the isolated small fragments.
We also recommend using various study materials since they provide different perspectives (as well as explanations and insights) on the same things. Chances are that definitions of a certain author (not necessarily the one you learned in class) resonate with you better.
You can even make a vocabulary list of all the terms (for Demand, Supply, Competitive equilibrium, and so on). Try to find definitions from different authors, put them side by side, and compare. Then, you can come up with your own definition based on the works of others. Terms that you explain in your own words will stick in your mind better and give you a deeper understanding than someone else’s explanations.
Now let’s get back to Paper 1. Start your answer with an explanation of what the question is about using the keyword/term introduced in the question. After that, define the term itself. For instance, in the question “Explain how fiscal policy could be used to increase aggregate demand” you can clearly see two terms – fiscal policy and aggregate demand. Needless to say, you need to define both of them.
It is likely that you will need to mention other terms during the ‘Explanation’ or ‘Example’ parts – make a mental note of these terms but don’t put all the definitions at the top of your essay. Instead, introduce them organically as you elaborate on your answer. Remember – never leave a single term or keyword without a definition since it will reduce your marks. If the body of your work lacks some important definitions, make sure to at least put them at the end. For example, you can say something like this: ‘In conclusion, I would like to define key terms I used throughout my essay…’
Explanation
This part is about providing an answer to the question. Let’s get back to the fiscal policy question. To answer it, you can mention that lowering taxes, increasing unemployment benefits and other social expenses have a beneficial effect on the stimulation of aggregate demand. It is a good idea to list a few fiscal factors that affect aggregate demand and in which way. Make sure that your answer is concise yet clear, comprehensive, and has a good flow.
Your answer will not be complete without an example. Ideally, you should look for real-life examples . This means you must start your research long before the exam. After completing each topic of the syllabus, spend some time finding appropriate examples.
Let’s get back to fiscal policy and aggregate demand – it falls under the “Role of government in microeconomics’. After you study the measurements authorities resort to in order to improve the domestic economic situation, refer to search engines for relevant examples. But don’t just type in ‘How can fiscal policy increase aggregate demand’ because it will just provide textbook examples. Instead, you can use a query such as ‘tax reduction led to an increase in aggregate demand’. But you should be even more specific than this – add a year and country to ensure more relevant results.
We suggest that you use Google News for your research since this tool provides easy filtering by date and topic. Also, it’s best that you search in English since you’ll have access to more sources.
After you find a relevant article, summarize it using the following structure:
- Where – what country/region
- What – which measures did the government implement
- How much – increase/decrease by %, from X to Y
- Result – what it resulted in and by which extent.
This information is fairly difficult to memorize since so many numbers are involved, let alone actions and their consequences. Yet, the answer “In 2015, China cut VAT rate by 1.8% and it led to the increase of aggregate demand by 4.2% in the following year’ looks much better than “China cut VAT and it led to the increase of aggregate demand’.
To help you commit these facts to your memory, try to turn them into visuals (infographics, for example) and post them in a place where you’ll see them every day. By the way, you don’t have to learn all the numbers by heart because it is not a competition in accuracy. It will suffice to say that a reduction by approximately 2% increased demand by over 4%.
The inclusion of real-life examples in your answer is important for top grades. However, don’t get upset if you are not able to provide one. A hypothetical example will do, as long as it is relevant to your situation, demonstrates good judgment, and you are able to use it to build a diagram.
Diagrams are an essential part of economic theory, and it is vital that you know how to draw them. They are also accountable for 2-3 marks out of a total of 25 for IB Economics Paper 1.
Before you include any diagram (Keynesian, Monetarist, etc.) in your answer, it’s worth taking a minute to consider which type fits your needs best. After you chose an appropriate type, draw it using your data. Be very careful with measurement units and the appearance of the diagram. After you are done drawing it, you should fully label it – every axe, curve, intersection, etc. must display relevant and accurate information.
A diagram can’t exist on its own. It must come with an explanation put in words – you need to clarify how a factor on axis X affected an economic process shown on axis Y.
You should keep in mind that Paper 1 consists of two sections – Part A and Part B. Part B is pretty similar to part A, but it features an analytical component.
To nail this section, you can use the DEED approach but slightly modified – DEEDE. The last E stands for Evaluation, and it brings 5 points more (15 points for Part B vs 10 marks for Part A).
Evaluation implies providing a personal perspective on economic actions and processes specified in the question. In other words, it required you to analyze, compare and contrast, justify, predict consequences, highlight advantages and disadvantages, and so on. If you struggle with this part, another acronym, CLASPP , will come in handy:
- C onclusion – explain reasons for the reviewed situation and its effects.
- L ong-Term and Short-Term – how effective are the implemented measurements in the long and short run?
- A ssumptions – what kind of assumptions had to be made to conduct an analysis? Are they realistic and how do they affect the situation?
- S takeholders – how does this situation affect all the involved parties?
- P riority – what are the priorities for those who introduced these economic measurements?
- P ros and Cons – what benefits and shortcomings are associated with this situation?
So, when getting down to the evaluation part, use 2 or three of these concepts to provide your point of view.
You need to convey your evaluations convincingly, especially when time is limited. Our best advice here? Practice! Past papers are of great help to learn what kind of questions you may get. Your practice is to answer them. Remember, you have approximately 15 minutes (and maybe even less if you spend too much time on other parts of the essay) to do the Evaluation. Set a timer and get cracking.
Failed to convey your thought in a given time? Try again using shorter sentences and more concise wording. After a while, you’ll get more confident with your answers and more efficient with your style.
Nail Your IB Economics Paper 1 with TutorsPlus
One more beneficial way to nail your IB Economics Paper 1 is to hire a tutor. Paper 1 is an essay meaning it requires more than knowledge of economic theory. You should also demonstrate independent research (real-life examples), adhesion to a certain structure, as well as a concise yet comprehensive term-rich language. All of this is hard to attain… unless you have someone to guide you.
An IB Economics Tutor can make a difference between a run-of-the-mill paper and a 25-mark-worthy one. Whether you’re lacking solid theoretical knowledge or you’re not sure how to approach your assessment, a tutor is able to help you. You can even have a mock exam to get well-prepared for the real thing.
Are you ready to make a decision to boost your academic success? Then don’t hesitate to book one of our tutors using this online form . You can also contact Tutors Plus via our email – [email protected] – or simply call us 022 731 8148.
Popular Posts

English IO – How to Ace Your IB English Literature & Language Oral

Tips to get a Top Grade in Your IGCSE English

How to get a top score in your IB TOK Exhibition

IGCSE Maths Revision Tips

What is the IA, EE or TOK? Everything you need to know about the IB written assignments

Maths Anxiety – How Parents Can Help
More articles from our expert tutors.

Full Guide to IB Economics Internal Assessment (IA)

Managing school stress workshop

Tips to Ace Your IGCSE Biology
Find a Tutor Today
" * " indicates required fields
Step 1 of 5
Find the best support for your family
Final dates! Join the tutor2u subject teams in London for a day of exam technique and revision at the cinema. Learn more →
Reference Library
Collections
- See what's new
- All Resources
- Student Resources
- Assessment Resources
- Teaching Resources
- CPD Courses
- Livestreams
Study notes, videos, interactive activities and more!
Economics news, insights and enrichment
Currated collections of free resources
Browse resources by topic
- All Economics Resources
Resource Selections
Currated lists of resources
- Exam Support
Edexcel Economics Paper 1 - Preparing for the 2024 Paper

12th March 2024
- Share on Facebook
- Share on Twitter
- Share by Email
In this revision video Geoff provides some advice on structuring answers and getting top marks - we also look at some topical issues ahead of the May 2024 Paper 1. If you have any questions, please do post them in the comments section of the video on YouTube.
Geoff Riley
Geoff Riley FRSA has been teaching Economics for over thirty years. He has over twenty years experience as Head of Economics at leading schools. He writes extensively and is a contributor and presenter on CPD conferences in the UK and overseas.
You might also like

Questioning the UK’s Economic Recovery - Exam Style
29th January 2015
Practice Data Response Unemployment and Inflation
22nd February 2015
A2 Macroeconomics Concepts: Can You Distinguish Between...?
1st April 2015
Grade Boundaries for AS and A2 Economics (EdExcel)
3rd April 2015
Economics Revision Webinars with Geoff Riley
25th May 2015
AS Macro - The Final Countdown
16th May 2015
Ten Key Topics / Issues for the Edexcel Unit 4 Paper (2015)
Ocr f585 case study toolkit presentation.
14th June 2015
Related products

Theme 2 Study Book for Edexcel A-Level Economics
02-4130-30357-01

Calculation Practice Book for Edexcel A-Level Economics
02-4130-30242-03

Theme 1 Study Book for Edexcel A-Level Economics
02-4130-30348-01
- View full selection ›
Our subjects
- › Criminology
- › Economics
- › Geography
- › Health & Social Care
- › Psychology
- › Sociology
- › Teaching & learning resources
- › Student revision workshops
- › Online student courses
- › CPD for teachers
- › Livestreams
- › Teaching jobs
Boston House, 214 High Street, Boston Spa, West Yorkshire, LS23 6AD Tel: 01937 848885
- › Contact us
- › Terms of use
- › Privacy & cookies
© 2002-2024 Tutor2u Limited. Company Reg no: 04489574. VAT reg no 816865400.
Programmes & Qualifications
Cambridge igcse economics (0455).
- Past papers, examiner reports and specimen papers
You can download one or more papers for a previous session. Please note that these papers may not reflect the content of the current syllabus.
Unlock more content
This is only a selection of our papers. Registered Cambridge International Schools can access the full catalogue of teaching and learning materials including papers from 2018 through our School Support Hub .
Past papers
- -->June 2022 Mark Scheme Paper 11 (PDF, 154KB)
- -->June 2022 Mark Scheme Paper 21 (PDF, 511KB)
Examiner reports
- -->June 2022 Examiner Report (PDF, 2MB)
Specimen papers
- -->2020 Specimen Paper 1 Mark Scheme (PDF, 897KB)
- -->2020 Specimen Paper 2 Mark Scheme (PDF, 172KB)
Stay up to date
Sign up for updates about changes to the syllabuses you teach
- Syllabus overview
- Published resources
May 2023 Papers for CAIE Qualifications Available Now! Read More.
Cambridge O levels
Cambridge IGCSE
Cambridge Int'l AS & A Levels
📌 Update(s): 13/08/2023 NEW! AS/A Level latest papers added!
If any paper is still missing, please report using the Contact Us! tab.
- Specimen Papers
Common Search Terms:
Resource Guide for File Naming System.
Click the image to view.
We are aware of some issues with pdfs on the website after last night's update. Some should now be fixed and others will be later today.

Economics Revision

Takudzwa Z. ★ 5.0 (1)
University of sheffield - bsc economics.
Economics Tutor with real-world experience as an Economist in both Macroeconomic and Microeconomic sectors

You can find summary notes and past papers for each of the modules and exam boards below.
A-Levels from 2015
International a-levels (ial), connect with pmt education.
- Revision Courses
- Past Papers
- Solution Banks
- University Admissions
- Numerical Reasoning
- Legal Notices
Edexcel A-Level Economics Past Papers
This section includes recent A-Level Economics and AS Economics past papers from Pearson Edexcel. You can download each of the Pearson Edexcel A-Level Economics past papers and marking schemes by clicking the links below.
Economics A (9EC0): Pearson Edexcel A-Level Past Papers June 2022
Paper 1: A-Level - Markets and Business Behaviour (9EC0/01) Download Past Paper - Download Mark Scheme Paper 2: A-Level - The National and Global Economy (9EC0/02) Download Past Paper - Download Mark Scheme Paper 3: A-Level - Microeconomics and Macroeconomics (9EC0/03) Download Past Paper - Download Mark Scheme
Economics B (9EB0): Pearson Edexcel A-Level Past Papers June 2022
Paper 1: A-Level - Markets and how they Work (9EB0/01) Download Past Paper - Download Mark Scheme Paper 2: A-Level - Competing in the Global Economy (9EB0/02) Download Past Paper - Download Mark Scheme Paper 3: A-Level - The Economic Environment and Business (9EB0/03) Download Past Paper - Download Mark Scheme
Economics A (9EC0): Pearson Edexcel A-Level Past Papers November 2021
Economics B (9EB0): Pearson Edexcel A-Level Past Papers November 2021
Economics A (9EC0): Pearson Edexcel A-Level Past Papers November 2020
Paper 1: A-Level - Markets and Business Behaviour (9EC0/01) Download Past Paper - Download Mark Scheme Paper 2: A-Level - The National and Global Economy (9EC0/02) Download Past Paper - Download Mark Scheme Paper 3: A-Level - Microeconomics and Macroeconomics (9EC0/03) Download Past Paper - Download Mark Scheme
The above papers are labelled June 2020
Economics A (8EC0): Pearson Edexcel AS-Level Past Papers November 2020
Paper 1: AS - Introduction to Markets and Market Failure (8EC0/01) Download Past Paper - Download Mark Scheme Paper 2: AS - The UK Economy - performance and policies (8EC0/02) Download Past Paper - Download Mark Scheme
The above papers are labelled June 2020
Economics B (9EB0): Pearson Edexcel A-Level Past Papers November 2020
Paper 1: A-Level - Markets and how they Work (9EB0/01) Download Past Paper - Download Mark Scheme Paper 2: A-Level - Competing in the Global Economy (9EB0/02) Download Past Paper - Download Mark Scheme Paper 3: A-Level - The Economic Environment and Business (9EB0/03) Download Past Paper - Download Mark Scheme
Economics B (8EB0): Pearson Edexcel AS-Level Past Papers November 2020
Paper 1: AS - Markets, Consumers and Firms (8EB0/01) Download Past Paper - Download Mark Scheme Paper 2: AS - The Wider Economic Environment (8EB0/02) Download Past Paper - Download Mark Scheme
Economics A (9EC0): Pearson Edexcel A-Level Past Papers June 2019
Paper 1: A-Level - Markets and Business Behaviour (9EC0/01) Download Past Paper - Download Mark Scheme Paper 2: A-Level - The National and Global Economy (9EC0/02) Download Past Paper - Download Mark Scheme Paper 3: A-Level - Microeconomics and Macroeconomics (9EC0/03) Download Past Paper - Download Mark Scheme
Economics A (8EC0): Pearson Edexcel AS-Level Past Papers June 2019
Economics B (9EB0): Pearson Edexcel A-Level Past Papers June 2019
Paper 1: A-Level - Markets and how they Work (9EB0/01) Download Past Paper - Download Mark Scheme Paper 2: A-Level - Competing in the Global Economy (9EB0/02) Download Past Paper - Download Mark Scheme Paper 3: A-Level - The Economic Environment and Business (9EB0/03) Download Past Paper - Download Mark Scheme
Economics B (8EB0): Pearson Edexcel AS-Level Past Papers June 2019
Economics A (9EC0): Pearson Edexcel A-Level Past Papers June 2018
Paper 1: A-Level - Markets and Business Behaviour (9EC0/01) Download Past Paper - Download Mark Scheme Paper 2: A-Level - The National and Global Economy (9EC0/02) Download Past Paper - Download Mark Scheme Paper 3: A-Level - Microeconomics and Macroeconomics (9EC0/03) Download Past Paper - Download Mark Scheme
Economics A (8EC0): Pearson Edexcel AS-Level Past Papers June 2018
Paper 1: AS - Introduction to Markets and Market Failure (8EC0/01) Download Past Paper - Download Mark Scheme Paper 2: AS - The UK Economy - performance and policies (8EC0/02) Download Past Paper - Download Mark Scheme
Economics B (9EB0): Pearson Edexcel A-Level Past Papers June 2018
Paper 1: A-Level - Markets and how they Work (9EB0/01) Download Past Paper - Download Mark Scheme Paper 2: A-Level - Competing in the Global Economy (9EB0/02) Download Past Paper - Download Mark Scheme Paper 3: A-Level - The Economic Environment and Business (9EB0/03) Download Past Paper - Download Mark Scheme
Economics B (8EB0): Pearson Edexcel AS-Level Past Papers June 2018
Paper 1: AS - Markets, Consumers and Firms (8EB0/01) Download Past Paper - Download Mark Scheme Paper 2: AS - The Wider Economic Environment (8EB0/02) Download Past Paper - Download Mark Scheme
Economics A (9EC0): Edexcel A-Level Past Papers June 2017
Economics A (8EC0): Edexcel AS-Level Past Papers June 2017
Economics B (9EB0): Edexcel A-Level Past Papers June 2017
Economics B (8EB0): Edexcel AS-Level Past Papers June 2017
Economics A (8EC0): Edexcel AS-Level Past Papers June 2016
Paper 1: AS - Introduction to Markets and Market Failure (8EC0/01) - Download Past Paper - Download Mark Scheme Paper 2: AS - The UK Economy - performance and policies (8EC0/02) - Download Past Paper - Download Mark Scheme
Economics B (8EB0): Edexcel AS-Level Past Papers June 2016
Paper 1: AS - Markets, Consumers and Firms (8EB0/01) - Download Past Paper - Download Mark Scheme Paper 2: AS - The Wider Economic Environment (8EB0/02) - Download Past Paper - Download Mark Scheme
Edexcel A-Level Economics Past Papers June 2016
Unit 1: Competitive Markets: How they work and why they fail (6EC01) - Download Past Paper - Download Mark Scheme
Unit 2: Managing the Economy (6EC02) - Download Past Paper - Download Mark Scheme
Unit 3: Business Economics and Economic Efficiency (6EC03) - Download Past Paper - Download Mark Scheme
Unit 4: The Global Economy (6EC04) - Download Past Paper - Download Mark Scheme
Edexcel A-Level Economics June 2015
Edexcel A-Level Economics June 2014
For more A-Level Economics past papers from other exam boards click here .

A-Level Edexcel Economics: Paper 1 (Microeconomics)
Download A-Level Edexcel Economics: Paper 1 (Microeconomics) Past Papers & Mark Schemes
June 2022 (A2)
June 2022 (as), november 2021 (a2), october 2020 (a2), october 2020 (as), june 2019 (a2), june 2019 (as), june 2018 (a2), june 2018 (as), june 2017(a2), june 2017 (as), june 2016 (as), specimen 2015 (a2).
- Study Guides
- Homework Questions
Micro Economics Paper final.edited
- Share full article

There’s an Explosion of Plastic Waste. Big Companies Say ‘We’ve Got This.’
Big brands like Procter & Gamble and Nestlé say a new generation of plants will help them meet environmental goals, but the technology is struggling to deliver.
Recycled polypropylene pellets at a PureCycle Technologies plant in Ironton, Ohio. Credit... Maddie McGarvey for The New York Times
Supported by

By Hiroko Tabuchi
- Published April 5, 2024 Updated April 8, 2024, 8:23 a.m. ET
By 2025, Nestle promises not to use any plastic in its products that isn’t recyclable. By that same year, L’Oreal says all of its packaging will be “refillable, reusable, recyclable or compostable.”
And by 2030, Procter & Gamble pledges that it will halve its use of virgin plastic resin made from petroleum.
To get there, these companies and others are promoting a new generation of recycling plants, called “advanced” or “chemical” recycling, that promise to recycle many more products than can be recycled today.
So far, advanced recycling is struggling to deliver on its promise. Nevertheless, the new technology is being hailed by the plastics industry as a solution to an exploding global waste problem.
The traditional approach to recycling is to simply grind up and melt plastic waste. The new, advanced-recycling operators say they can break down the plastic much further, into more basic molecular building blocks, and transform it into new plastic.
PureCycle Technologies, a company that features prominently in Nestlé, L’Oréal, and Procter & Gamble’s plastics commitments, runs one such facility, a $500 million plant in Ironton, Ohio. The plant was originally to start operating in 2020 , with the capacity to process as much as 182 tons of discarded polypropylene, a hard-to-recycle plastic used widely in single-use cups, yogurt tubs, coffee pods and clothing fibers, every day.

But PureCycle’s recent months have instead been filled with setbacks: technical issues at the plant, shareholder lawsuits, questions over the technology and a startling report from contrarian investors who make money when a stock price falls. They said that they had flown a drone over the facility that showed that the plant was far from being able to make much new plastic.
PureCycle, based in Orlando, Fla., said it remained on track. “We’re ramping up production,” its chief executive, Dustin Olson, said during a recent tour of the plant, a constellation of pipes, storage tanks and cooling towers in Ironton, near the Ohio River. “We believe in this technology. We’ve seen it work,” he said. “We’re making leaps and bounds.”
Nestlé, Procter & Gamble and L’Oréal have also expressed confidence in PureCycle. L’Oréal said PureCycle was one of many partners developing a range of recycling technologies. P.&G. said it hoped to use the recycled plastic for “numerous packaging applications as they scale up production.” Nestlé didn’t respond to requests for comment, but has said it is collaborating with PureCycle on “groundbreaking recycling technologies.”
PureCycle’s woes are emblematic of broad trouble faced by a new generation of recycling plants that have struggled to keep up with the growing tide of global plastic production, which scientists say could almost quadruple by midcentury .
A chemical-recycling facility in Tigard, Ore., a joint venture between Agilyx and Americas Styrenics, is in the process of shutting down after millions of dollars in losses. A plant in Ashley, Ind., that had aimed to recycle 100,000 tons of plastic a year by 2021 had processed only 2,000 tons in total as of late 2023, after fires, oil spills and worker safety complaints.
At the same time, many of the new generation of recycling facilities are turning plastic into fuel, something the Environmental Protection Agency doesn’t consider to be recycling, though industry groups say some of that fuel can be turned into new plastic .
Overall, the advanced recycling plants are struggling to make a dent in the roughly 36 million tons of plastic Americans discard each year, which is more than any other country. Even if the 10 remaining chemical-recycling plants in America were to operate at full capacity, they would together process some 456,000 tons of plastic waste, according to a recent tally by Beyond Plastics , a nonprofit group that advocates stricter controls on plastics production. That’s perhaps enough to raise the plastic recycling rate — which has languished below 10 percent for decades — by a single percentage point.
For households, that has meant that much of the plastic they put out for recycling doesn’t get recycled at all, but ends up in landfills. Figuring out which plastics are recyclable and which aren’t has turned into, essentially, a guessing game . That confusion has led to a stream of non-recyclable trash contaminating the recycling process, gumming up the system.
“The industry is trying to say they have a solution,” said Terrence J. Collins, a professor of chemistry and sustainability science at Carnegie Mellon University. “It’s a non-solution.”
‘Molecular washing machine’
It was a long-awaited day last June at PureCycle’s Ironton facility: The company had just produced its first batch of what it describes as “ultra-pure” recycled polypropylene pellets.
That milestone came several years late and with more than $350 million in cost overruns. Still, the company appeared to have finally made it. “Nobody else can do this,” Jeff Kramer, the plant manager, told a local news crew .
PureCycle had done it by licensing a game-changing method — developed by Procter & Gamble researchers in the mid-2010s, but unproven at scale — that uses solvent to dissolve and purify the plastic to make it new again. “It’s like a molecular washing machine,” Mr. Olson said.
There’s a reason Procter & Gamble, Nestlé and L’Oréal, some of the world’s biggest users of plastic, are excited about the technology. Many of their products are made from polypropylene, a plastic that they transform into a plethora of products using dyes and fillers. P.&G. has said it uses more polypropylene than any other plastic, more than a half-million tons a year.
But those additives make recycling polypropylene more difficult.
The E.P.A. estimates that 2.7 percent of polypropylene packaging is reprocessed. But PureCycle was promising to take any polypropylene — disposable beer cups, car bumpers, even campaign signs — and remove the colors, odors, and contaminants to transform it into new plastic.
Soon after the June milestone, trouble hit.
On Sept. 13, PureCycle disclosed that its plant had suffered a power failure the previous month that had halted operations and caused a vital seal to fail. That meant the company would be unable to meet key milestones, it told lenders.
Then in November, Bleecker Street Research — a New York-based short-seller, an investment strategy that involves betting that a company’s stock price will fall — published a report asserting that the white pellets that had rolled off PureCycle’s line in June weren’t recycled from plastic waste. The short-sellers instead claimed that the company had simply run virgin polypropylene through the system as part of a demonstration run.
Mr. Olson said PureCycle hadn’t used consumer waste in the June 2023 run, but it hadn’t used virgin plastic, either. Instead it had used scrap known as “post industrial,” which is what’s left over from the manufacturing process and would otherwise go to a landfill, he said.
Bleecker Street also said it had flown heat-sensing drones over the facility and said it found few signs of commercial-scale activity. The firm also raised questions about the solvent PureCycle was using to break down the plastic, calling it “a nightmare concoction” that was difficult to manage.
PureCycle is now being sued by other investors who accuse the company of making false statements and misleading investors about its setbacks.
Mr. Olson declined to describe the solvent. Regulatory filings reviewed by The New York Times indicate that it is butane, a highly flammable gas, stored under pressure. The company’s filing described the risks of explosion, citing a “worst case scenario” that could cause second-degree burns a half-mile away, and said that to mitigate the risk the plant was equipped with sprinklers, gas detectors and alarms.
Chasing the ‘circular economy’
It isn’t unusual, of course, for any new technology or facility to experience hiccups. The plastics industry says these projects, once they get going, will bring the world closer to a “circular” economy, where things are reused again and again.
Plastics-industry lobbying groups are promoting chemical recycling. At a hearing in New York late last year, industry lobbyists pointed to the promise of advanced recycling in opposing a packaging-reduction bill that would eventually mandate a 50 percent reduction in plastic packaging. And at negotiations for a global plastics treaty , lobby groups are urging nations to consider expanding chemical recycling instead of taking steps like restricting plastic production or banning plastic bags.
A spokeswoman for the American Chemistry Council, which represents plastics makers as well as oil and gas companies that produce the building blocks of plastic, said that chemical recycling potentially “complements mechanical recycling, taking the harder-to-recycle plastics that mechanical often cannot.”
Environmental groups say the companies are using a timeworn strategy of promoting recycling as a way to justify selling more plastic, even though the new recycling technology isn’t ready for prime time. Meanwhile, they say, plastic waste chokes rivers and streams, piles up in landfills or is exported .
“These large consumer brand companies, they’re out over their skis,” said Judith Enck, the president of Beyond Plastics and a former regional E.P.A. administrator. “Look behind the curtain, and these facilities aren’t operating at scale, and they aren’t environmentally sustainable,” she said.
The better solution, she said, would be, “We need to make less plastic.”
Touring the plant
Mr. Olson recently strolled through a cavernous warehouse at PureCycle’s Ironton site, built at a former Dow Chemical plant. Since January, he said, PureCycle has been processing mainly consumer plastic waste and has produced about 1.3 million pounds of recycled polypropylene, or about 1 percent of its annual production target.
“This is a bag that would hold dog food,” he said, pointing to a bale of woven plastic bags. “And these are fruit carts that you’d see in street markets. We can recycle all of that, which is pretty cool.”
The plant was dealing with a faulty valve discovered the day before, so no pellets were rolling off the line. Mr. Olson pulled out a cellphone to show a photo of a valve with a dark line ringing its interior. “It’s not supposed to look like that,” he said.
The company later sent video of Mr. Olson next to white pellets once again streaming out of its production line.
PureCycle says every kilogram of polypropylene it recycles emits about 1.54 kilograms of planet-warming carbon dioxide. That’s on par with a commonly used industry measure of emissions for virgin polypropylene. PureCycle said that it was improving on that measure.
Nestlé, L’Oréal and Procter & Gamble continue to say they’re optimistic about the technology. In November, Nestlé said it had invested in a British company that would more easily separate out polypropylene from other plastic waste.
It was “just one of the many steps we are taking on our journey to ensure our packaging doesn’t end up as waste,” the company said.
Hiroko Tabuchi covers the intersection of business and climate for The Times. She has been a journalist for more than 20 years in Tokyo and New York. More about Hiroko Tabuchi
Learn More About Climate Change
Have questions about climate change? Our F.A.Q. will tackle your climate questions, big and small .
“Buying Time,” a new series from The New York Times, looks at the risky ways humans are starting to manipulate nature to fight climate change.
Big brands like Procter & Gamble and Nestlé say a new generation of recycling plants will help them meet environmental goals, but the technology is struggling to deliver .
The Italian energy giant Eni sees future profits from collecting carbon dioxide and pumping it into natural gas fields that have been exhausted.
New satellite-based research reveals how land along the East Coast is slumping into the ocean, compounding the danger from global sea level rise . A major culprit: the overpumping of groundwater.
Did you know the ♻ symbol doesn’t mean something is actually recyclable ? Read on about how we got here, and what can be done.
Advertisement
Advertisement
Update on the clinical use of trabecular bone score (TBS) in the management of osteoporosis: results of an expert group meeting organized by the European Society for Clinical and Economic Aspects of Osteoporosis, Osteoarthritis and Musculoskeletal Diseases (ESCEO), and the International Osteoporosis Foundation (IOF) under the auspices of WHO Collaborating Center for Epidemiology of Musculoskeletal Health and Aging
- Position Paper
- Open access
- Published: 01 July 2023
- Volume 34 , pages 1501–1529, ( 2023 )
Cite this article
You have full access to this open access article
- Enisa Shevroja ORCID: orcid.org/0000-0001-6338-2948 1 ,
- Jean-Yves Reginster ORCID: orcid.org/0000-0001-6290-752X 2 , 3 ,
- Olivier Lamy ORCID: orcid.org/0000-0003-3684-2376 1 ,
- Nasser Al-Daghri ORCID: orcid.org/0000-0001-5472-1725 4 ,
- Manju Chandran 5 ,
- Anne-Laurence Demoux-Baiada ORCID: orcid.org/0000-0003-2616-839X 6 ,
- Lynn Kohlmeier 7 ,
- Marie-Paule Lecart 8 ,
- Daniel Messina ORCID: orcid.org/0000-0002-7987-854X 9 ,
- Bruno Muzzi Camargos ORCID: orcid.org/0000-0002-3132-6455 10 ,
- Juraj Payer ORCID: orcid.org/0000-0002-4977-6817 11 , 12 ,
- Sansin Tuzun ORCID: orcid.org/0000-0002-3300-2286 13 ,
- Nicola Veronese ORCID: orcid.org/0000-0002-9328-289X 14 ,
- Cyrus Cooper ORCID: orcid.org/0000-0003-3510-0709 15 , 16 , 17 ,
- Eugene V. McCloskey ORCID: orcid.org/0000-0003-0177-8140 18 , 19 &
- Nicholas C. Harvey ORCID: orcid.org/0000-0002-8194-2512 15 , 16
12k Accesses
15 Citations
87 Altmetric
10 Mentions
Explore all metrics
Trabecular bone score (TBS) is a grey-level textural measurement acquired from dual-energy X-ray absorptiometry lumbar spine images and is a validated index of bone microarchitecture. In 2015, a Working Group of the European Society on Clinical and Economic Aspects of Osteoporosis, Osteoarthritis and Musculoskeletal Diseases (ESCEO) published a review of the TBS literature, concluding that TBS predicts hip and major osteoporotic fracture, at least partly independent of bone mineral density (BMD) and clinical risk factors. It was also concluded that TBS is potentially amenable to change as a result of pharmacological therapy. Further evidence on the utility of TBS has since accumulated in both primary and secondary osteoporosis, and the introduction of FRAX and BMD T-score adjustment for TBS has accelerated adoption. This position paper therefore presents a review of the updated scientific literature and provides expert consensus statements and corresponding operational guidelines for the use of TBS.
An Expert Working Group was convened by the ESCEO and a systematic review of the evidence undertaken, with defined search strategies for four key topics with respect to the potential use of TBS: (1) fracture prediction in men and women; (2) initiating and monitoring treatment in postmenopausal osteoporosis; (3) fracture prediction in secondary osteoporosis; and (4) treatment monitoring in secondary osteoporosis. Statements to guide the clinical use of TBS were derived from the review and graded by consensus using the Grades of Recommendation, Assessment, Development and Evaluation (GRADE) approach.
A total of 96 articles were reviewed and included data on the use of TBS for fracture prediction in men and women, from over 20 countries. The updated evidence shows that TBS enhances fracture risk prediction in both primary and secondary osteoporosis, and can, when taken with BMD and clinical risk factors, inform treatment initiation and the choice of antiosteoporosis treatment. Evidence also indicates that TBS provides useful adjunctive information in monitoring treatment with long-term denosumab and anabolic agents. All expert consensus statements were voted as strongly recommended.
The addition of TBS assessment to FRAX and/or BMD enhances fracture risk prediction in primary and secondary osteoporosis, adding useful information for treatment decision-making and monitoring. The expert consensus statements provided in this paper can be used to guide the integration of TBS in clinical practice for the assessment and management of osteoporosis. An example of an operational approach is provided in the appendix.
This position paper presents an up-to-date review of the evidence base, synthesised through expert consensus statements, which informs the implementation of Trabecular Bone Score in clinical practice.
The clinician’s guide to prevention and treatment of osteoporosis
M. S. LeBoff, S. L. Greenspan, … E. S. Siris

The 2023 Guidelines for the management and treatment of glucocorticoid-induced osteoporosis
Yoshiya Tanaka, Satoshi Soen, … Seiji Fukumoto

UK clinical guideline for the prevention and treatment of osteoporosis
Celia L. Gregson, David J. Armstrong, … Juliet Compston
Avoid common mistakes on your manuscript.
Introduction
Osteoporosis is conceptually defined as a systemic skeletal disease characterized by low bone mass and deterioration of bone microarchitecture, leading to bone fragility and a consequent increase in fracture risk [ 1 , 2 ]. This definition encompasses the two pillars of bone resilience to fracture: bone mass (the amount of bone present) and bone microarchitecture (the material and organizational properties of bone). The densitometric assessment of osteoporosis is based on a bone mineral density (BMD) T-score of − 2.5 or less, which captures the bone mass element of fracture risk and is effective in identifying some, but not all individuals who go on to experience a fragility fracture [ 3 , 5 , 6 ]. An important clinical challenge is that most fragility fractures occur in individuals who have a BMD T-score in the osteopenic or normal range and therefore fall below the originally defined densitometric interventional threshold [ 3 , 4 , 5 , 6 ]. Ideally, the skeletal assessment of bone fragility should also capture bone microarchitecture as the second pillar of fracture resilience in order to improve the identification of individuals at high risk of fracture.
Trabecular bone score (TBS) is a grey-level textural measurement usually acquired from conventional lumbar spine dual-energy X-ray absorptiometry (DXA) BMD images, which provides a validated index of bone microarchitecture and correlates with mechanical properties of bone [ 7 , 8 , 9 , 10 , 11 , 12 ]. The score may be used as a continuous variable, by adjusting FRAX probability or BMD T-score, and has been interpreted clinically with cut-off values at thirds of the distribution [ 13 , 14 ]. In 2015, a review of the evidence for TBS in the assessment of osteoporosis was conducted by an Expert Working Group of the European Society on Clinical and Economic Aspects of Osteoporosis, Osteoarthritis and Musculoskeletal Diseases (ESCEO) [ 15 ]. The review concluded that TBS predicts hip and major osteoporotic fracture risk, at least partly independent of BMD and clinical risk factors and that TBS is potentially amenable to change as a result of pharmacological therapy [ 15 ]. Since then, the evidence base has rapidly expanded, with advances in the understanding of the role of TBS for fracture risk assessment in secondary as well as primary osteoporosis, for example in type 2 diabetes [ 16 , 17 , 18 ]. Evidence has also accumulated on the added value of TBS for decisions on treatment initiation and in understanding the effects of different antiosteoporosis therapies on bone microarchitecture in conjunction with known mechanisms of action [ 19 , 20 , 21 , 22 , 23 , 24 ]. It is estimated that over 2 million TBS assessments are performed annually (data extrapolated from Kanis et al., 2021) [ 25 ], with the clinical interpretation of results supported by FRAX® [ 13 , 26 ] and BMD T-score adjustments for TBS [ 14 ]. Given this rapid expansion of the scientific literature and the increasing clinical adoption of TBS, the ESCEO and International Osteoporosis Foundation (IOF) convened a Working Group to review the updated evidence base and provide guidance on the integration of TBS into clinical practice. The Appendix presents practical suggestions relating to clinical implementation and technical issues, derived from the Expert Working Group statements, technical information and clinical experience.
The international Expert Working Group included independent clinical scientists, physicians and researchers with expertise in the assessment, diagnosis and treatment of osteoporosis. Prior to the Working Group meeting, four topics were selected for review and systematic reviews of the evidence were undertaken: (1) use of TBS in fracture risk prediction; (2) use of TBS for treatment initiation and assessing response to pharmacological interventions in postmenopausal osteoporosis; (3) use of TBS for the assessment of fracture risk in secondary osteoporosis; and (4) use of TBS for assessing response to pharmacological therapies in secondary osteoporosis.
Systematic review search strategy
A comprehensive literature search was conducted using a similar approach to PRISMA guidelines, for articles published in MedLine via PubMed [ 27 ]. Fracture syntax (topics 1 and 3, Fig. 1 a) comprised ‘trabecular bone score’ OR ‘TBS’ [search term(Title/Abstract)], AND ‘fracture(s)’ [search term(Title/Abstract)]. Treatment syntax (topics 2 and 4, Fig. 1 b) comprised ‘trabecular bone score’ OR ‘TBS’ [search term(Title/Abstract)], AND ‘treatment(s)’ AND ‘effect’ [search term(Title/Abstract)], OR ‘therapy(ies)’ [search term(Title/Abstract)], OR ‘trial’ [search term(Title/Abstract)] AND ‘effect’ [search term(Title/Abstract)]. Articles were considered for review if they met the following general screening criteria: (i) an original, full-text study with TBS as a primary outcome, (ii) published or in-press (or known ‘accepted’ status and shared by a co-author) between March 2015 and 9 th February 2023, and (iii) available in the English language. Further eligibility criteria were specific to each of the four topics. A total of 96 papers were reviewed by 2 independent reviewers.

A PRISMA flow diagram of the literature search process for studies investigating trabecular bone score (TBS) and fracture prediction in primary and secondary osteoporosis. b PRISMA flow diagram of the literature search process for studies investigating trabecular bone score and treatment monitoring in postmenopausal and secondary osteoporosis
Expert consensus statements and operational guidelines
Expert consensus statements were developed in accordance with the Grades of Recommendation, Assessment, Development and Evaluation (GRADE) approach [ 28 ]. The GRADE approach is a widely used method for evaluating the quality of evidence and developing clinical recommendations. It provides a systematic and transparent process for assessing the certainty of the evidence, balancing the benefits and harms of interventions, and formulating recommendations. The GRADE approach involved several key steps:
Identifying the clinical questions: The first step involved defining the clinical questions regarding TBS, that the recommendations were to address. This included specifying the population and outcomes of interest.
Assessing the quality of evidence: the quality of evidence for each outcome was assessed using a systematic approach, with a defined study eligibility criteria, and considering methodological factors.
Rating the certainty of evidence: the certainty of evidence was characterized according to four levels: good, moderate, low, or very low. This rating reflects the confidence that the evidence accurately represented the true effect of TBS on a given outcome.
Formulating recommendations: a consensus process was followed to develop recommendations. The International Working Group, consisting of experts in the field, considered the quality and certainty of the evidence, the balance between benefits and harms, clinical experience, practical and resource implications, and other relevant factors.
Grading the strength of recommendations: a level of strength was assigned to each recommendation, indicating the extent to which the Working Group believes the benefits of the intervention outweigh the potential harms. Recommendations could be classified as either strong or weak.
The primary purpose of the GRADE approach is to help clinicians, researchers, and guideline developers make informed decisions based on the available evidence while considering various factors that may influence clinical practice. The process included a face-to-face meeting of the Working Group on 9 th February 2023 with presentations on each topic. Following the GRADE approach and based on the discussions and review outcomes, 22 corresponding statements were developed to inform guidance on the use of TBS in clinical practice. Thereafter, operational guidance to support the integration of TBS in clinical practice was developed.
Topic 1: Use of TBS in fracture risk prediction in postmenopausal and male osteoporosis
Eighteen studies met the eligibility criteria (prospective study design, conducted in men and/or women aged 40 years or over; Fig. 1 a). Of these, one study was conducted in Australia [ 29 ], five in Canada [ 14 , 30 , 31 , 32 , 33 ], two in China [ 34 , 35 ], two in Japan [ 36 , 37 ], one in Korea [ 38 ], one in Slovakia [ 39 ], three in Switzerland [ 40 , 41 , 42 ], one in Thailand [ 43 ], and two in the USA [ 44 , 45 ]. Cohort sizes from different ethnicities ranged from 115 to 45,185, and follow-up from 2.7 to 10 years. Ten studies were conducted in postmenopausal women, five in men, and three in both men and women, with mean age ranging from 58 to 76 years. The incident fracture rates for major osteoporotic fractures (MOF, including hip) ranged from 1.2 to 14%, and for vertebral fractures, 3.5 to 35% (Table 1 ). TBS was an independent predictor of incident fracture in 16 of 18 studies (Table 1 ). For each SD reduction in TBS, the increased risk of incident fracture ranged from 19% [ 14 ] to more than double [ 39 , 40 ]. The combination of TBS and BMD significantly enhanced the prediction of fracture risk compared to lumbar spine BMD in men and women [ 27 , 40 , 41 , 42 , 44 ], although, in one study, this was only significant in men [ 34 ].
TBS-adjusted FRAX
In 2016, a meta-analysis of 14 prospective population cohort studies showed that TBS is a significant predictor of fracture risk independent of FRAX and that the adjustment of FRAX for TBS resulted in a small but significant increase in fracture risk prediction, independent of gender and ethnicity [ 13 ]. The impact of TBS adjustment on FRAX probabilities is dependent on age, femoral neck BMD and the FRAX probability value [ 46 ]. Since 2016, four further prospective studies in women [ 14 , 30 , 37 , 41 ] and three in men [ 35 , 36 , 44 ] have since demonstrated that TBS combined with FRAX enhances the prediction of MOF, hip and vertebral fracture, compared with FRAX alone. Used together, the global assessment of fracture risk considers bone mass, bone microarchitecture and clinical risk factors (CRF). One recent study examined whether antiresorptive treatment affects fracture risk prediction from TBS using a large clinical registry ( n = 76,810) that includes all DXA tests for the Province of Manitoba, Canada. Results showed that TBS was a robust predictor of fracture in models adjusted for clinical risk factors and BMD and that the use of antiresorptive treatment (mostly bisphosphonates) either in the year before or following TBS measurement (mean total use, 5.6 years) did not attenuate fracture risk prediction [ 33 ].
Over a 10-year follow-up period in 1541 Japanese women (mean age 58 y) [ 37 ], every SD increase in TBS-adjusted FRAX score equated to a 46% increased risk of fracture (OR: 1.46, 95%CI 1.08, 1.98) compared to 35% with FRAX alone (OR: 1.35, 95%CI 1.09, 1.67). Similar results were found in the Fujiwara-Kyo Osteoporosis Risk in Men (FORMEN) study [ 36 ], and in Chinese men from the MrOs. Hong Kong cohort [ 35 ]. In the latter, when applying the Taiwan Intervention Strategy treatment threshold of 12.5% [ 47 ], TBS-adjusted FRAX improved the net risk classification by 5.2% compared to FRAX without TBS [ 35 ]. These findings are consistent with those in Caucasian men and women [ 44 , 48 , 49 ].
In 5863 men (mean age 73.7 y) from the MrOS cohort, over 8.6 years [ 44 ], TBS significantly predicted incident MOF and hip fracture, independent of FRAX with BMD, and prevalent radiographic vertebral fracture. For each SD reduction in TBS, there was a 27% (HR: 1.27, 95%CI 1.17, 1.39) and 20% (HR: 1.20, 95%CI 1.05, 1.39) greater risk of MOF and hip fracture, respectively. Using the 20% National Osteoporosis Foundation (NOF, now the Bone Health Osteoporosis Foundation, BHOF) treatment threshold, [ 50 ] the addition of TBS to FRAX also increased the Net Reclassification Index (NRI) by 3.3%, and with TBS, FRAX and prevalent radiographic vertebral fracture, the NRI increased further to 6.2%.
Similar results were found in 34,316 women from the Manitoba cohort (mean age 63.5 y), over 8.7 years [ 30 ]. The NRI with TBS-adjusted FRAX was computed using treatment thresholds from three clinical guidelines: Bone Health and Osteoporosis Foundation (BHOF) [ 50 ], Osteoporosis Canada [ 51 ] and the UK National Osteoporosis Guideline Group [ 52 ]. For all thresholds, the TBS adjustment had a positive effect in identifying fracture cases. In the overall group, TBS-adjusted FRAX yielded a small but significant increase in the NRI (NRI = 3.5% p = 0.002) compared with FRAX alone. Most reclassification occurred in individuals with a non-osteoporotic T-score (NRI = 3%), and there was also an age interaction, with reclassification more frequent in women under 65 years of age (NRI = 5.6%, p < 0.001). Consistent with findings elsewhere reporting up to 25% reclassification [ 14 , 48 , 49 , 53 ] and as expected, most reclassification (> 90%) occurred for women close to an intervention cut-off (range 9 to 17.9%), suggesting that the clinical utility of TBS (i.e. altering risk classification and hence intervention decisions) is particularly enhanced when targeted to this segment of the population.
TBS-adjusted BMD T-score
The adjustment of BMD T-score for TBS represents a clinically relevant advancement in the field, deriving from the analysis of the Manitoba cohort of 45,185 women (mean age 63.5 y) on GE DXA systems [ 14 ] and confirmed in the OsteoLaus cohort using a Hologic DXA system [ 54 ]. In the Manitoba cohort at follow-up (mean 7.4 y), 3925 of women (8.7%) had sustained at least one incident MOF, and 1040 (2.3%) had sustained at least one incident hip fracture [ 14 ]. Each SD decrease in TBS was significantly associated with a 26%, 25% and 22% greater risk of MOF in models incorporating BMD at the lumbar spine, femoral neck and total hip, respectively, and the results were not attenuated after adjustment for age and BMI. Using risk estimates from the Cox proportional hazards models, the authors applied a risk-equivalent offset adjustment to BMD T-scores to derive TBS-adjusted BMD T-scores for each site (spine, neck and total hip). There were significant improvements in fracture risk prediction using the TBS-adjusted BMD T-scores, compared to the unadjusted T-scores. Of relevance when FRAX is the primary approach, the study also confirmed the strong agreement in fracture probability scores between the TBS-adjusted FRAX tool, and when using TBS-adjusted femoral neck BMD T-score as the BMD input to FRAX ( r 2 = 0.98, slope = 1.02, intercept = − 0.3).
The combination of TBS with BMD for fracture prediction has been examined in the Swiss Evaluation of Methods of Measurement of Osteoporotic Fracture Risk (SEMOF) cohort study of 556 older women (mean age 76.1 y). Here, TBS significantly predicted incident fracture, independent of BMD (HR = 2.01, 95%CI 1.54, 2.63) [ 40 ]. The combination of TBS with lumbar spine BMD or the lowest BMD, significantly enhanced fracture prediction, with significantly different areas under the receiver operator curve (AUC) compared to models without TBS. Compared to osteoporosis (58%) or degraded TBS (60%) alone, the combination of osteoporosis and degraded TBS improved the classification of women with an osteoporotic fracture to 77%, confirming findings elsewhere in postmenopausal women [ 55 ] and non-osteoporotic patients [ 56 ]. Degraded TBS was categorized using data from a meta-analysis [ 13 ], where L1 to L4 TBS risk thresholds were established using a gender-independent tertile approach, with cut-off values for TBS of 1.23 and 1.31. Those with TBS values above 1.31 were characterised as being at low risk of fracture, those between 1.31 and 1.23 at intermediate risk and, finally, those below 1.23 at high risk of fracture. In subsequent studies, and in clinical usage, these tertiles have been termed normal TBS, partially degraded TBS and degraded TBS respectively.
Overall, whilst FRAX is widely available, and indeed is incorporated into over 100 guidelines internationally, some national guidelines predicate treatment on the basis of T-score rather than absolute fracture probability [ 57 ]. Furthermore, FRAX models are not available for all countries or territories. In these settings, the use of TBS-adjusted BMD T-score provides a practical method in which TBS information can be incorporated into risk assessment approaches.
Statements (GRADE outcome: strongly recommended)
The expert Working Group made the overall recommendation that TBS should be used in conjunction with BMD and clinical risk factors. Individual statements, all of which were strongly supported by the members of the Working Group, are itemized below:
TBS is predictive of fragility fractures in postmenopausal women and men above the age of 50 years.
TBS is predictive of fragility fractures independent of BMD and of clinical risk factors (including those in FRAX).
TBS adds predictive value when used in association with FRAX and BMD to adjust the FRAX probability of fracture in postmenopausal women and in men above the age of 50 years.
BMD adjusted for TBS is an alternative solution when FRAX is not available.
The greatest utility of TBS is for those individuals who lie close to a FRAX or BMD T-score intervention threshold.
TBS continues to add value to FRAX in patients previously receiving antiresorptive treatments.
Topic 2: Use of TBS for the initiation of treatment and monitoring of treatment effect in postmenopausal osteoporosis
Twenty studies met the eligibility criteria (prospective or intervention trial of an antiosteoporosis treatment in postmenopausal women, ≥ 6 months treatment duration; Fig. 1 b), and six were international multi-centre trials. Of those remaining, two were conducted in Canada, two in Japan, two in India, four in South Korea, one in Spain, one in Taiwan and two in the USA. Cohort sizes ranged from 28 to 6985 and treatment duration, from 6 months to 10 years. Studies included antiresorptive treatments anabolic treatments, and/or sequential treatment and/or treatment combinations (Table 2 ).
Antiresorptive agents
Antiresorptive treatment studies included bisphosphonates, menopausal hormone therapy (MHT), selective estrogen receptor modulators (SERMs) and denosumab (Table 3 ), which act in different ways to inhibit osteoclast activity [ 72 ], maintaining trabecular structure and increasing bone mass. Bisphosphonate treatment duration ranged from 12 to 49 months. Seven studies reported a preservation of TBS with bisphosphonates, SERMs and MHT [ 19 , 22 , 23 , 57 , 60 , 62 , 63 ] and three reported small, significant gains ranging from 0.7 to 1.4% over 12 months [ 57 , 59 , 71 ]. Seven reported significant gains in BMD, ranging from 1.5 to 4.9% over 12 months [ 19 , 22 , 57 , 59 , 60 , 62 , 63 ].
One recent study examined changes based on least significant change (LSC) in 6,985 adults (mean age 65 y, 94% women) treated primarily with bisphosphonates (78.3%), followed by SERMs (12%) then MHT (6.2%), over a mean treatment period of 38 months [ 69 ]. Consistent with findings from studies reporting on group mean treatment effects [ 18 , 22 , 57 , 59 , 60 , 61 , 62 ], the proportion of individuals with an increase in lumbar spine BMD (22%) and hip BMD (17.6%) was greater than those who had an increase in TBS (9.3%). The treatment effect on TBS was primarily one of preservation which aligns with the mechanisms of action (TBS: 76.9% within LSC, Table 2 ) [ 69 , 72 ]; indeed an increase in TBS would not necessarily be expected with antiresorptive treatment. An increase in TBS greater than the LSC should occasion consideration of potential technical factors, such as change in body weight, tissue thickness or scan mode, all of which also impact changes in BMD though to a somewhat lesser extent [ 69 ]. It is noteworthy that in the same study, 24.9% and 16.1% of patients had a decrease in hip and spine BMD which exceed LSC, which might also necessitate an investigation of clinical issues such as compliance or technical issues such as scan mode, weight change and DXA instrument.
Denosumab treatment durations ranged from 20 months to 10 years (Table 3 ). All studies reported significant increases in TBS with denosumab treatment, ranging from 0.4 to 1.8% /12 months, and increases in BMD ranging from 1.9 to 6%/12 months. One study included a comparison of TBS software versions for monitoring treatment with denosumab over 36 months [ 70 ]. Denosumab led to progressive increases in BMD and TBS over 36 months, with both TBS (version 3, BMI-adjusted) and TBS (version 4.0, tissue thickness adjusted) changes being significant compared to baseline and compared to placebo, from months 12 to 36 ( p < 0.001). The mean percent changes from baseline with TBS version 3.0 were 1.4%, 1.5% and 1.9%, at months 12, 24, and 36 respectively, while for TBS (version 4.0), the mean increases were slightly better at 2.3%, 2.6% and 3.3%, respectively [ 70 ]. In a further study, the efficacy of long-term denosumab therapy was investigated in 279 postmenopausal women who were randomized to either long-term denosumab treatment for 10 years or placebo for 36 months followed by denosumab for 7 years [ 24 ]. Consistent increases in TBS to 4.7% and in BMD to 22.4% were observed in women on long-term denosumab treatment. For women in the cross-over denosumab group, there were significant increases in TBS to 3.2% for seven years following treatment initiation, and in BMD, to 17.2%. At the individual level, denosumab treatment over 10 years resulted in a reduction in the proportion of women with degraded TBS (from 48.6 to 29.1%) and an increase in the proportion of women with normal TBS (26.1 to 53.2%). Similarly, there was a reduction in the proportion of women classified at high risk of fracture according to the combination of TBS and BMD T-score (from 94 to 40%) [ 24 ]. Furthermore, consistent with TBS as a predictor of fracture, women with the greatest improvements in TBS experienced fewer new fractures or worsening fractures across the trial duration [ 24 ].
Collectively, the evidence indicates that bisphosphonates, SERMs and MHT are unlikely to result in TBS change as they act primarily to preserve bone microarchitecture, as confirmed by histomorphometric analyses [ 72 , 73 ]. On the other hand, denosumab, a more potent antiresorptive agent [ 72 , 74 ] with a potential bone-forming effect [ 74 ], results in sustained, modest to large gains in TBS with extended treatment durations up to 10 years [ 24 ].
Anabolic agents
Anabolic treatments studied included parathyroid hormone (PTH) analogues which act by increasing bone formation and resorption, and romosozumab, which through a novel, dual mode of action, rapidly increases bone formation and reduces bone resorption [ 75 ]. In histomorphometric analyses, both classes of treatment have been shown to significantly improve trabecular microarchitecture and bone volume [ 76 , 77 ]. Eight studies included PTH/PTHrP analogues (teriparatide and/or abaloparatide) and demonstrated mean increases in TBS from 1.3 to 4.8%/12 months and increases in BMD ranged from 2.0 to 8.3%/12 months (Table 2 ).
In a multi-national randomized controlled trial (RCT), 109 postmenopausal women (mean age 61.5 y) received abaloparatide (20, 60 or 80ug) or 20 ug teriparatide over 6 months [ 66 ]. Rapid increases in TBS were observed in all treatment groups, with the greatest increases observed with the higher 80ug dose of abaloparatide (4.2%). At the individual level, 52% of women on abaloparatide (80ug) and 30% of women on teriparatide, had a TBS increase which exceeded LSC. With a longer intervention duration, the ACTIVE and ACTIVExtend RCT demonstrated a mean TBS increase of 4% over 18 months in 457 postmenopausal women treated with abaloparatide [ 23 ]. This increase was sustained to 4.4% at 43 months, and 50% of women had a positive change which exceeded LSC. There was also a reduction in the proportion of women with degraded TBS (from 40 to 24%) while there was no change in the TBS category for women in the placebo group (from 43 to 45%). In the same trial, compared to those not having an increase in TBS greater than LSC (3.8%), the odds ratio of sustaining a new vertebral fracture over 43 months was lower in those with a greater than LSC increase at 6 months (OR: 0.19, 95%CI 0.04, 0.8) and at 43 months (OR: 0.3, 95% CI 0.11,0.79) [ 23 ].
Romosozumab rapidly increased lumbar spine and hip BMD with an effect size greater than that observed with PTH/PTHrP analogues [ 76 ]. Treatment with romosozumab results in significant reductions in vertebral fracture and MOF risk [ 77 ] and medication has been recommended as the first line of treatment in patients with very high fracture risk [ 78 , 79 ]. Two studies have investigated the effect of romosozumab on TBS [ 22 , 71 ]. The first, in a small sample of 10 women (mean age 66 y), demonstrated a 2.5% mean increase in TBS and an 8.3% increase in lumbar spine BMD with 6 months of romosozumab treatment [ 22 ]. Conversely, in this study, there were no changes in TBS following 12 months of antiresorptive treatment [ 22 ]. In the ARCH multi-centre RCT, TBS measurements were available in 378 women (mean age 73 y, ~ 9.3% of the study population) randomized to receive either romozosumab or alendronate [ 71 ]. Over 12 months, mean TBS increased significantly by 5.1% in women treated with romosozumab, compared to no significant change (mean + 1.5%) in those treated with alendronate [ 69 ]. Furthermore, treatment with romosozumab led to a reduction in the proportion of women with degraded TBS (from 52.6 to 33%) and an increase in the proportion of women with normal TBS (28.9 to 48.1%). In women treated with alendronate only, there was a smaller reduction in the proportion of those with degraded TBS (from 60.6 to 51.6%) and a smaller increase in those with normal TBS (from 26.1 to 33%) [ 71 ].
Sequential osteoporosis treatment regimens
The long-term management of osteoporosis, particularly in patients at very high fracture risk, may necessitate sequential treatment [ 79 ]. Recent recommendations suggest that this may require an anabolic-first treatment regimen with a bone-forming agent (such as romosozumab or PTH, PTH/PTHrP-analogue) for 1–2 years, followed by an antiresorptive (such as a bisphosphonate or denosumab) for a further 5–10 years [ 80 ]. In the DATA-Switch open-label trial, postmenopausal women were allocated to sequential treatment comprising teriparatide to denosumab, or denosumab to teriparatide [ 21 ]. After 24 months, TBS gains were greater in the anabolic first group (2.7% versus 1.8%), and continued to increase for a further 24 months, following the treatment switch (5.1% versus 3.6%). In the ARCH multi-center trial, the 5.1% increase in TBS with romosozumab at 12 months was maintained to 4.8% with alendronate, for a further 24 months [ 71 ]. In a comparison group of women treated only with alendronate, gains in TBS were lower (1.5% at 12 months, 2.5% at 36 months). This approach may also be useful in patients whose very high risk of fracture is driven by reduced bone density and/or degraded bone microarchitecture.
TBS and treatment decision-making
The initiation of treatment is increasingly driven by fracture risk, which may be assessed by a variety of risk assessment modalities, depending on the availability of densitometry and FRAX, and on country or regional-specific guidance. European guidelines recommend FRAX-based approaches [ 81 , 82 ] with age-dependent intervention thresholds [ 83 ]. The adjustment of FRAX for TBS provides a global risk assessment based on bone mass and bone microarchitecture, plus clinical risk factors. Alternatively, the adjustment of the lowest BMD for TBS captures fracture risk associated with reduced bone mass and degraded bone microarchitecture, and the adjusted T-score may be entered into fracture risk calculators, such as the Garvan fracture risk calculator [ 84 ]. At the conceptual level, the information that TBS conveys regarding bone microarchitecture suggests that this measure, taken with BMD and CRFs, might contribute to decisions about specific treatment strategies. For example, on this basis, a treatment regimen might be chosen to either increase BMD and preserve bone microarchitecture, or to increase both BMD and bone microarchitecture, with consolidation thereafter. While a conceptually appealing mechanism by which treatment could be chosen according to individual patient characteristics, it clearly requires further evidential underpinning in order to properly inform this suggested approach.
As with BMD, the monitoring of treatment effect at the individual level should apply LSC based on centre-specific precision error and acquired in accordance with ISCD guidelines [ 85 ]. Few studies to date have reported on the proportion of study participants exceeding TBS or BMD LSC [ 19 , 20 , 23 , 66 ], and it is recommended that future studies include this data to enable interpretation of treatment effect at the individual level. Precision errors for TBS using Hologic or GE DXA systems and different TBS software versions, are comparable to BMD precision [ 84 ] and have ranged from 0.8 to 2.1%CV with equivalent LSC ranging from 2.2 to 5.8%. The average precision error and LSC from studies to date are 1.4%CV and 3.8% respectively [ 9 , 36 , 40 , 63 , 68 , 86 , 87 , 88 , 89 , 90 , 91 ]. The corresponding LSC unit change in TBS has been reported to be 0.05 based on a precision of 1.4%CV [ 85 ].
The expert Working Group members made the general recommendation that TBS results should be interpreted within the clinical context of the patient. Individual statements, all of which were strongly supported by the members of the Working Group, are itemized below:
Patients with low TBS who lie below but near the treatment threshold should be considered for an earlier assessment and lifestyle advice.
TBS with BMD and FRAX probability contributes to the stratification of antiosteoporosis therapy according to fracture risk, directing very high-risk patients to anabolic-first approaches.
TBS in conjunction with BMD, is useful for monitoring individual response to long-term denosumab treatment (5 years or more).
TBS in conjunction with BMD is useful for monitoring individual response to PTH/PTHrP-analogue treatments such as teriparatide and abaloparatide.
TBS in conjunction with BMD is useful for monitoring the individual response to romosozumab.
A decrease in TBS more than LSC during treatment should prompt further clinical review.
TBS contributes useful information in the assessment of treatment response for patients receiving bone-forming agents or long-term denosumab.
Topic 3: Use of TBS in the prediction of fracture risk associated with secondary osteoporosis
Consistent with the growing clinical and research interest in this area, in 2015, four studies with fracture outcomes in secondary osteoporosis were reviewed [ 15 ], whereas, in the current review, 40 studies (seven prospective) met the eligibility criteria (prospective, retrospective or cross-sectional studies, fracture as the primary outcome, in men and/or women aged ≥ 18 years). Of these, three were conducted in Australia, one in Brazil, four in Canada, sixteen in Europe, two in India, three in Japan, four in South East Asia, seven in South Korea; 27 studies included men and 36 included women. Incident fragility fracture rates ranged from 8 to 31% and for prevalent fracture, from 10 to 45% (Table Sb, supplementary information). As would be expected, studies were often smaller, and more frequently cross-sectional rather than prospective, compared with those of TBS in the context of primary osteoporosis and risk assessment.
Type 2 diabetes
Type 2 diabetes (T2D) is associated with an increased risk of bone fragility and fractures, although the underlying mechanisms are not fully understood. Individuals with T2D have a higher risk of fractures despite in some cases, having higher BMD than non-diabetic individuals. This paradoxical relationship between BMD and fracture risk suggests that other factors, such as impaired bone quality (for example greater heterogeneity of trabecular bone microarchitecture and increased cortical porosity) and altered material properties (as a consequence of protein glycation), may be implicated [ 92 , 93 , 94 , 95 ]. Indeed, previous studies have suggested that the altered trabecular microarchitecture is at least in part due to the accumulation of advanced glycation end products in bone tissue which increases the propensity to fracture [ 96 , 97 ]. Accordingly, the risk appears to be greater in patients who have poorer glycemic control [ 94 , 95 , 98 ]. In the current review, eight studies with cohort sizes between 169 and 44,503, investigated the use of TBS for the prediction of fragility fracture in T2D patients (Table Sb, supplementary information). In seven studies, TBS was related to fragility fracture risk independent of BMD [ 16 , 17 , 18 , 99 , 100 , 101 , 103 ] and three reported enhanced fracture risk prediction with TBS-adjusted FRAX compared to FRAX alone [ 16 , 99 , 100 ]. In 44,543 men and women (mean age 63.9 y) from the Manitoba cohort, 3,946 (9%) sustained an incident MOF over a mean follow-up of 8.3 years [ 99 ]. Individuals with T2D ( n = 4136) had significantly lower TBS but higher femoral neck BMD ( p < 0.05). Diabetes was also a significant predictor of incident fragility fracture risk, supporting findings from earlier studies in both sexes [ 94 , 95 ] and of microarchitectural deterioration in T2D-related skeletal fragility [ 100 ]. The adjustment of FRAX for TBS in the diabetes sub-group resulted in an overall NRI of 3.9% for incident MOF and 2.5% for hip fracture. Most reclassification was upward, based on a fixed intervention threshold of 20% for MOF and 3% for hip fracture [ 100 ].
Hypercortisolism and glucocorticoid-induced fracture risk
Six cross-sectional studies examined associations between TBS and prevalent or recent fragility fracture in patients with Cushing’s syndrome [ 104 ] or treated with corticosteroids [ 105 , 106 , 107 , 108 , 109 ]. All reported that TBS was associated with fracture, independent of BMD. In 182 men and women with Cushing’s syndrome (mean age 37.8 y; 45% fractured), there were no associations between BMD and fracture [ 104 ]. However, 84% of fractured patients had either degraded (50%) or partially degraded (34%) TBS (compared to 40% with low BMD), suggesting an important role for TBS-detected parameters including degraded trabecular architecture in the elevated fracture risk associated with endogenous overproduction of cortisol [ 104 ]. Comparable skeletal profiles have also been observed in patients receiving long-term corticosteroid treatment [ 108 , 109 ]. In 127 Spanish patients treated with corticosteroids (mean duration, 47.7 months), 27% had sustained a recent fragility fracture [ 108 ]. The skeletal profiles of patients with vertebral or non-vertebral fragility fracture were predominantly characterized by degraded TBS (76% and 69% respectively) rather than densitometric osteoporosis (38% and 36% respectively).
Chronic kidney disease
Seven studies met the inclusion criteria and investigated the use of TBS for predicting fracture in patients with chronic kidney disease (CKD) [ 110 , 111 , 112 , 113 , 114 , 115 , 116 ]. Five studies showed that TBS predicted incidents or were associated with a prevalent fragility fracture, independent of BMD [ 110 , 111 , 112 , 113 , 114 ]. Whilst CKD metabolic bone disease represents several different histomorphometric phenotypes, the search did not identify studies specifically addressing this point. In 1426 men and women (mean age 67 y), reduced kidney function was associated with significantly lower TBS and a higher probability of fracture (18% vs. 6%, p = 0.01) and low TBS predicted greater incidence of fragility fractures over 4.7 years, independent of BMD and CRFs [ 110 ]. Lower TBS also corresponds with increasing disease severity [ 111 , 112 ]. In hemodialysis patients (mean age 74 y), TBS and not BMD, was a significant, independent predictor of fracture [ 115 ]. Two studies did not report an association between TBS and fracture risk in CKD patients. First, a retrospective cohort study, found that neither TBS nor BMD were related to a history of fracture in men with moderate CKD (age 33 to 96 y) [ 113 ]. Second, in a prospective study of a modest sample of 59 CKD patients (mean age 68 y), FRAX-adjusted for TBS was higher in fracture compared to non-fracture cases (16.8% versus 10.6%), but the predictive model did not reach statistical significance [ 112 ].
Rheumatological conditions
Ten studies investigated TBS for fracture prediction/discrimination in rheumatological inflammatory conditions including rheumatoid arthritis [ 118 , 119 , 120 ], axial spondyloarthritis [ 121 ], ankylosing spondylitis [ 122 , 123 , 124 ], polymyalgia rheumatica [ 125 ], systemic lupus erythematosus [ 126 ] and systemic sclerosis [ 127 ]. The risk factors for skeletal fragility in these conditions include inflammatory disease mechanisms and cytokine-activation of bone resorption, in addition to the use of glucocorticoid and other immunosuppressive drugs, which are known to affect bone microarchitecture [ 128 ]. All studies showed that TBS was significantly associated with fracture, independent of BMD. In two studies of postmenopausal women with rheumatoid arthritis, TBS but not BMD was associated with a prevalent radiographic vertebral fracture [ 118 , 119 ], and adjustment of FRAX for TBS improved fracture risk prediction compared to FRAX alone [ 119 ]. In a separate study of 142 rheumatoid arthritis patients and 106 healthy controls, lower TBS was associated with vertebral fracture and of those with vertebral fracture, 26% had normal lumbar spine BMD and 12% had normal hip BMD [ 120 ].
Axial spondyloarthritis and ankylosing spondylitis are chronic inflammatory conditions that can lead to structural damage to bone tissue, degraded bone microarchitecture and increased fracture risk [ 129 ]. In all four studies reviewed, TBS was significantly associated with past or incident fracture [ 121 , 122 , 123 , 124 ], and in two studies femoral neck BMD, but not lumbar spine BMD, was lower in fracture cases [ 122 , 124 ]. In patients with axial spondylitis, those with fractures were more likely to have degraded TBS (29%) than low BMD (14%) [ 121 ]. It is also important to consider that lumbar spine BMD can be falsely elevated in degenerative noninflammatory arthropathy (due to sclerosis and osteophytes) and in certain inflammatory rheumatic diseases including ankylosing spondylitis (resulting from syndesmophyte formation). In a recent study of 63 spinal surgery patients, lumbar spine BMD was significantly increased with higher CT-derived degeneration scores ( p < 0.001) whereas TBS and CT Hounsfield unit measurements were unaffected [ 130 ]. In the case of a patient who may have degraded TBS and normal or increased lumbar spine BMD, careful scrutiny of the DXA image is recommended to ensure that no vertebrae are affected by spinal artefacts.
Other causes of secondary osteoporosis
Ten studies investigated other causes of secondary osteoporosis including acromegaly, cirrhosis, hyperparathyroidism, pulmonary disease, HIV infection, and thalassemia [ 131 , 132 , 133 , 134 , 135 , 136 , 137 , 138 , 139 , 140 ]. These studies tended to be small and cross-sectional in nature. In one study of 106 men and women with acromegaly (mean age 56 y), despite lower TBS in vertebral fracture cases (1.18 vs. 1.202, p < 0.05), TBS was not associated with prevalent vertebral fractures in a multivariate model [ 134 ]. In the other nine studies, TBS was associated with prevalent vertebral fractures, independent of BMD [ 131 , 132 , 133 , 135 , 137 , 138 , 139 , 140 ] or enhanced fracture prediction when combined with BMD [ 136 ]. In four of these studies, however, BMD did not differ between fracture and non-fracture cases [ 131 , 133 , 135 , 139 ].
Five studies examined TBS and hyperparathyroidism or hypoparathyroidism; conditions which are known to lead to alterations to trabecular bone microarchitecture [ 141 , 142 ]. In studies of patients with hyperparathyroidism or hypoparathyroidism, TBS was significantly lower in fracture compared to non-fracture cases [ 132 , 135 , 137 , 139 , 140 ]. In studies that examined the skeletal profiles of fracture cases, the prevalence of degraded TBS (35 to 57%) was greater than densitometric osteopenia or osteoporosis (11 to 21%) [ 137 , 139 ]. Similar skeletal profiles indicating a predominance of altered bone microarchitecture were also reported in chronic obstructive pulmonary disease [ 135 ] and thalassemia [ 136 ]. In patients with thalassemia, more fractured patients had degraded TBS (57%) than low BMD (20%) [ 136 ].
Reductions in TBS are observed in most secondary osteoporosis-related diseases.
TBS predicts fracture risk in type 2 diabetes, independently of BMD and FRAX probability.
TBS predicts fracture risk in chronic kidney disease, independently of BMD.
TBS predicts fracture risk in patients treated with glucocorticoid, independently of BMD.
TBS predicts fracture risk in rheumatological diseases, for example, rheumatoid arthritis, independently of BMD.
TBS is relatively unaffected by spinal changes such as osteophytes and syndesmophytes.
Topic 4: Use of TBS for treatment monitoring in secondary osteoporosis
Twenty-eight studies met the eligibility criteria (prospective, retrospective cohort or case–control cross-sectional design; treatments associated with secondary causes of osteoporosis, or antiosteoporosis therapies in secondary osteoporosis; men and/or women, age ≥ 18 years) and thirteen studies included men (Table 3 ). One study was conducted in China, one in Denmark, one in France, four in Italy, two in Japan, five in Korea, one in Norway, one in Poland, one in Slovakia, two in Spain, two in Switzerland, one in Taiwan and six in the USA. Fourteen studies investigated the effects of treatments associated with secondary osteoporosis, and fourteen investigated the efficacy of antiosteoporosis therapies (Table 3 ).
Aromatase inhibitors
Aromatase inhibitors (AI) are first-line therapies for reducing the risk of cancer recurrence in postmenopausal women with hormone-receptor-positive breast cancer, by inhibiting the conversion of androgens to estrogen. Given this mechanism of action, AI therapies accelerate bone turnover, increase bone resorption, reduce bone density and increase fragility fracture risk [ 143 ]. Four studies investigated the effect of AI therapy (duration from 18 to 48 months) on TBS in postmenopausal or early postmenopausal women with breast cancer [ 144 , 145 , 146 , 147 ]. Reductions in TBS ranged from − 0.5 to − 1.5%/12 months, with the greatest loss observed over 36 months (− 4.6%), unrelated to change in BMD [ 145 ]. In a retrospective, longitudinal study of 321 non-osteoporotic postmenopausal women with breast cancer (mean age 59 y), AI treatment for 3 years, negatively affected both BMD and TBS [ 147 ]. BMD significantly decreased by 6.1% and TBS by 2.1%, independent of BMD. The loss of TBS was more pronounced during the first year of treatment with a slowing thereafter, whereas the annual loss of BMD continued for up to 4 years.
Glucocorticoids
Prolonged use of glucocorticoids increases fracture risk [ 148 ]. Previous studies have demonstrated that glucocorticoids can weaken bone microarchitecture, for example, through a major loss of trabecular connectivity [ 149 , 150 ], with disease mechanisms involving increased osteoclastogenesis and apoptosis of osteoblasts and osteocytes [ 151 ]. Three studies investigated the effect of glucocorticoid treatment on TBS, and all reported significant reductions ranging from − 3 to − 10%/12 months, with decreases in BMD ranging from − 1.7 to 18%/12 months [ 152 , 153 , 154 ]. The largest reduction in TBS was reported in men and women (mean age 38 y) with rheumatoid arthritis, treated with high-dose compared to lose-dose glucocorticoids over 12 months (− 10% vs. − 1.7%) indicating that the magnitude of the effect is dependent on treatment dose regimen [ 153 ].
Antiosteoporosis treatments in patients with secondary osteoporosis
Ten studies investigated the effects of antiresorptive treatments and five examined anabolic treatments. Of these studies, five included men. Collectively, the effects of treatment on TBS and BMD (Table 3 ), were comparable to those observed in postmenopausal osteoporosis (Table 2 ), reflecting the drug mechanisms of action and duration of treatment.
Antiresorptive agents included bisphosphonates, denosumab and testosterone therapy. One placebo-controlled RCT examined the effect of 12 months testosterone therapy in 197 androgen-deficient men (mean age 54 y) [ 166 ]. No significant differences in TBS were reported between the treatment and placebo groups (1.6% vs. 1.4%), although a significant effect on QCT-derived BMD was observed. In studies of bisphosphonates, the treatment effect, as in postmenopausal women, was one of preservation with no significant changes in either direction reported [ 62 , 162 , 163 , 164 , 167 ]. One RCT over 24 months included 109 women with breast cancer and treated with AI, who received either 35 mg/week risedronate or a placebo [ 164 ]. A significant loss of TBS (− 2.4%) and BMD (− 1.7%) was demonstrated in women receiving the placebo, whereas in women treated with risedronate, there was no change in TBS and an increase in BMD (2.3%). Similar findings were reported in osteopenic/osteoporotic men and women with liver cirrhosis [ 162 ], in women with T2D [ 168 , 169 ], and in corticosteroid-treated women [ 167 ]. On the other hand, TBS significantly increased by 4% in CKD patients treated with denosumab over 12 months [ 165 ].
Studies of anabolic agents included PTH/PTHrP analogues [ 62 , 65 , 168 , 169 , 170 ] and one extension RCT investigated the effects of a sequential anabolic-first treatment regimen [ 169 ]. Overall, anabolic treatments led to increases in TBS ranging from 0.5 to 2.5%/12 months. In the largest RCT and part of the ACTIVE trial, 198 postmenopausal osteoporotic women with T2D received either 80ug abaloparatide, 20ug teriparatide or placebo over 18 months [ 168 ]. The largest increases in TBS and BMD were observed in the abaloparatide group (3.7% and 8.9% respectively) although gains with teriparatide were also significant (2.4% and 2.7% respectively). A separate RCT investigated the efficacy of teriparatide in glucocorticoid-treated women and reported significant increases in TBS of 3.7% and increases in BMD of 10.3% [ 167 ], whereas treatment with alendronate led to increases in BMD (5.5%) and no change in TBS. One study investigated sequential therapy in 32 premenopausal women (mean age 39 y) with severe idiopathic osteoporosis and a history of fragility fractures [ 169 ]. Teriparatide for 12 to 24 months, followed by 24 months of treatment with denosumab led to a sustained mean increase of 5.8% in TBS, comparable to findings in postmenopausal women [ 21 ].
TBS adds value when used with BMD in monitoring skeletal effects of aromatase inhibitors.
TBS adds value when used with BMD in monitoring skeletal effects of glucocorticoids.
Evidence supporting the use of TBS in monitoring response to antiosteoporosis therapy is applicable across both primary and secondary osteoporosis.
Ongoing developments and future research
Recent and ongoing developments in TBS software include the updated TBS algorithm (version 4) that accounts for soft tissue thickness, as an improvement on the current algorithm which estimates tissue thickness using body mass index as a surrogate (version 3.1.2). The updated algorithm has been shown to perform similarly to previous versions of TBS in the prediction of fragility fracture [ 41 ] and be equally or more effective when monitoring changes in TBS in response to antiresorptive and anabolic osteoporosis therapies [ 23 , 24 , 64 , 70 , 71 ]. Given the incorporation of soft tissue adjustment, there is further potential for application in pediatric populations [ 171 ], in patients undergoing significant weight change and in patients with very high or very low BMI [ 172 ], although further studies are required. There are also several recent studies that demonstrate the versatility and expansion of TBS to other skeletal regions including the hip [ 173 ], the distal femur following knee arthroplasty [ 174 ] and lateral vertebral fracture assessment [ 175 ]. Further research in these areas is encouraged.
Conclusions
Evidence supporting the added value of TBS in the assessment and management of osteoporosis has rapidly accumulated since 2015. Collectively, data indicate that TBS enhances fracture risk prediction in both primary and secondary osteoporosis, and across diverse races and ethnicities. Together with FRAX, the inclusion of TBS in conjunction with BMD can provide an improved global assessment of fracture risk, which takes into account the two pillars of fracture resistance (bone mass and bone microarchitecture) and CRFs. Where FRAX is not available, TBS alongside BMD provides a dual skeletal assessment of fracture risk, and the lowest BMD T-score-adjusted for TBS can be input into other fracture risk assessment tools. Limited data suggest that TBS is less influenced by degenerative and inflammatory spinal disease than DXA BMD. Furthermore, TBS has the potential to help inform treatment initiation and the choice of treatment in light of the overall skeletal profile of an individual patient, taking into account both BMD and bone microarchitecture. Including TBS in the monitoring of treatment may be useful for denosumab and anabolic agents, while with bisphosphonates, MHT and SERMs, evidence demonstrates that the effect is mostly one of preservation. The expert consensus statements and operational approach, provided in this paper, can be used to guide the integration of TBS in clinical practice for the assessment and management of osteoporosis.
Peck WA (1993) Consensus development conference: diagnosis, prophylaxis, and treatment of osteoporosis. Am J Med 94(6):646–650
Article Google Scholar
Kanis JA, McCloskey EV, Harvey NC, Johansson H, Leslie WD (2015) Intervention thresholds and the diagnosis of osteoporosis. J Bone Miner Res 30(10):1747–1753
Article PubMed Google Scholar
Siris ES, Miller PD, Barrett-Connor E, Faulkner KG, Wehren LE, Abbott TA, Berger ML, Santora AC, Sherwood LM (2001) Identification and fracture outcomes of undiagnosed low bone mineral density in postmenopausal women: results from the National Osteoporosis Risk Assessment. JAMA 286(22):2815–2822
Article CAS PubMed Google Scholar
Pasco JA, Seeman E, Henry MJ, Merriman EN, Nicholson GC, Kotowicz MA (2006) The population burden of fractures originates in women with osteopenia, not osteoporosis. Osteoporos Int 17:1404–1409
Sanders KM, Nicholson GC, Watts JJ, Pasco JA, Henry MJ, Kotowicz MA, Seeman E (2006) Half the burden of fragility fractures in the community occur in women without osteoporosis. When is fracture prevention cost-effective? Bone 38(5):694–700
Binkley N, Morin SN, Martineau P, Lix LM, Hans D, Leslie WD (2020) Frequency of normal bone measurement in postmenopausal women with fracture: a registry-based cohort study. Osteoporos Int 31:2337–2344
Pothuaud L, Carceller P, Hans D (2008) Correlations between grey-level variations in 2D projection images (TBS) and 3D microarchitecture: applications in the study of human trabecular bone microarchitecture. Bone 42(4):775–787
Pothuaud L, Barthe N, Krieg MA, Mehsen N, Carceller P, Hans D (2009) Evaluation of the potential use of trabecular bone score to complement bone mineral density in the diagnosis of osteoporosis: a preliminary spine bmd–matched, case-control study. J Clin Densitom 12(2):170–176
Hans D, Barthe N, Boutroy S, Pothuaud L, Winzenrieth R, Krieg MA (2011) Correlations between trabecular bone score, measured using anteroposterior dual-energy X-ray absorptiometry acquisition, and 3-dimensional parameters of bone microarchitecture: an experimental study on human cadaver vertebrae. J Clin Densitom 14(3):302–312
Winzenrieth R, Michelet F, Hans D (2013) Three-dimensional (3D) microarchitecture correlations with 2D projection image gray-level variations assessed by trabecular bone score using high-resolution computed tomographic acquisitions: effects of resolution and noise. J Clin Densitom 16(3):287–296
Muschitz C, Kocijan R, Haschka J, Pahr D, Kaider A, Pietschmann P, Hans D, Muschitz GK, Fahrleitner-Pammer A, Resch H (2015) TBS reflects trabecular microarchitecture in premenopausal women and men with idiopathic osteoporosis and low-traumatic fractures. Bone 79:259–266
Ramalho J, Marques IDB, Hans D, Dempster D, Zhou H, Patel P, Pereira RMR, Jorgetti V, Moyses RMA, Nickolas TL (2018) The trabecular bone score: Relationships with trabecular and cortical microarchitecture measured by HR-pQCT and histomorphometry in patients with chronic kidney disease. Bone 116:215–220
McCloskey EV, Odén A, Harvey NC, Leslie WD, Hans D, Johansson H, Barkmann R, Boutroy S, Brown J, Chapurlat R, Elders PJ (2016) A meta-analysis of trabecular bone score in fracture risk prediction and its relationship to FRAX. J Bone Miner Res 31(5):940–948
Leslie WD, Shevroja E, Johansson H, McCloskey EV, Harvey NC, Kanis JA, Hans D (2018) Risk-equivalent T-score adjustment for using lumbar spine trabecular bone score (TBS): the Manitoba BMD registry. Osteoporos Int 29:751–758
Article CAS PubMed PubMed Central Google Scholar
Harvey NC, Glüer CC, Binkley N, McCloskey EV, Brandi ML, Cooper C, Kendler D, Lamy O, Laslop A, Camargos BM, Reginster JY (2015) Trabecular bone score (TBS) as a new complementary approach for osteoporosis evaluation in clinical practice. Bone 78:216–224
Choi YJ, Ock SY, Chung YS (2016) Trabecular bone score (TBS) and TBS-adjusted fracture risk assessment tool are potential supplementary tools for the discrimination of morphometric vertebral fractures in postmenopausal women with type 2 diabetes. J Clin Densitom 19(4):507–514
Zhukouskaya VV, Ellen-Vainicher C, Gaudio A, Privitera F, Cairoli E, Ulivieri FM, Palmieri S, Morelli V, Grancini V, Orsi E, Masserini B (2016) The utility of lumbar spine trabecular bone score and femoral neck bone mineral density for identifying asymptomatic vertebral fractures in well-compensated type 2 diabetic patients. Osteoporos Int 27:49–56
Lin YC, Wu J, Kuo SF, Cheung YC, Sung CM, Fan CM, Chen FP, Mhuircheartaigh JN (2020) Vertebral fractures in type 2 diabetes patients: utility of trabecular bone score and relationship with serum bone turnover biomarkers. J Clin Densitom 23(1):37–43
Leslie WD, Majumdar SR, Morin SN, Hans D, Lix LM (2017) Change in trabecular bone score (TBS) with antiresorptive therapy does not predict fracture in women: the Manitoba BMD cohort. J Bone Miner Res 32(3):618–623
McClung MR, Lippuner K, Brandi ML, Zanchetta JR, Bone HG, Chapurlat R, Hans D, Wang A, Zapalowski C, Libanati C (2017) Effect of denosumab on trabecular bone score in postmenopausal women with osteoporosis. Osteoporos Int 28:2967–2973
Tsai JN, Jiang LA, Lee H, Hans D, Leder BZ (2017) Effects of teriparatide, denosumab, or both on spine trabecular microarchitecture in DATA-switch: a randomized controlled trial. J Clin Densitom 20(4):507–512
Article PubMed PubMed Central Google Scholar
Jeong C, Kim J, Lim Y, Ha J, Kang MI, Baek KH (2021) Effect of Romosozumab on Trabecular bone score compared to anti-resorptive agents in postmenopausal women with osteoporosis. Journal of bone metabolism 28(4):317
Cosman F, Hans D, Shevroja E, Mitlak Wang Y, B, (2023) Effect of abaloparatide on bone microarchitecture assessed by trabecular bone score in women with osteoporosis: post hoc analysis of ACTIVE and ACTIVExtend. J Bone Mineral Res 38(4):464–470
Article CAS Google Scholar
Hans D, McDermott M, Huang S, Kim M, Shevroja E, McClung M (2023) Long-term effect of denosumab on bone microarchitecture as assessed by tissue thickness–adjusted trabecular bone score in postmenopausal women with osteoporosis: results from FREEDOM and its open-label extension. Osteo Int 34(6):1075–1084
Kanis JA, Norton N, Harvey NC, Jacobson T, Johansson H, Lorentzon M, McCloskey EV, Willers C, Borgström F (2021) SCOPE 2021: a new scorecard for osteoporosis in Europe. Arch Osteoporos 16(1):82
Kanis JA, Harvey NC, Johansson H, Liu E, Vandenput L, Lorentzon M, Leslie WD, McCloskey EV (2020) A decade of FRAX: how has it changed the management of osteoporosis? Aging Clin Exp Res 32:187–196
Moher D, Liberati A, Tetzlaff J, Altman DG; PRISMA Group (2009) Preferred reporting items for systematic reviews and meta-analyses: the PRISMA statement. PLoS Med 21;6(7):e1000097
Andrews J, Guyatt G, Oxman AD, Alderson P, Dahm P, Falck-Ytter Y, Nasser M, Meerpohl J, Post PN, Kunz R, Brozek J (2013) GRADE guidelines: 14. Going from evidence to recommendations: the significance and presentation of recommendations. J Clin Epidemiol 66(7):719–725
Holloway KL, De Abreu LL, Hans D, Kotowicz MA, Sajjad MA, Hyde NK, Pasco JA (2018) Trabecular bone score in men and women with impaired fasting glucose and diabetes. Calcif Tissue Int 102:32–40
Martineau P, Leslie WD, Johansson H, Oden A, McCloskey EV, Hans D, Kanis JA (2017) Clinical utility of using lumbar spine trabecular bone score to adjust fracture probability: the Manitoba BMD cohort. J Bone Miner Res 32(7):1568–1574
Martineau P, Leslie WD, Johansson H, Harvey NC, McCloskey EV, Hans D, Kanis JA (2018) In which patients does lumbar spine trabecular bone score (TBS) have the largest effect? Bone 113:161–168
Li G, Leslie WD, Kovacs CS, Prior J, Josse RG, Towheed T, Davison KS, Thabane L, Papaioannou A, Levine MA, Goltzman D (2020) Combining frailty and trabecular bone score did not improve predictive accuracy in risk of major osteoporotic fractures. J Bone Miner Res 35(6):1058–1064
Leslie WD, Hans D, Silva BC (2023) Fracture prediction from trabecular bone score is unaffected by anti-resorptive treatment: a registry-based cohort study. J Clin Densitom 26(1):10–15
Su Y, Leung J, Hans D, Aubry-Rozier B, Kwok T (2017) Added clinical use of trabecular bone score to BMD for major osteoporotic fracture prediction in older Chinese people: the Mr. OS and Ms. OS cohort study in Hong Kong. Osteoporosis International 28:151–160
Su Y, Leung J, Hans D, Lamy O, Kwok T (2017) The added value of trabecular bone score to FRAX® to predict major osteoporotic fractures for clinical use in Chinese older people: the Mr. OS and Ms. OS cohort study in Hong Kong. Osteoporos Int 28:111–117
Iki M, Fujita Y, Tamaki J, Kouda K, Yura A, Sato Y, Moon JS, Winzenrieth R, Okamoto N, Kurumatani N (2015) Trabecular bone score may improve FRAX® prediction accuracy for major osteoporotic fractures in elderly Japanese men: the Fujiwara-kyo Osteoporosis Risk in Men (FORMEN) Cohort Study. Osteoporos Int 26:1841–1848
Tamaki J, Iki M, Sato Y, Winzenrieth R, Kajita E, Kagamimori S, for the JPOS Study Group (2019) Does Trabecular Bone Score (TBS) improve the predictive ability of FRAX® for major osteoporotic fractures according to the Japanese Population-Based Osteoporosis (JPOS) cohort study? J Bone Min Metabol 37:161–170
Kim H, Kim JH, Kim MJ, Hong AR, Choi H, Ku E, Lee JH, Shin CS, Cho NH (2020) Low predictive value of FRAX adjusted by trabecular bone score for osteoporotic fractures in korean women: a community-based cohort study. Endocrinol Metab 35(2):359–366
Kužma M, Hans D, Koller T, Némethová E, Jackuliak P, Killinger Z, Resch H, Payer J (2018) Less strict intervention thresholds for the FRAX and TBS-adjusted FRAX predict clinical fractures in osteopenic postmenopausal women with no prior fractures. J Bone Miner Metab 36:580–588
Popp AW, Meer S, Krieg MA, Perrelet R, Hans D, Lippuner K (2016) Bone mineral density (BMD) and vertebral trabecular bone score (TBS) for the identification of elderly women at high risk for fracture: the SEMOF cohort study. Eur Spine J 25:3432–3438
Shevroja E, Aubry-Rozier B, Hans G, Gonzalez-Rodriguez E, Stoll D, Lamy O, Hans D (2019) Clinical performance of the updated trabecular bone score (TBS) algorithm, which accounts for the soft tissue thickness: The OsteoLaus study. J Bone Min Res 34(12):2229–2237
Shevroja E, Mo Costabella F, Gonzalez Rodriguez E, Lamy O, Hans D (2022) The fracture predictive ability of lumbar spine BMD and TBS as calculated based on different combinations of the lumbar spine vertebrae. Archives Osteoporosis 17(1):83
Sakulpisuti C, Sritara C, Kositwattanarerk A, Fuangfa P, Suppasilp C, Vathesatogkit P, Matchariyakul D, Ongphiphadhanakul B, Sritara P (2022) Bone mineral density and trabecular bone score in predicting vertebral fractures in male employees of the electricity generating authority of Thailand. J Osteoporos. https://doi.org/10.1155/2022/6832166
Schousboe JT, Vo T, Taylor BC, Cawthon PM, Schwartz AV, Bauer DC, Orwoll ES, Lane NE, Barrett-Connor E, Ensrud KE, Osteoporotic Fractures in Men (MrOS) Study Research Group (2016) Prediction of incident major osteoporotic and hip fractures by trabecular bone score (TBS) and prevalent radiographic vertebral fracture in older men. J Bone Min Res 31(3):690–697
Schousboe JT, Vo TN, Langsetmo L, Taylor BC, Cawthon PM, Schwartz AV, Bauer DC, Orwoll ES, Lane NE, Barrett-Connor E, Ensrud KE (2017) Association of trabecular bone score (TBS) with incident clinical and radiographic vertebral fractures adjusted for lumbar spine BMD in older men: a prospective cohort study. J Bone Miner Res 32(7):1554–1558
McCloskey EV, Odén A, Harvey NC, Leslie WD, Hans D, Johansson H, Kanis JA (2015) Adjusting fracture probability by trabecular bone score. Calcif Tissue Int 96:500–509
Chan DC, McCloskey EV, Chang CB, Lin KP, Lim LC, Tsai KS, Yang RS (2017) Establishing and evaluating FRAX® probability thresholds in Taiwan. J Formos Med Assoc 116(3):161–168
Hans D, Goertzen AL, Krieg MA, Leslie WD (2011) Bone microarchitecture assessed by TBS predicts osteoporotic fractures independent of bone density: the Manitoba study. J Bone Miner Res 26(11):2762–2769
Leslie WD, Aubry-Rozier B, Lix LM, Morin SN, Majumdar SR, Hans D (2014) Spine bone texture assessed by trabecular bone score (TBS) predicts osteoporotic fractures in men: the Manitoba Bone Density Program. Bone 67:10–14
LeBoff MS, Greenspan SL, Insogna KL, Lewiecki EM, Saag KG, Singer AJ, Siris ES (2022) The clinician’s guide to prevention and treatment of osteoporosis. Osteoporos Int 33(10):2049–2102
Papaioannou A, Morin S, Cheung AM, Atkinson S, Brown JP, Feldman S, Hanley DA, Hodsman A, Jamal SA, Kaiser SM, Kvern B (2010) 2010 clinical practice guidelines for the diagnosis and management of osteoporosis in Canada: summary. CMAJ 182(17):1864–1873
Compston J, Bowring C, Cooper A, Cooper C, Davies C, Francis R, Kanis JA, Marsh D, McCloskey EV, Reid DM, Selby P (2013) Diagnosis and management of osteoporosis in postmenopausal women and older men in the UK: National Osteoporosis Guideline Group (NOGG) update 2013. Maturitas 75(4):392–396
Boutroy S, Hans D, Sornay-Rendu E, Vilayphiou N, Winzenrieth R, Chapurlat R (2013) Trabecular bone score improves fracture risk prediction in non-osteoporotic women: the OFELY study. Osteoporos Int 24:77–85
Shevroja E (2020) Trabecular Bone Score (TBS): the pathway from bone experiments to a validated clinical use. PhD Thesis – UNIL-CHUV. https://serval.unil.ch/en/notice/serval:BIB_55425DC59F33 . Accessed 12 Jan 2023
Briot K, Paternotte S, Kolta S, Eastell R, Reid DM, Felsenberg D, Glüer CC, Roux C (2013) Added value of trabecular bone score to bone mineral density for prediction of osteoporotic fractures in postmenopausal women: the OPUS study. Bone 57(1):232–236
Nassar K, Paternotte S, Kolta S, Fechtenbaum J, Roux C, Briot K (2014) Added value of trabecular bone score over bone mineral density for identification of vertebral fractures in patients with areal bone mineral density in the non-osteoporotic range. Osteoporos Int 25:243–249
Kanis JA, Harvey NC, Cooper C, Johansson H, Odén A, McCloskey EV, Advisory Board of the National Osteoporosis Guideline Group (2016) A systematic review of intervention thresholds based on FRAX: a report prepared for the National Osteoporosis Guideline Group and the International Osteoporosis Foundation. Archives Osteoporosis 11:1–48
Di Gregorio S, Del Rio L, Rodriguez-Tolra J, Bonel E, García M, Winzenrieth R (2015) Comparison between different bone treatments on areal bone mineral density (aBMD) and bone microarchitectural texture as assessed by the trabecular bone score (TBS). Bone 75:138–143
Shin MS, Cho EH, Kim HY (2017) Longitudinal change in trabecular bone score during and after treatment of osteoporosis in postmenopausal Korean women. Journal of Bone Metabolism 24(2):117–124
Sooragonda B, Cherian KE, Jebasingh FK, Dasgupta R, Asha HS, Kapoor N, Thomas N, Paul TV (2019) Longitudinal changes in bone mineral density and trabecular bone score following yearly zoledronic acid infusion in postmenopausal osteoporosis—a retrospective-prospective study from southern India. Arch Osteoporos 14:1–5
Miyaoka D, Imanishi Y, Ohara M, Hayashi N, Nagata Y, Yamada S, Mori K, Emoto M, Inaba M (2017) Effects of teriparatide and sequential minodronate on lumbar spine bone mineral density and microarchitecture in osteoporosis. Calcif Tissue Int 101:396–403
Kim J, Kim KM, Lim S, Kang MI, Baek KH, Min YK (2022) Efficacy of bisphosphonate therapy on postmenopausal osteoporotic women with and without diabetes: a prospective trial. BMC Endocr Disord 22(1):1–9
Kang T, Park SY, Lee SH, Park JH Suh SW (2022) Comparison of denosumab and zoledronic acid in postmenopausal women with osteoporosis: bone mineral density (BMD) and Trabecular Bone Score (TBS). J Korean Med Sci 37(13):e68
Hans D, McDermott M, Huang S, Kim M, Shevroja E, McClung M (2023) Long-term effect of denosumab on bone microarchitecture as assessed by tissue thickness-adjusted Trabecular Bone Score (TBS) in Postmenopausal Women with Osteoporosis: Results from the Freedom and Open-Label Extension (OLE). J Clin Densitom 25(2):272
Cipriani C, Pepe J, Silva BC, Rubin MR, Cusano NE, McMahon DJ, Nieddu L, Angelozzi M, Biamonte F, Diacinti D, Hans D (2018) Comparative effect of rhPTH (1–84) on bone mineral density and trabecular Bone score in hypoparathyroidism and postmenopausal osteoporosis. J Bone Miner Res 33(12):2132–2139
Bilezikian JP, Hattersley G, Fitzpatrick LA, Harris AG, Shevroja E, Banks K, Leder BZ, Zanchetta JR, Hans D (2018) Abaloparatide-SC improves trabecular microarchitecture as assessed by trabecular bone score (TBS): a 24-week randomized clinical trial. Osteoporos Int 29:323–328
Chen FP, Fu TS, Lin YC, Sung CM, Huang MH, Lin YJ (2022) Association between P1NP and bone strength in postmenopausal women treated with teriparatide. Taiwan J Obstet Gynecol 61(1):91–95
Sandeep NV, Joseph A, Cherian KE, Kapoor N, Paul TV (2022) Impact of teriparatide therapy in Indian postmenopausal women with osteoporosis with regard to DXA-derived parameters. Therapeutic Adv Endocrinol Metabol 13:20420188221112904
Leslie WD, Goel H, Binkley N, McCloskey EV, Hans D (2023) Contributions of clinical and technical factors to longitudinal change in trabecular bone score and bone density: a registry-based individual-level analysis. J Bone Miner Res 38:512–521
Hans D, Shevroja E, McDermott M, Huang S, Kim M, McClung M (2022) Updated trabecular bone score accounting for the soft tissue thickness (TBSTT) demonstrated significantly improved bone microstructure with denosumab in the FREEDOM TBS post hoc analysis. Osteoporos Int 33(12):2517–2525
McClung M, Betah D, Leder B, Kendler D, Oates M, Timoshanko J, and Wang Y (2022) Effect of romosozumab on bone microarchitecture as assessed by tissue thickness–adjusted trabecular bone score in postmenopausal women with osteoporosis: results from the ARCH study. https://eposters.asbmr.org/asbmr/2022/eposter/368700 . Accessed 12 Jan 2023
Baron R, Ferrari S, Russell RGG (2011) Denosumab and bisphosphonates: different mechanisms of action and effects. Bone 48(4):677–692
Moreira CA, Dempster DW (2017) Histomorphometric changes following treatment for osteoporosis. J Endocrinol Invest 40:895–897
Wang L, Huang B, Chen X, Su J (2020) New insight into unexpected bone formation by denosumab. Drug Discovery Today 25(11):1919–1922
Ferrari SL, Abrahamsen B, Napoli N, Akesson K, Chandran M, Eastell R, El-Hajj Fuleihan G, Josse R, Kendler D, Kraenzlin M, Suzuki A (2018) Diagnosis and management of bone fragility in diabetes: an emerging challenge. Osteoporos Int 29:2585–2596
Jiang Y, Zhao JJ, Mitlak BH, Wang O, Genant HK, Eriksen EF (2003) Recombinant human parathyroid hormone (1–34)[teriparatide] improves both cortical and cancellous bone structure. J Bone Miner Res 18(11):1932–1941
Chavassieux P, Chapurlat R, Portero-Muzy N, Roux JP, Garcia P, Brown JP, Libanati C, Boyce RW, Wang A, Grauer A (2019) Bone-forming and antiresorptive effects of romosozumab in postmenopausal women with osteoporosis: bone histomorphometry and microcomputed tomography analysis after 2 and 12 months of treatment. J Bone Miner Res 34(9):1597–1608
Genant HK, Engelke K, Bolognese MA, Mautalen C, Brown JP, Recknor C, Goemaere S, Fuerst T, Yang YC, Grauer A, Libanati C (2017) Effects of romosozumab compared with teriparatide on bone density and mass at the spine and hip in postmenopausal women with low bone mass. J Bone Miner Res 32(1):181–187
Kanis JA, Harvey NC, McCloskey E, Bruyère O, Veronese N, Lorentzon M, Cooper C, Rizzoli R, Adib G, Al-Daghri N, Campusano C (2020) Algorithm for the management of patients at low, high and very high risk of osteoporotic fractures. Osteoporos Int 31:1–12
Cosman F, Crittenden DB, Adachi JD, Binkley N, Czerwinski E, Ferrari S, Hofbauer LC, Lau E, Lewiecki EM, Miyauchi A, Zerbini CA (2016) Romosozumab treatment in postmenopausal women with osteoporosis. N Engl J Med 375(16):1532–1543
Curtis EM, Reginster JY, Al-Daghri N, Biver E, Brandi ML, Cavalier E, Hadji P, Halbout P, Harvey NC, Hiligsmann M, Javaid MK (2022) Management of patients at very high risk of osteoporotic fractures through sequential treatments. Aging Clin Exp Res 34(4):695–714
Kanis JA, Cooper C, Rizzoli R, Reginster JY, Scientific Advisory Board of the European Society for Clinical and Economic Aspects of Osteoporosis and Osteoarthritis (ESCEO) and the Committees of Scientific Advisors and National Societies of the International Osteoporosis Foundation (IOF) (2019) Executive summary of the European guidance for the diagnosis and management of osteoporosis in postmenopausal women. Calcified Tissue Int 104:235–238
Kanis JA, McCloskey EV, Harvey NC, Cooper C, Rizzoli R, Dawson-Hughes B, Maggi S, Reginster JY (2023) The need to distinguish intervention thresholds and diagnostic thresholds in the management of osteoporosis. Osteoporos Int 34(1):1–9
Nguyen ND, Frost SA, Center JR, Eisman JA, Nguyen TV (2008) Development of prognostic nomograms for individualizing 5-year and 10-year fracture risks. Osteoporos Int 19:1431–1444
Shepherd JA, Lu Y, Wilson K, Fuerst T, Genant H, Hangartner TN, Wilson C, Hans D, Leib ES (2006) Cross-calibration and minimum precision standards for dual-energy X-ray absorptiometry: the 2005 ISCD Official Positions. J Clin Densitom 9(1):31–36
Krueger D, Libber J, Binkley N (2015) Spine trabecular bone score precision, a comparison between GE lunar standard and high-resolution densitometers. J Clin Densitom 18(2):226–232
Bréban S, Briot K, Kolta S, Paternotte S, Ghazi M, Fechtenbaum J, Roux C (2012) Identification of rheumatoid arthritis patients with vertebral fractures using bone mineral density and trabecular bone score. J Clin Densitom 15(3):260–266
Dufour R, Winzenrieth R, Heraud A, Hans D, Mehsen N (2013) Generation and validation of a normative, age-specific reference curve for lumbar spine trabecular bone score (TBS) in French women. Osteoporosis International 24:2837–2846
Messina C, Buonomenna C, Menon G, Magnani S, Albano D, Gitto S, Ulivieri FM, Sconfienza LM (2019) Fat mass does not increase the precision error of trabecular bone score measurements. J Clin Densitom 22(3):359–366
Kang KY, Ju JH, Park SH, Hong YS (2020) Longitudinal association between trabecular bone loss and disease activity in axial spondyloarthritis: a 4-year prospective study. J Rheumatol 47(9):1330–1337
Guan WM, Pan W, Yu W, Cao W, Lin Q, Zhang ZZ, Song XJ, Li YL, Tian JP, Xu Y, Li TS (2021) Changes in trabecular bone score and bone mineral density in Chinese HIV-Infected individuals after one year of antiretroviral therapy. Journal of Orthopaedic Translation 29:72–77
Leslie WD, Aubry-Rozier B, Lamy O, Hans D (2013) TBS (trabecular bone score) and diabetes-related fracture risk. The J Clin Endocrinol Metabol 98(2):602–609
Carnevale V, Romagnoli E, D’Erasmo L, D’Erasmo E (2014) Bone damage in type 2 diabetes mellitus. Nutr Metab Cardiovasc Dis 24(11):1151–1157
Dhaliwal R, Cibula D, Ghosh C, Weinstock RS, Moses AM (2014) Bone quality assessment in type 2 diabetes mellitus. Osteoporosis International 25:1969–1973
Kim JH, Choi HJ, Ku EJ, Kim KM, Kim SW, Cho NH, Shin CS (2015) Trabecular bone score as an indicator for skeletal deterioration in diabetes. J Clin Endocrinol Metab 100(2):475–482
Vlassara H, Brownlee M, Cerami A (1988) Specific macrophage receptor activity for advanced glycosylation end products inversely correlates with insulin levels in vivo. Diabetes 37(4):456–461
Tang SY, Zeenath U, Vashishth D (2007) Effects of non-enzymatic glycation on cancellous bone fragility. Bone 40(4):1144–1151
Jackuliak P, Kužma M, Killinger Z, Payer J (2019) Good long-term glycemic compensation is associated with better trabecular bone score in postmenopausal women with type 2 diabetes. Physiol Res 30;68(Suppl 2):S149–S156
Bonaccorsi G, Fila E, Messina C, Maietti E, Ulivieri FM, Caudarella R, Greco P, Guglielmi G (2017) Comparison of trabecular bone score and hip structural analysis with FRAX® in postmenopausal women with type 2 diabetes mellitus. Aging Clin Experiment Res 29:951–957
Leslie WD, Johansson H, McCloskey EV, Harvey NC, Kanis JA, Hans D (2018) Comparison of methods for improving fracture risk assessment in diabetes: the Manitoba BMD Registry. J Bone Min Res 33(11):1923–1930
Yamamoto M, Yamauchi M, Sugimoto T (2019) Prevalent vertebral fracture is dominantly associated with spinal microstructural deterioration rather than bone mineral density in patients with type 2 diabetes mellitus. PLoS One 14(9):e0222571
Gani LU, Saripalli KR, Fernandes K, Leong SF, Tsai KT, Tan PT, Chong LR, King TF (2020) Bone mineral density and trabecular bone score in elderly type 2 diabetes Southeast Asian patients with severe osteoporotic hip fractures. PLoS ONE 15(11):e0241616
Paul J, Devarapalli V, Johnson JT, Cherian KE, Jebasingh FK, Asha HS, Kapoor N, Thomas N, Paul TV (2021) Do proximal hip geometry, trabecular microarchitecture, and prevalent vertebral fractures differ in postmenopausal women with type 2 diabetes mellitus? A cross-sectional study from a teaching hospital in southern India. Osteo Int 32(8):1585–1593
Belaya ZE, Hans D, Rozhinskaya LY, Dragunova NV, Sasonova NI, Solodovnikov AG, Tsoriev TT, Dzeranova LK, Melnichenko GA, Dedov II (2015) The risk factors for fractures and trabecular bone-score value in patients with endogenous Cushing’s syndrome. Arch Osteoporos 10:1–9
Paggiosi MA, Peel NFA, Eastell R (2015) The impact of glucocorticoid therapy on trabecular bone score in older women. Osteoporos Int 26:1773–1780
Kim D, Cho SK, Kim JY, Choi YY, Sung YK (2016) Association between trabecular bone score and risk factors for fractures in Korean female patients with rheumatoid arthritis. Modern Rheumatol 26(4):540–545
Florez H, Hernández-Rodríguez J, Muxi A, Carrasco JL, Prieto-González S, Cid MC, Espinosa G, Gómez-Puerta JA, Monegal A, Guañabens N, Peris P (2020) Trabecular bone score improves fracture risk assessment in glucocorticoid-induced osteoporosis. Rheumatology 59(7):1574–1580
Lee KA, Kim J, Kim HJ, Kim HS (2021) Discriminative ability of trabecular bone score over bone mineral density for vertebral and fragility fracture in patients treated with long-term and low-dose glucocorticoid. Int J Rheum Dis 24(8):1053–1060
Nowakowska-Płaza A, Wroński J, Sudoł-Szopińska I, Głuszko P (2021) Clinical utility of trabecular bone score (tbs) in fracture risk assessment of patients with rheumatic diseases treated with glucocorticoids. Horm Metab Res 53(08):499–503
Naylor KL, Prior J, Garg AX, Berger C, Langsetmo L, Adachi JD, Goltzman D, Kovacs CS, Josse RG, Leslie WD (2016) Trabecular bone score and incident fragility fracture risk in adults with reduced kidney function. Clin J Am Soc Nephrol 11(11):2032–2040
Aleksova J, Kurniawan S, Elder GJ (2018) The trabecular bone score is associated with bone mineral density, markers of bone turnover and prevalent fracture in patients with end stage kidney disease. Osteoporos Int 29:1447–1455
Brunerová L, Lažanská R, Kasalický P, Verešová J, Potočková J, Fialová A, Rychlík I (2018) Predictors of bone fractures in a single-centre cohort of hemodialysis patients: a 2-year follow-up study. Int Urol Nephrol 50:1721–1728
Holloway-Kew KL, Rufus-Membere P, Anderson KB, Betson A, Gaston J, Kotowicz MA, Diez-Perez A, Hyde NK, Pasco JA (2020) Bone material strength index is associated with prior fracture in men with and without moderate chronic kidney disease. Bone 133:115241
Rampersad C, Whitlock RH, Leslie WD, Rigatto C, Komenda P, Bohm C, Hans D, Tangri N (2020) Trabecular bone score in patients with chronic kidney disease. Osteoporosis International 31:1905–1912
Catalano A, Gaudio A, Bellone F, La Fauci MM, Xourafa A, Gembillo G, Basile G, Natale G, Squadrito G, Corica F, Morabito N (2022) Trabecular bone score and phalangeal quantitative ultrasound are associated with muscle strength and fracture risk in hemodialysis patients. Front Endoc. https://doi.org/10.3389/fendo.2022.940040
Malle O, Bergthaler M, Krisper P, Amrein K, Dimai HP, Kirsch AH, Rosenkranz AR, Pieber T, Obermayer-Pietsch B, Fahrleitner-Pammer A (2022) Usefulness of the trabecular bone score in maintenance dialysis patients: a single center observational study. Wien Klin Wochenschr 134(11–12):442–448
Yun HJ, Ryoo SR, Kim JE, Choi YJ, Park I, Shin GT, Kim H, Jeong JC (2020) Trabecular bone score may indicate chronic kidney disease-mineral and bone disorder (CKD-MBD) phenotypes in hemodialysis patients: a prospective observational study. BMC Nephrol 21:1–10
Kim D, Cho SK, Kim JY, Choi YY, Sung YK (2016) Association between trabecular bone score and risk factors for fractures in Korean female patients with rheumatoid arthritis. Mod Rheumatol 26(4):540–545
Choi YJ, Chung YS, Suh CH, Jung JY, Kim HA (2017) Trabecular bone score as a supplementary tool for the discrimination of osteoporotic fractures in postmenopausal women with rheumatoid arthritis. Medicine. https://doi.org/10.1097/MD.0000000000008661
Buehring B, Thomas J, Wittkämper T, Baraliakos X, Braun J (2020) Evaluation of the trabecular bone score (TBS) in routine clinical care of patients with inflammatory rheumatic and non-inflammatory diseases: correlation with conventional bone mineral density measurement and prevalence of vertebral fractures. Z Rheumatol 79:1067–1074
Kang KY, Kim IJ, Park SH, Hong YS (2018) Associations between trabecular bone score and vertebral fractures in patients with axial spondyloarthritis. Rheumatology 57(6):1033–1040
Richards C, Hans D, Leslie WD (2020) Trabecular bone score (TBS) predicts fracture in ankylosing spondylitis: the Manitoba BMD registry. J Clin Densitom 23(4):543–548
Killinger Z, Kužma M, Tomková S, Brazdilova K, Jackuliak P, Payer J (2021) Prediction of vertebral fractures by trabecular bone score in patients with ankylosing spondylitis. Physiol Res 70(Suppl 1):S53
Żuchowski P, Dura M, Jeka D, Waszczak-Jeka M (2022) The applicability of trabecular bone score for osteoporosis diagnosis in ankylosing spondylitis. Rheumatol Int 42(5):839–846
Kim HA, Lee HY, Jung JY, Suh CH, Chung YS, Choi YJ (2020) Trabecular bone score is a useful parameter for the prediction of vertebral fractures in patients with polymyalgia rheumatica. J Clin Densitomet 23(3):373–380
Lai EL, Huang WN, Chen HH, Chen JP, Chen DY, Hsieh TY, Hung WT, Lai KL, Lin CT, Tang KT, Chen YM (2020) Degraded microarchitecture by low trabecular bone score is associated with prevalent vertebral fractures in patients with systemic lupus erythematosus. Arch Osteoporos 15:1–7
Lee KA, Kim HJ, Kim HS (2023) Comparison of predictive value of FRAX, trabecular bone score, and bone mineral density for vertebral fractures in systemic sclerosis: a cross-sectional study. Medicine 102(2):e32580
El-Gazzar A, Högler W (2021) Mechanisms of bone fragility: from osteogenesis imperfecta to secondary osteoporosis. Int J Mol Sci 22(2):625
Cooper C, Melton 3rd LJ (1992) Vertebral fractures. BMJ: Brit Med J 20;304(6842):1634–1635
Hayden AC, Binkley N, Krueger D, Bernatz JT, Kadri A, Anderson PA (2022) Effect of degeneration on bone mineral density, trabecular bone score and CT Hounsfield unit measurements in a spine surgery patient population. Osteoporos Int 33(8):1775–1782
Ciullini L, Pennica A, Argento G, Novarini D, Teti E, Pugliese G, Aceti A, Conti FG (2018) Trabecular bone score (TBS) is associated with sub-clinical vertebral fractures in HIV-infected patients. J Bone Miner Metab 36:111–118
Grigorie D, Coles D, Sucaliuc A (2018) Trabecular bone score (TBS) has a poor discriminative power for vertebral fractures in 153 Romanian patients with primary hyperparathyroidism. Acta Endocrinologica (Bucharest) 14(2):208
Watanabe R, Tai N, Hirano J, Ban Y, Inoue D, Okazaki R (2018) Independent association of bone mineral density and trabecular bone score to vertebral fracture in male subjects with chronic obstructive pulmonary disease. Osteoporos Int 29:615–623
Kužma M, Vaňuga P, Ságová I, Pávai D, Jackuliak P, Killinger Z, Binkley NC, Winzenrieth R, Genant HK, Payer J (2019) Non-invasive DXA-derived bone structure assessment of acromegaly patients: a cross-sectional study. Eur J Endocrinol 180(3):201–211
Sakane EN, Vieira MCC, Lazaretti-Castro M, Maeda SS (2019) Predictors of poor bone microarchitecture assessed by trabecular bone score in postsurgical hypoparathyroidism. J Clin Endocrinol Metab 104(12):5795–5803
Teawtrakul N, Chukanhom S, Charoensri S, Somboonporn C Pongchaiyakul C (2020) The trabecular bone score as a predictor for Thalassemia-induced vertebral fractures in northeastern Thailand. Anemia 2020:4634709
Jones AR, Simons K, Harvey S, Grill V (2022) Bone mineral density compared to trabecular bone score in primary hyperparathyroidism. J Clin Med 11(2):330
Ogiso Y, Hanai T, Nishimura K, Miwa T, Maeda T, Imai K, Suetsugu A, Takai K, Shimizu M (2022) Usefulness of the trabecular bone score in assessing the risk of vertebral fractures in patients with cirrhosis. J Clin Med 11(6):1562
Saha S, Mannar V, Kandasamy D, Sreenivas V, Goswami R (2022) Vertebral fractures, trabecular bone score and their determinants in chronic hypoparathyroidism. J Endocrinol Invest 45(9):1777–1786
Vendrami C, Marques-Vidal P, Gonzalez Rodriguez E, Hans D, Waeber G, Lamy O (2022) Thyroid-stimulating hormone is associated with trabecular bone score and 5-year incident fracture risk in euthyroid postmenopausal women: the OsteoLaus cohort. Osteoporos Int 33:195–204
Rubin MR, Dempster DW, Kohler T, Stauber M, Zhou H, Shane E, Nickolas T, Stein E, Sliney J Jr, Silverberg SJ, Bilezikian JP (2010) Three dimensional cancellous bone structure in hypoparathyroidism. Bone 46(1):190–195
Stein EM, Silva BC, Boutroy S, Zhou B, Wang J, Udesky J, Zhang C, McMahon DJ, Romano M, Dworakowski E, Costa AG (2013) Primary hyperparathyroidism is associated with abnormal cortical and trabecular microstructure and reduced bone stiffness in postmenopausal women. J Bone Miner Res 28(5):1029–1040
Tseng OL, Spinelli JJ, Gotay CC, Ho WY, McBride ML, Dawes MG (2018) Aromatase inhibitors are associated with a higher fracture risk than tamoxifen: a systematic review and meta-analysis. Therapeutic advances in musculoskeletal disease 10(4):71–90
Pedrazzoni M, Casola A, Verzicco I, Abbate B, Vescovini R, Sansoni P (2014) Longitudinal changes of trabecular bone score after estrogen deprivation: effect of menopause and aromatase inhibition. J Endocrinol Invest 37:871–874
Mariotti V, Page DB, Davydov O, Hans D, Hudis CA, Patil S, Kunte S, Girotra M, Farooki A, Fornier MN (2017) Assessing fracture risk in early stage breast cancer patients treated with aromatase-inhibitors: an enhanced screening approach incorporating trabecular bone score. Journal of bone oncology 7:32–37
Hong AR, Kim JH, Lee KH, Kim TY, Im SA, Kim TY, Moon HG, Han WS, Noh DY, Kim SW, Shin CS (2017) Long-term effect of aromatase inhibitors on bone microarchitecture and macroarchitecture in non-osteoporotic postmenopausal women with breast cancer. Osteoporos Int 28:1413–1422
Catalano A, Gaudio A, Agostino RM, Morabito N, Bellone F, Lasco A (2019) Trabecular bone score and quantitative ultrasound measurements in the assessment of bone health in breast cancer survivors assuming aromatase inhibitors. J Endocrinol Invest 42:1337–1343
Messina OD, Vidal M, Torres JAM, Vidal LF, Arguissain C, Pereira RM, Clark P, Cerdas Perez S, Campusano C, Lazaretti-Castro M, Zerbini C, Scali JJ, Mendez Sanchez L, Peralta-Pedrero ML, Cavallo A, Valdivia Ibarra FJ, Hernandez Pérez T (2022) Evidence based Latin American guidelines of clinical practice on prevention, diagnosis, management and treatment of glucocorticoid induced osteoporosis. A 2022 update : this manuscript has been produced under the auspices of the Committee of National Societies (CNS) and the Committee of Scientific Advisors (CSA) of the International Osteoporosis Foundation (IOF). Aging Clin Exp Res 34(11):2591–2602
Chappard D, Legrand E, Basle MF, Fromont P, Racineux JL, Rebel A, Audran M (1996) Altered trabecular architecture induced by corticosteroids: a bone histomorphometric study. J Bone Miner Res 11(5):676–685
Carbonare LD, Arlot ME, Chavassieux PM, Roux JP, Portero NR, Meunier PJ (2001) Comparison of trabecular bone microarchitecture and remodeling in glucocorticoid-induced and postmenopausal osteoporosis. J Bone Miner Res 16(1):97–103
Adami G, Saag KG (2019) Glucocorticoid-induced osteoporosis: 2019 concise clinical review. Osteoporos Int 30:1145–1156
Chuang MH, Chuang TL, Koo M, Wang YF (2017) Trabecular bone score reflects trabecular microarchitecture deterioration and fragility fracture in female adult patients receiving glucocorticoid therapy: a pre-post controlled study. BioMed Res Int 2017:4210217
Corrado A, Rotondo C, Mele A, Cici D, Maruotti N, Sanpaolo E, Colia R, Cantatore FP (2021) Influence of glucocorticoid treatment on trabecular bone score and bone remodeling regulators in early rheumatoid arthritis. Arthritis Res Ther 23:1–9
Rymuza J, Pelewicz K, Przedlacki J, Miśkiewicz P (2022) Therapy with intravenous methylprednisolone pulses is associated with loss of bone microarchitecture in trabecular bone score-assessment among patients with moderate-to-severe graves’ orbitopathy: a pilot study. Front Endoc 13:893600
Killinger Z, Gajdarova L, Kuzma M, Krajcovicova A, Brazdilova K, Jackuliak P, Payer J (2019) Biologic treatment in comparison to methotrexate has positive effect on trabecular bone score in rheumatoid arthritis patients: 1-year follow-up. Acta Clin Belg 74(2):121–125
Ock SY, Chung YS, Choi YJ (2016) Changes in bone mineral density and trabecular bone score in Graves’ disease patients after anti-thyroid therapy. Osteoporosis and Sarcopenia 2(3):175–179
Godang K, Olarescu NC, Bollerslev J, Heck A (2016) Treatment of acromegaly increases BMD but reduces trabecular bone score: a longitudinal study. Eur J Endocrinol 175(2):155–164
Toussirot É, Mourot L, Dehecq B, Michel F, Wendling D, Grandclément É, Dumoulin G (2017) Paradoxical elevation of serum TRACP5b levels despite increase in lumbar spine bone mineral density during anti-TNFα therapy in patients with inflammatory rheumatic disease: a 2-year prospective assessment of bone mass, bone metabolism, and the trabecular bone score. Europ J Rheumatol 4(3):189
Nordklint AK, Almdal TP, Vestergaard P, Lundby-Christensen L, Boesgaard TW, Breum L, Gade-Rasmussen B, Sneppen SB, Gluud C, Hemmingsen B, Jensen T (2018) The effect of metformin versus placebo in combination with insulin analogues on bone mineral density and trabecular bone score in patients with type 2 diabetes mellitus: a randomized placebo-controlled trial. Osteoporos Int 29:2517–2526
Chung CW, Choi HS, Kong SH, Park YJ, Park DJ, Ahn HY, Cho SW (2021) Measurements of bone health after thyroid-stimulating suppression therapy in postmenopausal women with differentiated thyroid carcinoma: bone mineral density versus the trabecular bone score. J Clin Med 10(9):1964
Yokomoto-Umakoshi M, Umakoshi H, Sakamoto R, Fukumoto T, Ogata M, Nakano Y, Iwahashi N, Kaneko H, Mizoguchi N, Hattori A, Miyazawa T (2021) Role of deteriorated bone quality in the development of osteoporosis in pheochromocytoma and paraganglioma. Bone 142:115607
Librizzi MS, Guadalix S, Martínez-Díaz Guerra G, Allo G, Lora D, Jimenez C, Hawkins F (2016) Trabecular bone score in patients with liver transplants after 1 year of risedronate treatment. Transplant International 29(3):331–337
María RS, Marta PM, Sonia S, Natalia GG, Tamara M, Ignasi T, Maria MG, Jaime RM, Adolfo DP, Joan A, Xavier N (2016) TBS and BMD at the end of AI-therapy: A prospective study of the B-ABLE cohort. Bone 92:1–8
Prasad C, Greenspan SL, Vujevich KT, Brufsky A, Lembersky BC, Van Londen GJ, Jankowitz RC, Puhalla SL, Rastogi P, Perera S (2016) Risedronate may preserve bone microarchitecture in breast cancer survivors on aromatase inhibitors: a randomized, controlled clinical trial. Bone 90:123–126
Bonani M, Frey D, Graf N, Wüthrich RP (2019) Effect of denosumab on trabecular bone score in de novo kidney transplant recipients. Nephrol Dial Transplant 34(10):1773–1780
Cauley JA, Ellenberg SS, Schwartz AV, Ensrud KE, Keaveny TM, Snyder PJ (2021) Effect of testosterone treatment on the trabecular bone score in older men with low serum testosterone. Osteoporos Int 32(11):2371–2375
Saag KG, Agnusdei D, Hans D, Kohlmeier LA, Krohn KD, Leib ES, MacLaughlin EJ, Alam J, Simonelli C, Taylor KA, Marcus R (2016) Trabecular bone score in patients with chronic glucocorticoid therapy–induced osteoporosis treated with alendronate or teriparatide. Arthritis & Rheumatology 68(9):2122–2128
Dhaliwal R, Hans D, Hattersley G, Mitlak B, Fitzpatrick LA, Wang Y, Schwartz AV, Miller PD, Josse RG (2020) Abaloparatide in postmenopausal women with osteoporosis and type 2 diabetes: a post hoc analysis of the ACTIVE study. JBMR plus 4(4):e10346
Shane E, Shiau S, Recker RR, Lappe JM, Agarwal S, Kamanda-Kosseh M, Bucovsky M, Stubby J, Cohen A (2022) Denosumab after teriparatide in premenopausal women with idiopathic osteoporosis. J Clin Endocrinol Metab 107(4):e1528–e1540
Munekawa C, Hashimoto Y, Kitagawa N, Osaka T, Hamaguchi M, Fukui M (2022) Effect of teriparatide on bone mineral density and trabecular bone score in type 2 diabetic patients with osteoporosis: A retrospective cohort study. Medicina 58(4):481
Kalkwarf HJ, Shepherd JA, Hans D, Gonzalez Rodriguez E, Kindler JM, Lappe JM, Oberfield S, Winer KK, Zemel BS (2022) Trabecular bone score reference values for children and adolescents according to age, sex, and ancestry. J Bone Miner Res 37(4):776–785
Bonaccorsi G, Cafarelli FP, Cervellati C, De Guio F, Greco P, Giganti M, Guglielmi G (2020) A new corrective model to evaluate TBS in obese post-menopausal women: a cross-sectional study. Aging Clin Exp Res 32:1303–1308
Haeri NS, Perera S, Ferreiro I, Hans D, Greenspan SL (2022) Trabecular bone score in the hip: a new method to examine hip bone microarchitecture—a feasibility study. Arch Osteoporos 17(1):126
White R, Krueger D, De Guio F, Michelet F, Hans D, Anderson P, Binkley N (2021) An exploratory study of the texture research investigational platform (TRIP) to evaluate bone texture score of distal femur DXA scans–a TBS-based approach. J Clin Densitom 24(1):112–117
Shevroja E, White R, Lamy O, Krueger D, Hans D, Binkley N (2022) Bone texture assessment on lateral VFAs using the Texture Research Investigational Platform (TRIP) and its fracture discrimination ability. J Clin Densitom 25(4):599–605
Download references
Acknowledgements
We gratefully acknowledge information on technical considerations from Medimaps Group. The ESCEO Working Group was funded by the ESCEO. The ESCEO receives unrestricted educational grants to support its educational and scientific activities from non-governmental organisations, not-for-profit organisations, non-commercial or corporate partners. The choice of topics, participants, content and agenda of the Working Groups as well as the writing, editing, submission and reviewing of the manuscript are the sole responsibility of the ESCEO, without any influence from third parties.
Author information
Authors and affiliations.
Interdisciplinary Center for Bone Diseases, Lausanne University Hospital and University of Lausanne, 1011, Lausanne, Switzerland
Enisa Shevroja & Olivier Lamy
World Health Organization Collaborating Center for Epidemiology of Musculoskeletal Health and Aging, Liège, Belgium
Jean-Yves Reginster
Department of Public Health, Epidemiology and Health Economics, University of Liège, CHU Sart Tilman B23, 4000, Liège, Belgium
Biochemistry Department, College of Science, King Saud University, 11451, Riyadh, Kingdom of Saudi Arabia
Nasser Al-Daghri
Osteoporosis and Bone Metabolism Unit, Department of Endocrinology, Singapore General Hospital, ACADEMIA, 20, College Road, Singapore, 169856, Singapore
Manju Chandran
Service de Médecine Interne Et Gériatrie, CHU Nord Chemin Des Bourrely, Marseille, France
Anne-Laurence Demoux-Baiada
Spokane Strides for Strong Bones, Medical Director, West Coast Bone Health CME TeleECHO, Spokane, WA, USA
Lynn Kohlmeier
Faculty of Medicine, Quartier Hospital, Liège, Belgium
Marie-Paule Lecart
IRO Medical Research Center, Buenos Aires and Rheumatology Section, Cosme Argerich, Buenos Aires, Argentina
Daniel Messina
Rede Materdei de Saúde - Hospital Santo Agostinho - Densitometry Unit Coordinator, Belo Horizonte, Brazil
Bruno Muzzi Camargos
5th Department of Internal Medicine, Comenius University Faculty of Medicine, University Hospital, Bratislava, Slovakia
Juraj Payer
Ružinovská 6, 82101, Bratislava, Slovakia
Department of Physical Medicine and Rehabilitation, Cerrahpaşa School of Medicine, Istanbul University-Cerrahpaşa, Istanbul, Turkey
Sansin Tuzun
Department of Health Promotion, Mother and Child Care, Internal Medicine and Medical Specialties “G. D’Alessandro”, University of Palermo, 90127, Palermo, Italy
Nicola Veronese
MRC Lifecourse Epidemiology Centre, University of Southampton, Southampton, SO16 6YD, UK
Cyrus Cooper & Nicholas C. Harvey
NIHR Southampton Biomedical Research Centre, University of Southampton and University Hospital Southampton NHS Foundation Trust, Southampton, UK
NIHR Biomedical Research Centre, University of Oxford, Oxford, UK
Cyrus Cooper
Centre for Metabolic Bone Diseases, University of Sheffield, Sheffield, UK
Eugene V. McCloskey
MRC Versus Arthritis Centre for Integrated Research in Musculoskeletal Ageing, Mellanby Centre for Musculoskeletal Research, University of Sheffield, Sheffield, UK
You can also search for this author in PubMed Google Scholar
Corresponding author
Correspondence to Nicholas C. Harvey .
Ethics declarations
Consents and ethics approval.
This narrative article contains no original data and thus issues of ethics, informed consent and patient confidentiality do not apply.
Conflict of interest
J.Y.R. has received fees for lectures or advisory boards from IBSA-Genevrier, Mylan, Radius Health, Pierre Fabre, Faes Pharma, Rejuvinate Biomed, Teva, Theramex, Pfizer, Mithra Pharmaceuticals, CNIEL, Dairy Research Council, Nutricia, Danone and Agnovos, and industry grants (all through institution) from IBSA-Genevrier, Mylan, CNIEL, Radius Health and TRB, outside the submitted work.
C.C. reports personal fees from ABBH, Amgen, Eli Lilly, GSK, Medtronic, Merck, Novartis, Pfizer, Roche, Servier and Takeda, outside the submitted work.
N.C.H. reports personal fees, consultancy, lecture fees and honoraria from Alliance for Better Bone Health, AMGEN, MSD, Eli Lilly, UCB, Kyowa Kirin, Servier, Shire, Theramex, Consilient Healthcare and Internis Pharma, outside the submitted work.
L.K. reports lecture fees and honoraria from Alexion, Amgen, Ascendis, Medimaps (2 single presentations), and Radius, outside the submitted work.
E.V.M reports consultancy, advisory boards and or lecture fees from Amgen, AstraZeneca, Consilient Healthcare, Fresenius Kabi, GSK, Hologic, Internis, Lilly, ObsEva, Pfizer, UCB. Additional research support from Versus Arthritis, I3 Innovus, MRC and IOF.
N.V. reports personal fees from IBSA, Mylan, Viatris, Fidia, MSD outside of the submitted work.
N.A-D., D.M.C., M.C., A-L.D., O.L., D.M., J.P., M-P.L., S.T. declare no conflicts of interest.
Additional information
Publisher's note.
Springer Nature remains neutral with regard to jurisdictional claims in published maps and institutional affiliations.
Eugene V. McCloskey and Nicholas C. Harvey are joint senior authors.
Electronic supplementary material
Below is the link to the electronic supplementary material.
Supplementary file1 (DOCX 28 KB)
Appendix 1. operational considerations based on approved statements and expert opinion for the integration of tbs in clinical practice.
Trabecular bone score (TBS) is grey scale texture measure that correlates with bone microarchitecture, which can be used alongside FRAX and BMD to enhance the assessment of fracture risk and to inform treatment initiation and monitoring. The following guidance can be used to facilitate the integration of TBS in clinical practice in alignment with clinical workflow (see Appendix Fig. 2 ).

Integration of TBS into the clinical workflow
Indications for the use of TBS (adapted from ISCD, 2019; Kanis et al., 2019)
If FRAX (without BMD) indicates intermediate risk of fracture;
In women aged 65 years or over, and men aged 70 years or over, for routine bone health monitoring;
In women and men aged under 65 and 70 years respectively, TBS is recommended alongside BMD, if they have a risk factor for low bone mass such as low body weight, prior fracture, high-risk medication use, or a disease or condition associated with bone loss;
Adults with a fragility fracture;
Adults with a disease or condition associated with secondary osteoporosis;
Adults taking a medication associated with secondary osteoporosis;
Adults who are being considered for pharmacological treatment;
Adults receiving treatment, to monitor treatment effectiveness;
Adults not receiving osteoporosis treatment, when evidence of bone fragility would lead to treatment.
Image acquisition and quality assessment (technical considerations)
A DXA scanner calibration with a dedicated fractal phantom is required for TBS software installations and when there is a change in the DXA system, in order to clinically interpret the data;
When a DXA system is upgraded or replaced, it is strongly recommended that a new baseline TBS measurement is set for patients under treatment monitoring;
Change in scan mode may impact TBS outcomes. This can be mitigated by ensuring correct measurement and data entry of height and weight, and avoidance of change in scan mode for longitudinal monitoring, unless indicated by the DXA manufacturer;
Vertebrae affected by structural anomalies should be excluded from BMD analysis in accordance with ISCD protocol. Vertebrae excluded for BMD analysis are also excluded for TBS, e.g. sclerotic lesions, osteophytes, syndesmophytes, laminectomy and fracture;
Spinal degenerative changes minimally impact TBS, unlike BMD. As such, it is not unusual to observe discordance between spine TBS (lower) and BMD (higher);
If two or more vertebrae are excluded, neither BMD nor TBS can be used for diagnosis;
When a combination of vertebrae other than L1-L4 is used, combination-specific threshold adjustments are automatically applied in the current TBS iNsight version (3.1 and higher).
The currently available TBS software is valid for use in individuals within the BMI range of 15 to 37 kg.m −2 . Interpretation of TBS results outside of this range should be made with caution.
Bone health assessment
In the assessment of bone health, TBS can be used alongside BMD to provide additional information relating to bone microarchitecture;
The ‘Bone Resilience Index’ is an interpretive tool provided by the manufacturer, comprising combinations of categories of BMD (normal, osteopenic or osteoporosis) and TBS (normal, partially degraded or degraded);
Discordance between BMD and TBS (for example, normal BMD and degraded TBS), should prompt consideration of further clinical evaluation for possible causes of secondary osteoporosis;
Vertebral fracture assessment (VFA) should be considered for osteopenic patients with degraded TBS.
Fracture risk assessment
TBS can be used in the assessment of fracture risk using FRAX-adjusted for TBS directly OR indirectly by using the femoral neck BMD T-score-adjusted for TBS, but not both, to avoid over-adjustment for TBS;
FRAX-adjusted for TBS can be used to adjust the probability of MOF or hip fracture, for bone microarchitecture, in men and women aged 40 to 90 years. The adjusted FRAX probabilities can then be compared to local or national intervention thresholds;
In countries and regions where BMD T-score is the primary measure for assessment and reimbursement, BMD T-score-adjusted for TBS can be used;
BMD T-score-adjusted for TBS can be used in fracture prediction models other than FRAX;
The lowest adjusted T-score (lumbar spine, total hip or femoral neck) is used for diagnosis;
Other approaches might include BMD Z-score (age 20 to 49 years) and the risk threshold adjustment (or treatment threshold shift) referring to the lowest BMD T-score adjusted for TBS Z-score;
The selected approach should reflect patient age and country or region-specific guidelines.
Antiosteoporosis treatment initiation, decision-making and monitoring
FRAX-adjusted for TBS or BMD T-score adjusted for TBS can be used to inform treatment initiation, in conjunction with country or region-specific treatment intervention thresholds;
The greatest utility of either TBS adjustment is for individuals who are close to a FRAX or BMD T-score treatment intervention threshold;
Patients with low TBS who lie below but near the treatment threshold should be considered for an earlier assessment and lifestyle advice;
FRAX-adjusted for TBS can be used to guide the choice of anti-osteoporosis treatment in the framework of ESCEO-IOF recommendations on categorization to low, high or very high fracture risk (with the latter category directed to anabolic first regimens);
Since TBS captures elements of bone microarchitecture, conceptually, a low (degraded or partially degraded) TBS might support the use of treatments that impact both BMD and bone microarchitecture, for example, long-term denosumab or bone anabolic agents;
Conversely, bisphosphonates, SERMs and MHT might be considered if the treatment goal is preservation of TBS;
Least significant change (LSC) should be used to interpret treatment effect at the individual level, based on the center-specific precision error;
The average of published TBS precision errors and corresponding LSCs (Hologic and GE systems) are 1.37%CV and 3.79% respectively.
If a patient has a significant reduction (exceeding LSC) in TBS during treatment, consider causes of secondary osteoporosis and if an alternative treatment is required;
If a patient has a significant increase (exceeding LSC) in TBS and/or BMD during treatment while not expected given the given drugs and their associated mechanism of action, check for possible technical inaccuracies.
Rights and permissions
Open Access This article is licensed under a Creative Commons Attribution-NonCommercial 4.0 International License, which permits any non-commercial use, sharing, adaptation, distribution and reproduction in any medium or format, as long as you give appropriate credit to the original author(s) and the source, provide a link to the Creative Commons licence, and indicate if changes were made. The images or other third party material in this article are included in the article's Creative Commons licence, unless indicated otherwise in a credit line to the material. If material is not included in the article's Creative Commons licence and your intended use is not permitted by statutory regulation or exceeds the permitted use, you will need to obtain permission directly from the copyright holder. To view a copy of this licence, visit http://creativecommons.org/licenses/by-nc/4.0/ .
Reprints and permissions
About this article
Shevroja, E., Reginster, JY., Lamy, O. et al. Update on the clinical use of trabecular bone score (TBS) in the management of osteoporosis: results of an expert group meeting organized by the European Society for Clinical and Economic Aspects of Osteoporosis, Osteoarthritis and Musculoskeletal Diseases (ESCEO), and the International Osteoporosis Foundation (IOF) under the auspices of WHO Collaborating Center for Epidemiology of Musculoskeletal Health and Aging. Osteoporos Int 34 , 1501–1529 (2023). https://doi.org/10.1007/s00198-023-06817-4
Download citation
Received : 04 April 2023
Accepted : 31 May 2023
Published : 01 July 2023
Issue Date : September 2023
DOI : https://doi.org/10.1007/s00198-023-06817-4
Share this article
Anyone you share the following link with will be able to read this content:
Sorry, a shareable link is not currently available for this article.
Provided by the Springer Nature SharedIt content-sharing initiative
- Trabecular bone score
- Osteoporosis
- Find a journal
- Publish with us
- Track your research
We've detected unusual activity from your computer network
To continue, please click the box below to let us know you're not a robot.
Why did this happen?
Please make sure your browser supports JavaScript and cookies and that you are not blocking them from loading. For more information you can review our Terms of Service and Cookie Policy .
For inquiries related to this message please contact our support team and provide the reference ID below.
IMAGES
VIDEO
COMMENTS
CSEC. PastPapers. Subject Areas. About Us. More. Use tab to navigate through the menu items. About Us: We are a team of Caribbean students who wanted to support each other and the student community during the Covid-19 period. Our hope is that this website will be used to optimize your studies and improve your scores on the upcoming examinations.
definition of inflation, demand-pull inflation. diagram showing rising average price level due to an increase in AD. explanation that AD may increase because of a change in any of the determinants affecting component(s) of AD. examples of economies that have experienced demand-pull inflation.
Macroeconomics and Economic Pursuits Learn with flashcards, games, and more — for free. ... economics paper 1. 91 terms. hunkinchl0e. Preview. A Level Econ Key Terms 1.4. 5 terms. elizachesworth. Preview. carbon cycle case studies. 84 terms. Sofia_Goldblatt. Preview. Market failure A level economics. 41 terms. dal014.
Some relevant economic terms are defined. There is some knowledge of relevant economic theory. There are some errors. 3 . There is understanding of the specific demands of the question. 10-12 . Relevant economic terms are defined. Relevant economic theory is explained and applied.
Microeconomics. 1. (a) Explain the relationship between the law of diminishing returns and a firm's short-run cost curves. [10] Answers may include: definitions of the law of diminishing returns, short run, costs of production, cost curves.
Depending on the time of year, demand for a product may either rise or fall. To demonstrate, demand for Christmas trees may rise in December. Demand for ice cream may rise in the summer. What happens to the demand curve if there is a rise in population? Economics Paper 1 Revision Learn with flashcards, games, and more — for free.
Microeconomics. 1. (a) Explain why the price elasticity of demand for primary commodities is often relatively low while the price elasticity of demand for manufactured goods is often relatively high. Answers may include: definitions of PED, primary commodities, manufactured goods. diagram(s) to show low (inelastic) demand for primary ...
definition of merit goods, direct provision. diagram: use of any relevant diagram, set in context, such as MSB/C, maximum price or a subsidy diagram. explanation that direct provision could encourage greater consumption of merit goods. examples of direct provision of merit goods eg education, healthcare, public transport.
Relevant economic terms are used appropriately throughout the response. Where appropriate, relevant diagram(s) are included and fully explained. (b) Using real-world examples, discuss the impact of large firms having significant market power. Answers may include: Terminology: market power.
IBDP English Language & Literature. English Extended Essay Ideas. Comprehensive IB English SL. Boost your exam preparation with our IB Economics Paper 1 question bank. Practice real-world scenarios and excel in your assessment. Visit tychr.com today.
June 2020. Paper 1 (How markets work) Mark Scheme. Paper 2 (How the economy works) Mark Scheme. Exam paper questions organised by topic and difficulty. Our worksheets cover all topics from GCSE, IGCSE and A Level courses. Give them a try and see how you do!
The IB Economics Paper 1 Essay Structure. In the new syllabus (May 2022 exams onward) and get to choose 1 out of 3 questions, chosen from any of the 4 units. Paper 1 is worth 20% of your final for HL students and 30% for SL students. You'll get get 75 minutes (1 hour and 15 minutes).
Key Micro Diagrams for Economics Paper 1. Last updated 2 May 2022. Share : Here it is - the complete box set of 6 essential revision videos for all A-Level Economics students taking Paper 1.
Nail Your IB Economics Paper 1 with TutorsPlus. One more beneficial way to nail your IB Economics Paper 1 is to hire a tutor. Paper 1 is an essay meaning it requires more than knowledge of economic theory. You should also demonstrate independent research (real-life examples), adhesion to a certain structure, as well as a concise yet ...
Edexcel Economics Paper 1 - Preparing for the 2024 Paper. Geoff Riley. 12th March 2024. Share : In this revision video Geoff provides some advice on structuring answers and getting top marks - we also look at some topical issues ahead of the May 2024 Paper 1. If you have any questions, please do post them in the comments section of the video on ...
The Cambridge IGCSE Economics syllabus develops an understanding of economic terminology and principles and of basic economic theory. ... Past papers, examiner reports and specimen papers; Published resources; Economics (9-1) - 0987 Syllabus overview; Past papers, examiner reports and specimen papers ; Published resources ...
Cambridge IGCSE Economics (0455), Cambridge IGCSE Economics (0455) Past Papers, Cambridge IGCSE Economics (0455) Question Papers, Cambridge IGCSE Economics (0455) Marking Schemes, Cambridge IGCSE Economics (0455) Grade Thresholds . Resource Guide for File Naming System. Click the image to view.
University College London - BSc Economics. Private Tutor with 7 Years Experience supporting A Level & GCSE students in Maths and Economics. UCL Economics Graduate (2.1) £50 / hour. Graduate. Book Tutor. You can find summary notes and past papers for each of the modules and exam boards below.
1. (a) Explain two forms of government intervention in markets. Answers may include: Terminology: government intervention, markets. Theory: explanation of any two of the following forms of government intervention: price ceilings (maximum prices), price floors (minimum prices), indirect taxes, subsidies, direct provision of services, command and ...
Welcome to the GRADE 12 ECONOMICS Past Exam Paper Page. Here, you'll find a comprehensive range of grade 12 past year exam papers and memos, ranging from 2024 to as far back as 2009. ... Economics Question Paper 1, Paper 2, as well the Memorandum can easily be found on this page and We have it grouped by Year and Exam Semester.
Are you looking for past papers of A Levels Economics (9708)? GCE Guide provides you with the latest and most comprehensive collection of CAIE past papers for Cambridge O Level, Cambridge Int'l AS and A Level and Cambridge IGCSE subjects. Browse and download the papers by year, session and variant and ace your exams with confidence.
The above papers are labelled June 2020. Economics B (9EB0): Pearson Edexcel A-Level Past Papers November 2020. Paper 1: A-Level - Markets and how they Work (9EB0/01) Download Past Paper - Download Mark Scheme. Paper 2: A-Level - Competing in the Global Economy (9EB0/02) Download Past Paper - Download Mark Scheme.
Download past exam papers for A-Level Edexcel Economics: Paper 1 (Microeconomics) to prepare for your exams. A-Level Edexcel Economics: Paper 1 (Microeconomics) past papers are available to download for free from various exam boards and school boards including AQA, Edexcel, OCR and Eduqas (WJEC)
Economics document from Kahuta Institute of Professional Studies, Kahuta, 4 pages, 1 Micro Economics Paper Student's Name Instructor's Name Institutional Affiliation Course Date of Submission 2 The news article chosen for this analysis is titled "Why is there a shortage of semiconductors?" from The Economist, published on February 25,
Maddie McGarvey for The New York Times. By 2025, Nestle promises not to use any plastic in its products that isn't recyclable. By that same year, L'Oreal says all of its packaging will be ...
Purpose Trabecular bone score (TBS) is a grey-level textural measurement acquired from dual-energy X-ray absorptiometry lumbar spine images and is a validated index of bone microarchitecture. In 2015, a Working Group of the European Society on Clinical and Economic Aspects of Osteoporosis, Osteoarthritis and Musculoskeletal Diseases (ESCEO) published a review of the TBS literature, concluding ...
Traders Are Preparing for Stock Market Extremes. Investors who just booked profits from one of the strongest first quarters for the S&P 500 Index in decades are preparing for what comes next ...
The author of Rich Dad Poor Dad, Robert Kiyosaki, is back with more warnings about the risk of holding U.S. dollars, particularly for baby boomers as "paper assets crash."