- Affiliate Program

- UNITED STATES
- 台灣 (TAIWAN)
- TÜRKIYE (TURKEY)
- Academic Editing Services
- - Research Paper
- - Journal Manuscript
- - Dissertation
- - College & University Assignments
- Admissions Editing Services
- - Application Essay
- - Personal Statement
- - Recommendation Letter
- - Cover Letter
- - CV/Resume
- Business Editing Services
- - Business Documents
- - Report & Brochure
- - Website & Blog
- Writer Editing Services
- - Script & Screenplay
- Our Editors
- Client Reviews
- Editing & Proofreading Prices
- Wordvice Points
- Partner Discount
- Plagiarism Checker
- APA Citation Generator
- MLA Citation Generator
- Chicago Citation Generator
- Vancouver Citation Generator
- - APA Style
- - MLA Style
- - Chicago Style
- - Vancouver Style
- Writing & Editing Guide
- Academic Resources
- Admissions Resources

How to Write a Journal Article Introduction Section
Our journal manuscript series has covered the various sections of a scientific article according to the order in which we recommend you write them ( Figures , Methods section , Results section , Discussion section , and Conclusion section ). In this second-to-last installment, we’ll talk about the Introduction and how to draft it in a way that intrigues your readers and makes them want to continue reading. After all, the journal publications industry is a business, so editors won’t accept your article unless they’re confident their readership will be interested.
What is an Introduction in a research paper?
After the Abstract (the final section of the paper you should draft) and the visual aids, like figures, a reader’s first true interaction with your work is the Introduction . Thus, like any other story, you must set a compelling stage that invites your readers into your research world. Essentially, your Introduction will establish the foundation upon which your readers will approach your work . You lay down the rules of interpretation, and if your manuscript follows the tips we’ve given in this series, your readers should be able to logically apply those rules throughout all parts of your paper, including the conclusion in your Discussion section.
Before we examine what specifically belongs in this critical context-defining section of your manuscript, let’s explore a practical point about writing the Introduction.
When should I write the Introduction section?
You may recall that we recommended a particular order for drafting your manuscript—an order that suggests the Introduction should be written second to last. You may also remember we talked about how the Discussion (or the Conclusion section for journals that separate the Discussion and Conclusion) should answer the questions raised in the Introduction. So which is it? Write the Introduction first or the Discussion? Honestly, the Introduction should come second to last because it is one of the harder sections of the manuscript to nail correctly. Therefore, we recommend writing the Introduction in two stages.
Start with a skeletal Introduction that clearly states the hypothesis (the question your research answers). Then proceed with fully drafting the remaining parts of your manuscript, including analyzing your results in the Discussion and drawing rough conclusions that you will later refine. Once you’ve finished the other parts, return to your Introduction and incorporate the information we outline further below under the heading “What should I include in the Introduction?” After, modify the Discussion’s conclusion accordingly and polish the entire piece once again.
What to Include in the Introduction Section
Your paper must read like a chronological story ; it will begin with point A (the Introduction) and advance in time toward point B (the Discussion/Conclusion). If you recall from our prior article, the Discussion should answer the questions “why this particular study was needed to fill the gap in scientific knowledge we currently have and why that gap needed filling in the first place.” The Introduction answers similar but distinct questions. The context you establish in the Introduction must first identify that there is a knowledge gap and then explain how you intend to fill that gap and why .
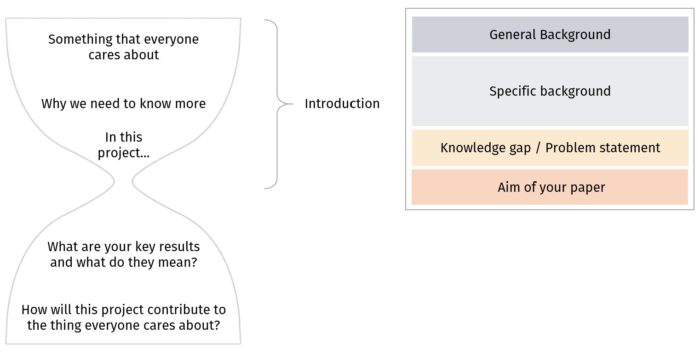
Imagine that your paper is an hourglass figure, as in the infographic below. Your Introduction holds the sand of knowledge that we currently have (the top bulb), and as the sand trickles through the neck (your research), it builds up a new base of knowledge (the bottom bulb). Thus your paper traces that journey from the top of the hourglass to the bottom, answering the questions in the infographic along the way. As a part of that journey, your Introduction is the starting point that answers the first three questions concisely.

As you can see from above, your Introduction should start broadly and narrow until it reaches your hypothesis. Now, let’s examine how we can achieve this flow of ideas more closely.
What is known about the current research topic?
- Start the Introduction with a strong statement that reflects your research subject area. Use keywords from your title to help you focus and avoid starting too broadly .
- Avoid stating too many obvious facts that your target readers would know . You should be precise about the area of focus so that readers can properly orient themselves before diving into your paper.
- As a trick to help you combat too broad a start, write down your hypothesis or purpose first .
- Then work backward to think about what background information your reader needs to appreciate the significance of your study.
- Stop going back when you reach the point where your readers would be comfortable understanding the statements you make but might not be fully confident to explain all the aspects of those facts.
- Cite relevant, up-to-date primary literature to support your explanation of our current base of knowledge . Make sure to include any significant works that might contradict your argument and address the flaws with that opposing line of thought. You want your readers to conclude that your approach is more plausible than alternative theories.
- Be sure to cite your sources . Plagiarism is a serious offense in the academic community that will hurt your credibility (not to mention it is a violation of many copyright laws). Direct copying or a closely matched language should be avoided. Instead, be sure to use your own words to rephrase what you read in the literature and include references.
- Remember that the Introduction is not meant to be a comprehensive literature review ! Don’t overwhelm your reader with a sea of citations. Instead, use key primary literature (i.e., journal articles) to quickly guide your reader from the general study area to more specific material covered by your hypothesis. In other words, the literature you cite should logically lead your reader to develop the same questions that prompted you to do your research project. Roughly a half page should suffice, but double-check with your target journal’s information for authors.
What is the gap in knowledge?
- As you describe our understanding of the relevant subject matter, highlight areas where too little information is available . However, don’t stop at saying “little is known about…” You must elaborate and tell your readers why we should care about unearthing additional information about this knowledge gap. See the subheading “How and why should we fill that gap?” for further details.
- Alternatively, your Introduction should identify what logical next steps can be developed based on existing research . After all, the purpose of sharing research is to prompt other researchers to develop new inquiries and improve our comprehension of a particular issue. By showing you have examined current data and devised a method to find new applications and make new inferences, you’re showing your peers that you are aware of the direction your field is moving in and confident in your decision to pursue the study contemplated by your paper.
How should we fill that knowledge gap?
- State your purpose/hypothesis clearly . Surprisingly, many people actually forget to do so! If all else fails, a simple “The purpose of this study was to examine/study X” will suffice.
- You are proposing a solution to a problem (the gap) you observed in our current knowledge base. As such, your Introduction must convince your readers that this problem needs solving .
- In particular, since we are writing with a particular journal’s readership in mind (or, at least, you should be!), make sure to address how pertinent your project would be to the reader’s interests.
- In other words, if we fill this gap, what useful information will the readers gain ? The answer to that question is the promise you are delivering to your readers, and in the conclusion part of your Discussion, you will give final confirmation of your findings and elaborate more on what your readers can now do with the information your project has contributed to the research community.
- DON’T draw any conclusions or include any data from your study . Those aspects belong in other parts of your paper.
- Similarly , DON’T talk about specific techniques in your Introduction because your readers ought to be familiar with most of them. If you employed a novel technique in your study, and the development of that process is central to your study, then, by all means, include a brief overview.
How to Write the Introduction Section
To round out our guide to drafting the Introduction of your journal article, we provide some general tips about the technical aspects of writing the Introduction section below.
- Use the active voice.
- Be concise.
- Avoid nominalizations (converting phrases, including adjectives and verbs, into nouns). Instead, use the verb form where practical. When you eliminate nominalizations, your sentences will shorten, you’ll maintain an active voice, and your sentences will flow more like natural speech.
- Do you see those uber long sentences in your draft? Revise them. Anything longer than three to four lines is absurd, and even sentences of that length should be rare. Shorter sentences are clearer, making it easier for your readers to follow your arguments. With that said, don’t condense every sentence. Incorporate a variety of sentence structures and lengths.
- Similarly, drop the extended sentences with semicolons and serial clauses connected by commas. Again, the purpose of your paper is to provide a CLEAR explanation of your findings.
- Avoid overusing first-person pronouns. Use them rarely at the beginning of the section and sprinkle them toward the end when you discuss your hypothesis and the rationale behind your study.
- Organize your thoughts from broad to specific (as described in the section “What should I include in the Introduction” above).
- BONUS TIP #1: Like any other type of writing, start your Introduction with an active hook . Writing a summary of your findings shouldn’t be boring. In fact, a dull start will make your readers stop long before they get to the good stuff—your results and discussion! So how do you make an exciting hook? Think about techniques in creative nonfiction like starting with a provoking anecdote, quote or striking piece of empirical data. You’re telling a story, after all, so make it enjoyable!
- BONUS TIP #2: As one author, reviewer, and editor once stated , your Introduction should avoid using phrases like “novel,” “first ever,” and “paradigm-changing.” Your project might not be paradigm-shifting (few studies truly are); however, if your idea isn’t novel in the first instance, then should you be writing the paper now? If you don’t feel like your research would make a meaningful contribution to current knowledge, then you might want to consider conducting further research before approaching the drafting table.
And keep in mind that receiving English proofreading and paper editing services for your manuscript before submission to journals greatly increases your chances of publication. Wordvice provides high-quality professional editing for all types of academic documents and includes a free certificate of editing .
You can also find these resources plus information about the journal submission process in our FREE downloadable e-book: Research Writing and Journal Publication E-Book .
Wordvice Resources
- How to Write a Research Paper Introduction
- Which Verb Tenses to Use in a Research Paper
- How to Write an Abstract for a Research Paper
- How to Write a Research Paper Title
- Useful Phrases for Academic Writing
- Common Transition Terms in Academic Papers
- Active and Passive Voice in Research Papers
- 100+ Verbs That Will Make Your Research Writing Amazing
- Tips for Paraphrasing in R esearch Papers
Additional Resources
- Guide for Authors. (Elsevier)
- How to Write the Results Section of a Research Paper. (Bates College)
- Structure of a Research Paper. (University of Minnesota Biomedical Library)
- How to Choose a Target Journal (Springer)
- How to Write Figures and Tables (UNC Writing Center)
Orsuamaeze Blessings, Adebayo Alaba Joseph and Oguntimehin Ilemobayo Ifedayo, 2018. Deleterious effects of cadmium solutions on onion (Allium cepa) growth and the plant’s potential as bioindicator of Cd exposure. Res. J. Environ. Sci., 12: 114-120. Online: http://docsdrive.com/pdfs/academicjournals/rjes/2018/114-120.pdf
Journal Article: Introduction
Your paper’s Introduction section should provide your readers with the information they need to grasp, appreciate, and build on the knowledge you present. Despite audience-dependent variations , the Introduction generally follows a four-part structure that sets the stage for the core of the paper. Check out annotated examples at the end to see how different authors have introduced their work.
1. Before you start
1.1. identify your purpose.
The Introduction provides your audience with the background information necessary to understand the work you’re presenting in the article, and the reasons why you conducted your work . Therefore, clarify for yourself what problem you’re addressing and why your work is important.
1.2. Analyze your audience
Scientists in your specific field will probably understand your work’s motivation whether they read your Introduction or not. They might even skip the Introduction and focus on the Methods and Results. Outsiders are the people who will benefit most from a well-crafted Introduction. This is an opportunity for you to broaden their background knowledge and close the gap in technical knowledge.
Analyze papers from your target journal and follow the journal’s guidelines. This will inform the appropriate length and breadth for your Introduction, as well as the content needed to help your readers follow along. Let’s say you are writing a paper about CFD simulation in nuclear fission reactor. You can assume that readers of Physics of Fluids are interested in developments in fluid mechanics, but may not know much about reactor design. For other journals such as Nuclear Engineering and Design , readers will be nuclear science insiders.
If you are writing for a general audience, your Introduction will start with some broad, motivating background and fewer technical details. Below are excerpts from two journals articles. Although they describe the same research project, one is intended for a general audience (left) whereas the other is directed at scientists with previous knowledge on the topic (right).

Return to Contents
2. Writing your Introduction
Regardless of length, an effective Introduction resembles the first half of an abstract . Just like an abstract, one way to remember the different components is to visualize an hourglass: start with a broad opening and lead your reader toward the core of your paper.
Here is an example illustrating our four-part structure (see more examples below).
2.1. General background: A broad opening
The general background should demarcate the overall scientific setting of your work. Start with a general topic that everyone in your audience cares about. Note that the general background should give your audience a sense of what to expect from your paper, not an overview of the history of a field. Introduce only necessary background that is related to your work, and make sure it can narrow down to your thesis.
2.2. Specific background: Work done so far
Give your reader a sense of previous accomplishments, current contradictions, and competing theories in the field. Cite previous work that illustrates your narrative and gives a balanced description of the scientific landscape on this research topic.
2.3. Knowledge gap: Motivation for your work
Give evidence of the incompleteness of the current understanding and of the value of investigating the field further. What is the gap that needs to be filled? Demonstrate the importance of this unsolved problem as the motivation for your work.
2.4. Aim of your paper
Finally, clearly state the aim and scope of this article (not the project) and what exact question is answered. You may also briefly explain how the study was conducted, and share a preview of your findings.
3. Quick tips
- Select your target journal carefully. Make sure there is a clear match between your objective for the paper, and the journal’s mission, scope, and readership. This will not only help you write your Introduction but also increase your chances of getting your submission accepted.
- Follow the publisher’s guidelines and read other papers from your target journal to make sure you understand their expectations.
- Only cite relevant work. The previous findings and studies you cite must be strongly related to your research topic, and lead to the knowledge gap of your paper.
- Have a clear story line before writing your Introduction. A paper may be divided into discrete sections but these must all work together. The story you choose for the Results and Discussion sections will determine which theories and past research or methodologies need to be presented in the Introduction. Do not spend excessive amounts of time perfecting the Introduction until you have clear path for the whole paper
- Refer back to your Introduction when you write your Conclusion. The Introduction and Conclusion together serve as “book covers.” Just as your Introduction describes the scientific landscape surrounding your work, your Conclusion will address how your work adds to the field.
4. Annotated examples
Return to Contents
To get started or receive feedback on your draft, make an appointment with us. We’d love to help!
- About the LSE Impact Blog
- Comments Policy
- Popular Posts
- Recent Posts
- Subscribe to the Impact Blog
- Write for us
- LSE comment
Pat Thomson
January 21st, 2016, writing the introduction to a journal article: say what the reader is going to encounter and why it is important..
8 comments | 13 shares
Estimated reading time: 10 minutes

So you want to write a journal article but are unsure about how to start it off? Well, here’s a few things to remember. The introduction to your journal article must create a good impression . Readers get a strong view of the rest of the paper from the first couple of paragraphs. If your work is engaging, concise and well structured, then readers are encouraged to go on. On the other hand, if the introduction is poorly structured, doesn’t get to the point, and is either boring or too clever by half, then the reader may well decide that those two or three paragraphs were enough. Quite enough.
At the end of the introduction, you want your reader to read on, and read on with interest, not with a sense of impending doom, or simply out of duty. The introduction therefore has to say what the reader is going to encounter in the paper, as well as why it is important. While in some scholarly traditions it is customary to let the reader find out the point of the paper at the very end – ta da – this is not how the English tradition usually works. English language journals want the rationale for the paper, and its argument, flagged up at the start.
Image credit: Classical figure in robes, riding an eagle and writing on a tablet (From The New York Public Library Public Domain)
The introduction can actually be thought of as a kind of mini-thesis statement, with the what, why and how of the argument spelled out in advance of the extended version. The introduction generally lays out a kind of road-map for the paper to come. It also lets the reader know broadly about the kinds of information and evidence that you will use to make your case in the paper.
Writing an introduction is difficult. You have to think about:
- the question, problem or puzzle that you will pose at the outset, as well as
- the answer, and
- how the argument that constitutes your answer is to be staged.
At the same time, you also have to think about how you can make this opening compelling. You have to ask yourself how you will place your chosen question, problem or puzzle in a context the reader will understand. You need to consider: How broad or narrow should the context be – how local, how international, how discipline specific? Should the problem, question or puzzle be located in policy, practice or the state of scholarly debate – the literatures?
Then you have to consider the ways in which you will get the reader’s attention via a gripping opening sentence and/or the use of a provocation – an anecdote, snippet of empirical data, media headline, scenario, quotation or the like. And you must write this opener with authority – confidently and persuasively.
Writing a good introduction typically means “straightforward” writing. Not too many citations to trip the reader up. No extraordinarily long sentences with multiple ideas separated by commas and semicolons. Not too much passive voice and heavy use of nominalisation, so that the reader feels as if they are swallowing a particularly stodgy bowl of cold, day-old tapioca.
Journal article introductions – presentation from Pat Thomson

All of this? Questions, context, arguments, sequence and style as well? This is a big ask. An introduction has a lot of work to do in few words. It is little wonder that people often stall on introductions. So how to approach the writing?
In my writing courses I see people who are quite happy to get something workable, something “good enough” for the introduction – they write the introduction as a kind of place-holder – and then come back to it in subsequent edits to make it more convincing and attractive. But I also see people who can achieve a pretty good version of an introduction quite quickly, and they find that getting it “almost right” is necessary to set them up for the rest of the paper.
The thing is to find out what approach works for you.
You don’t want to end up stalled for days trying to get the most scintillating opening sentence possible. (You can always come back and rewrite!) Just remember that the most important thing to get sorted at the start is the road map, because that will help you write rest of the paper. And if you change your mind about the structure of the paper during the writing, you can always come back and adjust the introduction. Do keep saying to yourself “Nothing is carved in stone with a journal article until I send it off for publication!”
This article was originally published at Pat Thomson’s personal blog, Patter , and is republished here with permission.
Note: This article gives the views of the author(s), and not the position of the LSE Impact blog, nor of the London School of Economics.
About the author:
Pat Thomson is Professor of Education at the University of Nottingham. Her current research focuses on creativity, the arts and change in schools and communities, and postgraduate writing pedagogies. She is currently devoting more time to exploring, reading and thinking about imaginative and inclusive pedagogies which sit at the heart of change. She blogs about her research at Patter .

About the author

Pat Thomson is Professor of Education at the University of Nottingham. Her current research focuses on creativity, the arts and change in schools and communities, and postgraduate writing pedagogies. She blogs about her research at Patter.
- Pingback: Pitching Papers as if You Worked in Nashville | Howard Aldrich
- Pingback: Writing the introduction to a journal article: Say what the reader is going to encounter and why it is important. – Veille juridique
And resist the urge to bloviate about the obvious, such as the global public health significance of depression when your data have a much more modest scope and focus.
- Pingback: How (not!) to write a literature review… – Lyndsey Jenkins
- Pingback: Some Resources for Writers | Dr Geoff Kushnick
Writing a good introduction typically means “straightforward” writing and generally lays out a kind of road-map for the paper to come. Where did you get this information?
- Pingback: Redação científica deveria ser um assunto sério no Brasil |
Good post. I really loved the way you have explained things here. Keep up the good work. Cheers!
Leave a Comment Cancel reply
Your email address will not be published. Required fields are marked *
Notify me of follow-up comments by email.
Related Posts

To save the research literature, get rid of the literature review
June 12th, 2018.

Research Rituals – Finding the value of writing accountability groups
June 17th, 2022.

6 Insights into being a productive and happy academic author
March 7th, 2019.

The researcher’s guide to literature: Visualising crowd-sourced overviews of knowledge domains.
February 16th, 2015.

Visit our sister blog LSE Review of Books
Have a language expert improve your writing
Run a free plagiarism check in 10 minutes, generate accurate citations for free.
- Knowledge Base
- Research paper
Writing a Research Paper Introduction | Step-by-Step Guide
Published on September 24, 2022 by Jack Caulfield . Revised on March 27, 2023.

The introduction to a research paper is where you set up your topic and approach for the reader. It has several key goals:
- Present your topic and get the reader interested
- Provide background or summarize existing research
- Position your own approach
- Detail your specific research problem and problem statement
- Give an overview of the paper’s structure
The introduction looks slightly different depending on whether your paper presents the results of original empirical research or constructs an argument by engaging with a variety of sources.
Instantly correct all language mistakes in your text
Upload your document to correct all your mistakes in minutes

Table of contents
Step 1: introduce your topic, step 2: describe the background, step 3: establish your research problem, step 4: specify your objective(s), step 5: map out your paper, research paper introduction examples, frequently asked questions about the research paper introduction.
The first job of the introduction is to tell the reader what your topic is and why it’s interesting or important. This is generally accomplished with a strong opening hook.
The hook is a striking opening sentence that clearly conveys the relevance of your topic. Think of an interesting fact or statistic, a strong statement, a question, or a brief anecdote that will get the reader wondering about your topic.
For example, the following could be an effective hook for an argumentative paper about the environmental impact of cattle farming:
A more empirical paper investigating the relationship of Instagram use with body image issues in adolescent girls might use the following hook:
Don’t feel that your hook necessarily has to be deeply impressive or creative. Clarity and relevance are still more important than catchiness. The key thing is to guide the reader into your topic and situate your ideas.
Prevent plagiarism. Run a free check.
This part of the introduction differs depending on what approach your paper is taking.
In a more argumentative paper, you’ll explore some general background here. In a more empirical paper, this is the place to review previous research and establish how yours fits in.
Argumentative paper: Background information
After you’ve caught your reader’s attention, specify a bit more, providing context and narrowing down your topic.
Provide only the most relevant background information. The introduction isn’t the place to get too in-depth; if more background is essential to your paper, it can appear in the body .
Empirical paper: Describing previous research
For a paper describing original research, you’ll instead provide an overview of the most relevant research that has already been conducted. This is a sort of miniature literature review —a sketch of the current state of research into your topic, boiled down to a few sentences.
This should be informed by genuine engagement with the literature. Your search can be less extensive than in a full literature review, but a clear sense of the relevant research is crucial to inform your own work.
Begin by establishing the kinds of research that have been done, and end with limitations or gaps in the research that you intend to respond to.
The next step is to clarify how your own research fits in and what problem it addresses.
Argumentative paper: Emphasize importance
In an argumentative research paper, you can simply state the problem you intend to discuss, and what is original or important about your argument.
Empirical paper: Relate to the literature
In an empirical research paper, try to lead into the problem on the basis of your discussion of the literature. Think in terms of these questions:
- What research gap is your work intended to fill?
- What limitations in previous work does it address?
- What contribution to knowledge does it make?
You can make the connection between your problem and the existing research using phrases like the following.
Now you’ll get into the specifics of what you intend to find out or express in your research paper.
The way you frame your research objectives varies. An argumentative paper presents a thesis statement, while an empirical paper generally poses a research question (sometimes with a hypothesis as to the answer).
Argumentative paper: Thesis statement
The thesis statement expresses the position that the rest of the paper will present evidence and arguments for. It can be presented in one or two sentences, and should state your position clearly and directly, without providing specific arguments for it at this point.
Empirical paper: Research question and hypothesis
The research question is the question you want to answer in an empirical research paper.
Present your research question clearly and directly, with a minimum of discussion at this point. The rest of the paper will be taken up with discussing and investigating this question; here you just need to express it.
A research question can be framed either directly or indirectly.
- This study set out to answer the following question: What effects does daily use of Instagram have on the prevalence of body image issues among adolescent girls?
- We investigated the effects of daily Instagram use on the prevalence of body image issues among adolescent girls.
If your research involved testing hypotheses , these should be stated along with your research question. They are usually presented in the past tense, since the hypothesis will already have been tested by the time you are writing up your paper.
For example, the following hypothesis might respond to the research question above:
The only proofreading tool specialized in correcting academic writing - try for free!
The academic proofreading tool has been trained on 1000s of academic texts and by native English editors. Making it the most accurate and reliable proofreading tool for students.

Try for free
The final part of the introduction is often dedicated to a brief overview of the rest of the paper.
In a paper structured using the standard scientific “introduction, methods, results, discussion” format, this isn’t always necessary. But if your paper is structured in a less predictable way, it’s important to describe the shape of it for the reader.
If included, the overview should be concise, direct, and written in the present tense.
- This paper will first discuss several examples of survey-based research into adolescent social media use, then will go on to …
- This paper first discusses several examples of survey-based research into adolescent social media use, then goes on to …
Full examples of research paper introductions are shown in the tabs below: one for an argumentative paper, the other for an empirical paper.
- Argumentative paper
- Empirical paper
Are cows responsible for climate change? A recent study (RIVM, 2019) shows that cattle farmers account for two thirds of agricultural nitrogen emissions in the Netherlands. These emissions result from nitrogen in manure, which can degrade into ammonia and enter the atmosphere. The study’s calculations show that agriculture is the main source of nitrogen pollution, accounting for 46% of the country’s total emissions. By comparison, road traffic and households are responsible for 6.1% each, the industrial sector for 1%. While efforts are being made to mitigate these emissions, policymakers are reluctant to reckon with the scale of the problem. The approach presented here is a radical one, but commensurate with the issue. This paper argues that the Dutch government must stimulate and subsidize livestock farmers, especially cattle farmers, to transition to sustainable vegetable farming. It first establishes the inadequacy of current mitigation measures, then discusses the various advantages of the results proposed, and finally addresses potential objections to the plan on economic grounds.
The rise of social media has been accompanied by a sharp increase in the prevalence of body image issues among women and girls. This correlation has received significant academic attention: Various empirical studies have been conducted into Facebook usage among adolescent girls (Tiggermann & Slater, 2013; Meier & Gray, 2014). These studies have consistently found that the visual and interactive aspects of the platform have the greatest influence on body image issues. Despite this, highly visual social media (HVSM) such as Instagram have yet to be robustly researched. This paper sets out to address this research gap. We investigated the effects of daily Instagram use on the prevalence of body image issues among adolescent girls. It was hypothesized that daily Instagram use would be associated with an increase in body image concerns and a decrease in self-esteem ratings.
The introduction of a research paper includes several key elements:
- A hook to catch the reader’s interest
- Relevant background on the topic
- Details of your research problem
and your problem statement
- A thesis statement or research question
- Sometimes an overview of the paper
Don’t feel that you have to write the introduction first. The introduction is often one of the last parts of the research paper you’ll write, along with the conclusion.
This is because it can be easier to introduce your paper once you’ve already written the body ; you may not have the clearest idea of your arguments until you’ve written them, and things can change during the writing process .
The way you present your research problem in your introduction varies depending on the nature of your research paper . A research paper that presents a sustained argument will usually encapsulate this argument in a thesis statement .
A research paper designed to present the results of empirical research tends to present a research question that it seeks to answer. It may also include a hypothesis —a prediction that will be confirmed or disproved by your research.
Cite this Scribbr article
If you want to cite this source, you can copy and paste the citation or click the “Cite this Scribbr article” button to automatically add the citation to our free Citation Generator.
Caulfield, J. (2023, March 27). Writing a Research Paper Introduction | Step-by-Step Guide. Scribbr. Retrieved April 8, 2024, from https://www.scribbr.com/research-paper/research-paper-introduction/
Is this article helpful?

Jack Caulfield
Other students also liked, writing strong research questions | criteria & examples, writing a research paper conclusion | step-by-step guide, research paper format | apa, mla, & chicago templates, what is your plagiarism score.
Oxford University Press's Academic Insights for the Thinking World

How to write a journal article
Oxford Academic journals
Find out more about publishing partnerships with Oxford Academic.
- By Rose Wolfe-Emery
- July 21 st 2023
Academics normally learn how to write while on the job, sugge s ts Michael Hochberg. This usually starts with “the dissertation and interactions with their supervisor. Skills are honed and new ones acquired with each successive manuscript.” Writing continues to improve throughout a career, but that thought might bring little solace if you are staring at a blank document and wondering where to start.
In this blog post, we share tips from editors and outline some ideas to bear in mind when drafting a journal article. Whether you are writing a journal article to share your research, contribute to your field, or progress your career, a well-written and structured article will increase the likelihood of acceptance and of your article making an impact after publication.
Four tips for writing well
Stuart West and Lindsay Turnbull suggest four general principles to bear in mind when writing journal articles:
- Keep it simple: “Simple, clear writing is fundamental to this task. Instead of trying to sound […] clever, you should be clear and concise.”
- Assume nothing: “When writing a paper, it’s best to assume that your reader is [subject] literate, but has very little expert knowledge. Your paper is more likely to fail because you assumed too much, than because you dumbed it down too much.”
- Keep to essentials: “If you focus on the main message, and remove all distractions, then the reader will come away with the message that you want them to have.”
- Tell your story : “Good […] writing tells a story. It tells the reader why the topic you have chosen is important, what you found out, and why that matters. For the story to flow smoothly, the different parts need to link clearly to each other. In creative writing this is called ‘narrative flow’.”
“A paper is well-written if a reader who is not involved in the work can understand every single sentence in the paper,” argues Nancy Dixon. But understanding is the bare minimum that you should aim for—ideally, you want to engage your audience, so they keep reading.
As West and Turnbull say , frankly: “Your potential reader is someone time-limited, stressed, and easily bored. They have a million other things to do and will take any excuse to give up on reading your paper.”
A complete guide to preparing a journal article for submission
Consider your research topic.
Before you begin to draft your article, consider the following questions:
- What key message(s) do you want to convey?
- Can you identify a significant advance that will arise from your article?
- How could your argument, results, or findings change the way that people think or advance understanding in the field?
As Nancy Dixon says: “[A journal] editor wants to publish papers that interest and excite the journal’s readers, that are important to advancing knowledge in the field and that spark new ideas for work in the field.”
Think about the journal that you want to submit to
Research the journals in your field and create a shortlist of “target” journals before writing your article, so that you can adapt your writing to the journal’s audience and style. Journals sometimes have an official style guide but reading published articles can also help you to familiarise yourself with the format and tone of articles in your target journals. Journals often publish articles of varying lengths and structures, so consider what article type would best suit your argument or results.
Check your target journals’ editorial policies and ethical requirements. As a minimum, all reputable journals require submissions to be original and previously unpublished. The ThinkCheckSubmit checklist can help you to assess whether a journal is suitable for your research.
Now that you’ve decided on your research topic and chosen the journal you plan on submitting to, what do you need to consider when drafting each section of your article?
Create an outline
Firstly, it’s worth creating an outline for your journal article, broken down by section. Seth J. Schwartz explains this as follows:
Writing an outline is like creating a map before you set out on a road trip. You know which roads to take, and where to turn or get off the highway. You can even decide on places to stop during your trip. When you create a map like this, the trip is planned and you don’t have to worry whether you are going in the correct direction. It has already been mapped out for you.
The typical structure of a journal article
- Make it concise, accurate, and catchy
- Avoid including abbreviations or formulae
- Choose 5-7 keywords that you’d like your journal article to appear in the search results for
- Summarize the findings of your journal article in a succinct, “punchy”, and relevant way
- Keep it brief (200 words for the letter, and 250 words for the main journal)
- Do not include references
Introduction
- Introduce your argument or outline the problem
- Describe your approach
- Identify existing solutions and limitations, or provide the existing context for your discussion
- Define abbreviations
Methods
For STEM and some social sciences articles
- Describe how the work was done and include plenty of detail to allow for reproduction
- Identify equipment and software programs
Results
For STEM and some social science articles
- Decide on the data to present and how to present it (clearly and concisely)
- Summarise the key results of the article
- Do not repeat results or introduce new discussion points
Acknowledgements
- Include funding, contributors who are not listed as authors, facilities and equipment, referees (if they’ve been helpful; even though anonymous)
- Do not include non-research contributors (parents, friends, or pets!)
- Cite articles that have been influential in your research—these should be well-balanced and relevant
- Follow your chosen journal’s reference style, such as Harvard or Chicago
- List all citations in the text alphabetically at end of the article
Sharing data
Many journals now encourage authors to make all data on which the conclusions of their article rely available to readers. This data can be presented in the main manuscript, in additional supporting files, or placed in a public repository.
Journals also tend to support the Force 11 Data Citation Principles that require all publicly available datasets be fully referenced in the reference list with an accession number or unique identifier such as a digital object identifier (DOI).
Permissions
Permission to reproduce copyright material, for online publication without a time limit, must also be cleared and, if necessary, paid for by the author. Evidence in writing that such permissions have been secured from the rights-holder are usually required to be made available to the editors.
Learning from experience
Publishing a journal article is very competitive, so don’t lose hope if your article isn’t accepted to your first-choice journal the first-time round. If your article makes it to the peer-review stage, be sure to take note of what the reviewers have said, as their comments can be very helpful. As well as continuing to write, there are other things you can do to improve your writing skills, including peer review and editing.
Christopher, Marek, and Zebel note that “there is no secret formula for success”, arguing that:
The lack of a specific recipe for acceptances reflects, in part, the variety of factors that may influence publication decisions, such as the perceived novelty of the manuscript topic, how the manuscript topic relates to other manuscripts submitted at a similar time, and the targeted journal. Thus, beyond actively pursuing options for any one particular manuscript, begin or continue work on others. In fact, one approach to boosting writing productivity is to have a variety of ongoing projects at different stages of completion. After all, considering that “100 percent of the shots you do not take will not go in,” you can increase your chances of publication by taking multiple shots.
Rose Wolfe-Emery , Marketing Executive, Oxford University Press
- Editor's Picks
- Publishing 101
- Series & Columns
Our Privacy Policy sets out how Oxford University Press handles your personal information, and your rights to object to your personal information being used for marketing to you or being processed as part of our business activities.
We will only use your personal information to register you for OUPblog articles.
Or subscribe to articles in the subject area by email or RSS
Related posts:

Recent Comments
There are currently no comments.
We use cookies on this site to enhance your experience
By clicking any link on this page you are giving your consent for us to set cookies.
A link to reset your password has been sent to your email.
Back to login
We need additional information from you. Please complete your profile first before placing your order.
Thank you. payment completed., you will receive an email from us to confirm your registration, please click the link in the email to activate your account., there was error during payment, orcid profile found in public registry, download history, how to write an introduction to an academic article.
- Charlesworth Author Services
- 17 August, 2020
- Academic Writing Skills
How to write an Introduction to an academic article
The introduction to an academic article is the first section of the paper, immediately following the abstract. One of the most important functions of an introduction is to answer the question ‘why?’: why was the study performed, and why is it interesting and/or important? Given that the introduction is the beginning of the paper, it also serves to tell the reader why they should read the rest of the paper and prepares them to understand the importance and implications of the results.
To clearly establish the context for the study, the introduction contains four main components:
General background information
Specific background information.
- A description of the gap in our knowledge that the study was designed to fill
- A statement of study objective, and (optionally) a brief summary of study
This information should ideally be presented in a ‘funnel’ format, flowing from the most general information at the beginning of the section to more specific information as the text continues. Let’s take a closer look at each of these elements in turn.
The first paragraph of the introduction establishes the broad context for the study by providing a general introduction to the field. How broad this paragraph is depends on your target journal and audience. If you choose to submit to a general journal with a wide scientific readership, it is a good idea to start with some fairly general information, as not all readers will necessarily be familiar with your specific field. If you plan on submitting to a highly specialized journal, however, you can begin this section with a much more specific and focused description of the background, as most of your readers will already be familiar with the context of the study.
Let’s say, for example, that your study addresses MAPK signalling in triple negative breast cancer in a specific population. If you are submitting your paper to a journal with a broad focus, it could be useful to begin this section with a brief introduction to breast cancer in general. If, however, you choose to submit to a breast cancer–specific journal, it would be reasonable to start the introduction by discussing triple negative breast cancer, or even the role of MAPK signalling in triple negative breast cancer.
Once the general context of the study has been established, the next part of the introduction should go into more detail about the main topic of the study. This is the part of the introduction that provides a literature review, in which other studies that have addressed similar themes are discussed in detail, to provide readers with a clear picture of what is already known about the topic. The point of this section is to present a complete picture of the state of the field, as this will help explain how your study builds on previous work. Describing the current state of the field helps readers understand your thought process in designing the study, and the logical steps that led you to formulate the main question addressed by your study.
Continuing with the example outlined above, if submitting to a journal with a general readership, this would be the appropriate place to present more detail about triple negative breast cancer and the role of MAPK signalling. In the case of a more specialized journal, in our example this could be a good place to go into more detail about the specific population you studied.
Gap in knowledge
The description of closely related previous studies, as discussed above, should clearly outline a specific gap in our knowledge or understanding of a specific question or phenomenon in the field. Sometimes this is accomplished simply by describing the work that has recently been done to investigate related questions; for example, if risk factors for a disease have been investigated in African and European populations, but not in Asian populations, describing what is already known about this disease in those populations will help readers understand the logic behind exploring the same question in an underexplored population. In other cases, it may be appropriate to (respectfully) point out shortcomings or drawbacks of similar studies to highlight the way in which your study improves on this earlier work. For example, if previous studies have designed computational models that account for some, but not all, of the properties of a specific reaction, you could point out the importance of incorporating additional properties to explain the need for the new computational model described in your study.
While the part of the introduction that describes the specific context for your study should lead naturally to an understanding of the gap in our knowledge that the study addresses, it is often useful to state this explicitly, for the sake of clarity. It is common to do so by including a sentence just prior to the last paragraph of the introduction that begins: ‘However, it remains unclear…’ or ‘However, it is still unknown…’.
Statement of study aim
The final element of the introduction is a clear statement of the primary objective of the study. In some cases, this will be the main overarching question the study sought to answer; in other cases, this may be a formal hypothesis; and in yet other cases, this may be a goal. Regardless of the form it takes, it is important to state the study aim clearly, ideally in the final paragraph of the introduction, to help ensure that readers clearly understand the specific purpose of the study before going on to read about it in greater detail in the sections that follow. Keep in mind that this statement of the study aim should closely mirror the statement of the study aim in the abstract, to present a cohesive and consistent message about the purpose of the study.
In some cases, it is appropriate to conclude the introduction with a summary paragraph that provides a very concise overview of the key findings and overall conclusion. This brief paragraph can help remind readers of the key points of the study within the context of the background information provided in the rest of the introduction, and provide a structure for understanding the rest of the text.
What should be left out of the introduction?
As discussed above, the primary purpose of the introduction is to provide adequate background information for readers to understand the context and importance of the study. For this reason, we recommend leaving out any background information that is not related directly to the main topic of the study. For example, if mutations in the protein you investigated have been linked to both cardiovascular disease and cancer, but your study only looked at cancer, discussing mutations found in patients with cardiovascular disease could distract and confuse readers. For this reason, we suggest reviewing the text of the introduction carefully to ensure that all of the information it presents has a direct logical link to the main focus of your study.
In addition, the introduction is generally not the best place to discuss the methodology used in your study, as this section should primarily be dedicated to explaining why the study was performed, not how it was performed. An exception to this rule is if the main purpose of the study was to develop or test a novel methodology, in which case it would of course be appropriate to discuss other techniques and the rationale behind the design of the new technique developed in your study. Similarly, if the main novelty of your study is the method used to investigate the central question, then this would also be a case in which it would be appropriate to discuss the methodology in the introduction.
In summary, a well-written introduction sets the tone for your paper by providing readers with all of the information they need to understand why you performed your study, what makes it different from other similar studies, and why the findings are interesting and important.
If you are seeking additional support in writing an effective introduction, we are here to help. Charlesworth Author Services provide expert English language editing and publication support services. Why not get in touch with a member of our Charlesworth Author Services team for more information.
Our academic writing and publishing training courses, online materials, and blog articles contain numerous tips and tricks to help you navigate academic writing and publishing, and maximise your potential as a researcher. You can find out more about our Free author training webinar series by clicking here.
Maximise your publication success with Charlesworth Author Services.
Share with your colleagues
Related articles.

Getting the title of your research article right
Charlesworth Author Services 17/08/2020 00:00:00
Recommended webinars

Bitesize Webinar: How to write and structure your academic article for publication- Module 3: Understand the structure of an academic paper
Charlesworth Author Services 04/03/2021 00:00:00

Bitesize Webinar: How to write and structure your academic article for publication: Module 6: Choose great titles and write strong abstracts
Charlesworth Author Services 05/03/2021 00:00:00

Bitesize Webinar: How to write and structure your academic article for publication: Module 7: Write a strong theoretical framework section

Writing a strong Methods section
Charlesworth Author Services 12/03/2021 00:00:00

Bitesize Webinar: How to write and structure your academic article for publication: Module 8: Write a strong methods section

How to write a Methods section in your research paper

- my research
- contributions and comments
writing the introduction to a journal article
So you want to write a journal article but are unsure about how to start it off? Well, here’s a few things to remember.
The introduction to your journal article must create a good impression . Readers get a strong view of the rest of the paper from the first couple of paragraphs. If your work is engaging, concise and well structured, then readers are encouraged to go on. On the other hand, if the introduction is poorly structured, doesn’t get to the point, and is either boring or too clever by half, then the reader may well decide that those two or three paragraphs were enough. Quite enough.
At the end of the introduction, you want your reader to read on, and read on with interest, not with a sense of impending doom, or simply out of duty. The introduction therefore has to say what the reader is going to encounter in the paper, as well as why it is important. While in some scholarly traditions it is customary to let the reader find out the point of the paper at the very end – ta da – this is not how the English tradition usually works. English language journals want the rationale for the paper, and its argument, flagged up at the start.
The introduction can actually be thought of as a kind of mini-thesis statement, with the what, why and how of the argument spelled out in advance of the extended version. The introduction generally lays out a kind of road-map for the

A simple introduction is often welcome
Writing an introduction is difficult. You have to think about:
- the question, problem or puzzle that you will pose at the outset, as well as
- the answer, and
- how the argument that constitutes your answer is to be staged.
At the same time, you also have to think about how you can make this opening compelling. You have to ask yourself how you will place your chosen question, problem or puzzle in a context the reader will understand. You need to consider: How broad or narrow should the context be – how local, how international, how discipline specific? Should the problem, question or puzzle be located in policy, practice or the state of scholarly debate – the literatures?
Then you have to consider the ways in which you will get the reader’s attention via a gripping opening sentence and/or the use of a provocation – an anecdote, snippet of empirical data, media headline, scenario, quotation or the like. And you must write this opener with authority – confidently and persuasively.
Writing a good introduction typically means “straightforward” writing. Not too many citations to trip the reader up. No extraordinarily long sentences with multiple ideas separated by commas and semicolons. Not too much passive voice and heavy use of nominalisation, so that the reader feels as if they are swallowing a particularly stodgy bowl of cold, day-old tapioca.
All of this? Questions, context, arguments, sequence and style as well? This is a big ask.
An introduction has a lot of work to do in few words. It is little wonder that people often stall on introductions. So how to approach the writing?
In my writing courses I see people who are quite happy to get something workable, something “good enough” for the introduction – they write the introduction as a kind of place-holder – and then come back to it in subsequent edits to make it more convincing and attractive. But I also see people who can achieve a pretty good version of an introduction quite quickly, and they find that getting it “almost right” is necessary to set them up for the rest of the paper.
The thing is to find out what approach works for you.
You don’t want to end up stalled for days trying to get the most scintillating opening sentence possible. (You can always come back and rewrite!) Just remember that the most important thing to get sorted at the start is the road map, because that will help you write rest of the paper. And if you change you mind about the structure of the paper during the writing, you can always come back and adjust the introduction. Do keep saying to yourself “Nothing is carved in stone with a journal article until I send it off for publication!”
Share this:

About pat thomson
14 responses to writing the introduction to a journal article.
Pingback: writing the introduction to a journal article | the neuron club
Pingback: writing the introduction to a journal article | Saint Mary's University Writing Centre
thanks, i needed to see this right now. I have to edit an article and write a couple more new papers soon
There are two categories of journal and thesis writers: 1. Those who can’t write the introduction until they have almost finished the rest of the paper. These are people who work out what they need to say in the process of writing. The argument produces itself through writing. 2. Those who need to formulate an entire argument before starting to write. These people polish up the abstract and intro first.
I fall into the first category. I suspect we need to produce more drafts than those in category 2, but we tend to start writing earlier than category 2 people. In the case of theses category 2 types think through the entire thesis first and produce chapter sequentially. We messy category 1 types produce chapters and articles in the process of the research then often have a difficult time getting them all to work together to tell a coherent bigger story. Other approaches are valid – it’s a matter of temperament and personality….
I think these are the two ends of a writing continuum, certainly. Those who don’t plan usually write what I’m calling a place holder as the introduction, at some point, then they return to it. (There is quite a lot on the blog about the various approaches and in particular these two ends.) Type 2 do stillneed to know what an introduction does and how it goes…
I fall into the first category. I suspect we need to produce more drafts than those in category 2, but we tend to start writing earlier than category 2 people. In the case of theses category 2 types think through the entire thesis first and produce chapter sequentially. We messy category 1 types produce chapters and articles in the process of the research then often have a difficult time getting them all to work together to tell a coherent bigger story. Other approaches are valid – it’s a meter of temperament and personality….
Sent from my iPad
I’m glad I saw this. I’m editing a manuscript to submit, so this is a great reminder!
Reblogged this on Phambichha's Blog and commented: It is important to write an inviting introduction. Here are helpful tips from Patter
Reblogged this on The Academic Triangle and commented: This is a really good introduction into the world of academic publishing.
I was at a Meet-the-Editors session at a conference recently. The importance of the introduction was stressed by several editors. Reviewers spend the longest time reading this section – and you should spend the longest time crafting it was the message.
Pingback: paper not working? try the “what’s the problem?” approach | patter
Pingback: Wissenschaftliches Schreiben
Pingback: eek, it’s nearly 2018 | patter
Leave a comment Cancel reply
- Search for:
Follow Blog via Email
Enter your email address to follow this blog and receive notifications of new posts by email.
Email Address:

patter on facebook
Recent Posts
- research as creative practice – possibility thinking
- research as – is – creative practice
- On MAL-attribution
- a brief word on academic mobility
- Key word – claim
- key words – contribution
- research key words – significance
- a thesis is not just a display
- should you do a “side project”?
- the ABC of organising your time
- Why journal articles are rejected
- the IMRaD structure is rarely enough

SEE MY CURATED POSTS ON WAKELET
Top posts & pages.
- research as creative practice - possibility thinking
- aims and objectives - what's the difference?
- writing a bio-note
- criticality in the PhD - nine things to avoid
- research as - is - creative practice
- avoiding the laundry list literature review
- I can't find anything written on my topic... really?
- headings and subheadings – it helps to be specific
- five ways to structure a literature review
- from description to analysis - a revision strategy
- Entries feed
- Comments feed
- WordPress.com
- Already have a WordPress.com account? Log in now.
- Subscribe Subscribed
- Copy shortlink
- Report this content
- View post in Reader
- Manage subscriptions
- Collapse this bar
A Step-by-Step Guide to Writing a Compelling Article Introduction
Wouldn’t it be great if every single person who clicked on one of your articles read it from start to finish, unable to pull their eyes away from the screen?
We think we both know the answer to that question.
To achieve this goal, however, you must master the art of writing intriguing introductions.
Wait a second , you’re thinking. Writing introductions? Isn’t that kind of a small detail of a 2,000-word article? Unfortunately, no. Your article intro is not a small detail.
The introduction to your article is often the difference between engaging readers and having a bounce rate high enough to make a click-baiter cringe .
Think about it. If you don’t grab your readers right away, you’ll lose them.
You went through all that work of writing a killer article, right? You worked hard at it. You spent a lot of time on it. You did a ton of research but if your introduction sucks, your efforts will be all for nothing. You’ll have lost before you even got started!
If you want to write great content , improve the success of your marketing campaigns, and increase the loyalty of your fans, you must master writing introductions.
Let us show you how.
5 Steps to Write an Article Introduction
Here’s how you write a blog introduction that doesn’t stink:
- Master the opening line
- Have something unique to say
- Keep it simple
- Speak directly to the reader
- Explain what the article is about
Step 1 – Master the Opening Line
To have a strong introduction, you need to open with a strong first sentence.
The millisecond your reader hits the page, they have an extremely high likelihood of leaving the page.

Data says so.
The first sentence has one single purpose: to entice the reader to read the next sentence. In doing so, it sets the tone for the rest of the article, hooking the reader in, one step at a time.
If you fail at this, you readers won’t scroll. That’s why its often best to have your first sentence act as a hook to engage a readers attention. The easiest way to do this is to cite a relevant fact or statistic that you know the reader will be interested in that relates to your article’s topic.

And if they don’t scroll, they won’t engage.
Check out this article by Dilbert author Scott Adams to see how the first sentence is done.

He writes this:
I went from being a bad writer to a good writer after taking a one-day course in “business writing.”
That’s a great opening line.
Why? Because it makes you want to know more!
- How did he become a good writer?
- What did he learn?
- Could I benefit from it too?
Adams nailed it. He drew us in by making us ask questions.
If you don’t know how to craft an intriguing first sentence, the remaining words of your article will be a complete waste.
Luckily for you, with a few simple tricks, writing a phenomenal first sentence can be quite easy.
The first thing to keep in mind is that you want to keep the first sentence short. This makes it easy for the reader to digest the first bits of information and prevents them from losing interest quickly.
But there is more to it than that.
You have to make sure that the first sentence grabs the reader’s attention and holds it for the rest of the article.
Here are a couple of tried-and-true tactics that make for super compelling first lines.
Ask the reader a question
This is an easy way to get the reader’s attention and get them engaged without a whole lot of effort on your part.
For example, if you are writing an article on quitting your job and starting your own company, you could open with the question: “Did you know that almost 70% of Americans report being actively disengaged from their careers?” Remember we mentioned using a statistic earlier?
Why does this work?
It has to do with the brain’s “ limbic reward system .”

When this system is activated, dopamine is released. And dopamine gives us a sense of reward and pleasure.
When we are intrigued by a question, i.e., experience a sense of curiosity, the limbic reward system lights up. And that’s why we want to keep reading—it’s rewarding to satisfy curiosity.
Here’s an example. Writer Olga Khazan asks a question that’s on everyone’s mind, causing the reader to be instantly interested:

We want to know the answer to that question, so we keep reading.
That’s why a question is a great opening line. You can even use the question as the article title.
Tell a story
The brain also lights up when it encounters a story.
According to the theory of neural coupling , certain portions of the brain are activated when a reader thinks about the same mental and physical activity that a character in a story is doing.

James Clear usually starts his blog articles with a story, often a true story.

The story makes his readers interested in the article and keeps them reading to the very end.
Use a shocking quote
Another great way to start your article is to use an attention-grabbing quote.
Let’s say you are writing an article on world travel. A great way to introduce the article would be with the quote from Helen Keller:
“Life is a daring adventure or nothing at all.”
Using a quote like this will grab the readers attention and make them want to learn more.
Tell the reader to imagine
Sparking the imagination is an instant way to draw the reader into the experience of the article.
Notice how this article begins:

The reader tries to obey the imperative by imagining. This effort compels the reader to read further, drawing them into the article.
Writers for The Atlantic are experts at their craft. This writer does the same thing—asking the reader to imagine.

Share an interesting fact
In a day and age when the Internet is so rife with untrustworthy information and fraudulent “gurus,” people are skeptical. They have every reason to be.
Opening your article with a relevant fact or statistic is a great way to establish trust and authority from the first sentence and let readers know you’ve done your research — like we said before.
Step 2 – Have Something Unique to Say
Okay, so you’ve crafted an excellent first sentence, and you have your reader’s interest.
Now, you have to hold that interest by having something interesting and uncommon to say.
Very few people take the time and energy to regularly produce new, thought-provoking content. If you do, you’ll set yourself apart from the herd in a big way.
Forget re-purposing of old articles or rewriting stuff from other people’s websites. If you want to have the reader’s respect and attention, you have to say something they’ve never heard before.
Unfortunately, a lot of the stuff you read today has been regurgitated 28 times before.
Let’s imagine you run a travel blog. Based on our advice, you write a number of 3,000-word comprehensive “How-To Guides.”
Whenever a reader opens your guide on financing their way around the world trip, they’ll expect to read all about airline rewards programs, frugality, and credit card points.
And that information is great, but it is also very generic.
A better introduction would be something like this:
How would you like to save up enough money in the next 6 months to spend all of 2017 traveling the world? That would be pretty epic, right? Well, this is entirely possible, and in today’s article, we’re going to show you how you can do this. It’s not by skipping your morning latte or spending thousands of dollars with your credit cards on a few hundred miles either. We’re going to show you how you can create a life of mobility and freedom by leveraging the skills you already have, tactically selecting your destinations, and using a little known tax secret that will save you thousands of dollars! Sound good? Let’s get to it.
It’s hard to be different. We realize that.
Sometimes, in order to create unique stuff, we simply have to work harder, think longer, and research more than our competition.
Here are some ways you can develop that unique voice in your article introduction:
- Share a personal story or fact. You’re the only you there is. You can share a story or experience no one else can. One way to tell such a story is to write, “If you know me…”
- Get your emotions in it. People have an emotional reaction to emotions. When we convey our emotions in our writing, people tend to respond. Besides, emotion is also a unique and personal thing. How do you communicate this in an introduction? Easy: “Want to know how I feel about it? I feel….”
- Share your goals or vision. If you have a guiding goal or vision for life, you can communicate this in your introduction. “That’s one of the reasons we wrote this post. Our goal in life is to…”
- Make a promise. A promise is a personal and attention-grabbing thing. Give your readers a promise, and it will secure their loyalty and their interest. “We promise that we’ll do our dead-level best to….”
Unique isn’t easy . But it’s worth it.
Step 3 – Keep it Simple
We live in a world where most people have an attention span of only a few seconds.
Apparently, our attention span is getting shorter!

After a few seconds, we get bored and move on to the next shiny object.
If you want your readers to make time in their days to read what you have to say, make sure you present things as simply as possible .
Longer articles, of course, deserve longer introductions. But it’s important to respect people’s time and attention. You can’t change what is (people’s short attention spans) by writing a long introduction based on what should be (longer attention spans).
Avoid rambling about how great your information is, and just share it already!
Step 4 – Speak Directly to the Reader
Whenever you are writing educational material for other people, you want to use the word “you” as much (and as naturally) as possible.
In this article, We’ve used some variation of the word you more than 100 times. Why? Because we’re talking to you! We want you to know this information. We want you to benefit from it.
By emphasizing the word “you” in your article, you show the reader you are directly addressing them and their situation and not just writing a generic article to the general populace.
But there’s another side to this. I should refer to myself as well. My goal is to convey a personal feel to this article. After all, it’s me talking to you, right? So it’s only natural that I would refer to myself too — although more sparingly.
Step 5 – Explain What the Article is About
The point of an introduction is exactly that: to introduce the content that will be presented in an article.
We cannot tell you the number of times online articles left us confused even after we had read a few of their paragraphs.
We couldn’t tell whether the authors were teaching us how to run successful Facebook ads , or telling us a weird story about their childhood.
That’s why its crucial to take a few sentences, and clearly explain what the article is going to cover without giving away too many details.
This will build suspense around the subject matter while still letting your audience know what they may be in for.
A great example of this comes from the Buffer blog. Notice how the introduction poses a question and then proposes to answer that question.

Your curiosity stays high, but the introduction sets the stage.
Explain the importance of the article
Once you’ve explained what the article is, now it’s time to explain why people should care.
Everyone on the Internet approaches every new piece of information with a simple question: “ What’s in it for me ?”

If you want to write introductions that hook the reader and help your content go viral , you have to master the art of explaining what the reader stands to gain from the information you are sharing.
How will it benefit your readers’ lives? How will it solve a problem they are facing? How will it cure a pain they are feeling?
If you understand how to quickly and efficiently answer these questions, you’ll keep your readers glued to your article till the last word.
Few things can make or break your article as easily as an introduction.
If you can master the art of the first few paragraphs, you’ll be able to increase reader engagement, improve sales, and earn a reputation as a phenomenal writer.
It’s not an easy skill to master, but like many things in Internet marketing, it’s fairly straightforward.
If you put in the work, you’ll get results.
Privacy Overview

An official website of the United States government
The .gov means it’s official. Federal government websites often end in .gov or .mil. Before sharing sensitive information, make sure you’re on a federal government site.
The site is secure. The https:// ensures that you are connecting to the official website and that any information you provide is encrypted and transmitted securely.
- Publications
- Account settings
Preview improvements coming to the PMC website in October 2024. Learn More or Try it out now .
- Advanced Search
- Journal List
- J Minim Access Surg
- v.15(3); Jul-Sep 2019
How to write an article: An introduction to basic scientific medical writing
Anil sharma.
Department of Minimal Access, Metabolic and Bariatric Surgery, Institute of Minimal Access, Metabolic and Bariatric Surgery, Max Healthcare Institute Ltd., Saket, New Delhi, India
An original scientific article published in a peer-reviewed professional journal of repute provides great personal satisfaction, adds stature and endows professional respectability to contributing authors. Various types of surgical publications that exist nowadays are case report, cohort study, case–control study, randomised controlled trial narrative review, systematic review, Cochrane review, meta-analysis, editorials and leading articles. A study/research protocol is a standardised document, common to all research projects that typically comprise study objectives, study design, selection of participants, study intervention, study evaluations, safety assessments, statistics and participant rights committees. Once the study protocol is completed and reviewed, it is submitted to the local Institutional Review Board/Institutional Ethics Committee for approval. An outline of the levels of evidence and grades of recommendation is available from the Centre for evidence-based medicine at the University of Oxford. A standardised, structured template exists for scientific presentations in the field of medicine which is also followed in medical writing and publications Introduction Methods Results And Discussion (IMRAD). Instructions to authors would normally include reference to International Committee of Medical Journal Editors and Committee on Publication Ethics guidelines for good and ethical publication practice. It is strongly advised to follow the recommended guidelines appropriate for the published study.
INTRODUCTION
The impact of the published article in a scientific journal of repute is powerful and protracted for as Kenneth Rothman states, ‘The written word reaches the widest audience and constitutes the archival message’. Authorship in a scientific journal implies that the authors have critically analysed and presented a scientific work of merit. ‘Reading maketh a full man, conference a ready man and writing an exact man’, (Francis Bacon). With scientific publishing, surgeons make their contributions to the profession for wide dissemination within their community and in the process create intellectual property that will be preserved down the ages. ‘The universal object of men of letters is reputation’, said John Adams.
A majority of practicing surgeons would not write and would remain engaged in busy surgical practices, bread winning and increasing administrative responsibilities. However, an increasing segment of surgeons in training and academic surgeons now feel the need to write and publish. The reasons for writing and publishing are both egoistic and altruistic.[ 1 ] Egoistic motives are the desire to progress academically and professionally, improve status and develop professional contacts. Altruistic motives are dissemination of knowledge and a moral obligation to publish a significant novel observation in the larger interest of better patient care. In several institutions, for academic appointments and promotions, the pressures to publish are sometimes inordinate. In many teaching institutions, to progress academically to whatever academic title one aspires, one's published output must constantly grow in number and quality. However, good-quality writing and publishing are not just in the domain of academic institutions. Several astute clinicians with clarity of vision from non-academic institutions have made significant contributions to surgical literature. It is imperative that contributions to surgical literature are derived from surgeons (academic and non-academic) at various locations (different continents, regions and nationalities) and workplaces (urban, semi-urban and rural). Such literature would be more relevant to the real world as opposed to surgical practice in highly sophisticated ivory towers. In the final analysis, an original scientific article published in a peer-reviewed professional journal of repute provides great personal satisfaction adds stature and endows professional respectability to contributing authors.
MANUSCRIPT TYPES
‘You don’t write because you want to say something; you write because you have something to say’, (Scot Fitzgerald). The essence of fine surgical writing is to write what you as a surgeon would want to read. Enumerated below is a list of various types of surgical publications that exist nowadays arranged in the order of increasing complexity.
- Letter/communication to the Editor
Case report
Cohort study (non-randomised, observational study), case–control study (non-randomised, observational study).
- Randomised controlled trial (RCT)
Narrative review
Systematic review and cochrane review, meta-analysis.
- Editorials and leading articles.
Letter/communication to the editor
This would be with reference to an article that has previously been published. The letter should be polite, constructive and should provide comments that offer a novel perspective of the published article. The comments should add, detract or critically review the contents of the published article in a fair and reasonable manner. The objective is to closely focus on and examine critical issues that may not have been appropriately addressed.
Many esteemed surgical writers, even journal editors, began a literary career with a time-honoured case report.[ 2 ] The humble case report would probably be the first step that an aspiring surgeon takes in surgical writing. Unfortunately, pressure of space and editorial policies directed at enhancing the impact factor of individual journals have reduced the opportunities for publication of case reports.[ 3 ]
The cohort study, case–control study and RCT constitute ‘original articles’ in surgical publications. The narrative review, systematic review and meta-analysis are ‘review articles’.
A cohort study is when patients are followed forward and assessed from time of exposure until time of consequences of exposure (target outcome). An example is ‘initial experience with single incision laparoscopic cholecystectomy.’
A case–control study is when patients are selected once they have the target outcome or not and researchers look backward to try to determine the factors of exposure. An example is ‘bile duct injury with single incision laparoscopic cholecystectomy.’
Randomised controlled trial
An RCT is performed when investigators want to assess treatment effects, usually considered to be beneficial. An example is ‘an RCT comparing recurrence rates between laparoscopic hernioplasty and Shouldice repair for groin hernias’.
A cohort study is feasible when randomisation of exposure is not possible. A case–control study overcomes temporal delays and may only require small sample size. However, both these studies are susceptible to bias and therefore have limited validity. The advantage of an RCT is that it provides the highest level of evidence. It is therefore useful to disprove efficacy which is important in the present era of technology-driven surgery. There is immense pressure from the manufacturers to use devices and procedures, many of which may not measure up to the scientific scrutiny of a well-conducted RCT. The design and execution of an RCT in surgery, however, is fraught with several difficulties and challenges. The nature of treatment by surgical intervention may lead to ethical issues that make design of the study difficult. Moreover, surgical skills and competence may vary from one hospital and surgeon to another making comparison odious. In most surgical studies, blinding of procedure from assessor is very difficult, and therefore, bias is inevitable.
A narrative review is usually written by invitation to an expert. The expert objectively reviews the subject in a concise and impartial manner. He/she addresses new developments and summarises recent literature. A narrative review leaves an imprint of the approach and thought process of the expert on the subject.
A systematic review involves more rigorous compilation of evidence. A systematic review is designed to present complete and unbiased evidence on the subject that presently exists in the literature. Strict adherence to follow and complete all components of a clearly defined protocol is mandatory.
A meta-analysis is a type of systematic review that uses statistical methods to combine and summarise the results of clinical trials. A meta-analysis must always include a formal examination of heterogeneity as an indicator of similar or divergent results.
Editorials and leading articles
These are usually written by invitation on a specific research area. The opinion and judgement of the editor do not only be based on review of literature but also carry the imprimatur of his/her personal beliefs and experience.
EVIDENCE-BASED MEDICINE
We live in an era of evidence-based medicine where increasingly an evidence-based approach to surgical practice would dictate the refining of systems and processes of patient care. Evidence-based practice is the, explicit and judicious use of the current best evidence in making decisions about the care of individual patients’.[ 4 ] An outline of the levels of evidence and grades of recommendation is available from the Centre for evidence-based medicine at the University of Oxford[ 5 , 6 ] Table 1 describes the levels of evidence for therapeutic studies.[ 7 ]
Levels of evidence for therapeutic studies
CONSTRUCTING THE MANUSCRIPT
‘If you can’t explain it simply, you don’t understand it well enough’, (Albert Einstein).
At the outset, formulation of the study/research protocol is required. The study/research protocol is a standardised document, common to all research projects that should be available in teaching institutions. The protocol template typically comprises the following.
- Study objectives
- Study design
- Selection of participants
- Study intervention
- Study evaluations
- Safety assessments
- Participant rights
- Committees.
Once the study protocol is completed and reviewed, it is submitted to the local Institutional Review Board (IRB)/Institutional Ethics Committee (IEC) for approval. Written consent is obtained and the study is registered at the Clinical Trial Registry of India at www.ctri.in .
‘If you don’t know where you are going, you will end up someplace else’, (Yogi Berra).
A standardised, structured template exists for scientific presentations in the field of medicine, and this is also followed in Medical writing and publications Introduction Methods Results And Discussion (IMRAD).
- Introduction: Why did we start?
- Methods: What did we do?
- Results: What did we find?
- Discussion: Hence, what does it mean?
Enumerated below are the constituent segments and contents therein in an original article of a scientific medical manuscript.
Introduction (two paragraphs)
The Introduction commences with a brief lesson on the subject as described in literature. Current knowledge, insights and recent developments on the subject are briefly stated. A lacuna or gap in knowledge or incomplete information on some aspect of the subject forms the basis and reason to perform the present research/study. The last line in the Introduction section normally reads ‘The aim of this study was…’, ‘We report… or ‘We reviewed…’.
Methods (seven paragraphs)
The Methods section narrates the story of what the authors did. The narration is arranged in a logical framework of time. A logical sequence for presentation is ethical approval, patient selection, surgical intervention, outcome assessments and statistical methods employed.
Results (six paragraphs)
The Results Section is an overall description of the major findings of the study. The Results section presents measurements and data on all stated end-points (primary and secondary) of the study. Data presentation should be clear and concise.
Discussion (seven paragraphs)
The Discussion section summarises the article and presents a perspective of the message in the article. The first paragraph provides a summary of the main aim, methods and results of the study. The last paragraph provides a tentative answer to the research question posed in the study and also a suggestion for future research in a related area of the study. The limitations of the present study are discussed (e.g. nature of study, numbers of patients and limited follow-up). The strengths of the present study, if any, may be enumerated. Similar studies in the literature are discussed and how the present study fits in is analysed. The implications of the present study are discussed in terms of future research, change in patient management policies and suggested amendments to clinical practice.
The title should be descriptive yet concise while conveying the essential features of the contents of the article. The title should contain words that will make the article accessible to workers in the field. Clarity, brevity and above all human interest are the hallmarks of a good title.
Titles and abstracts are freely available to browse across a wide array of databases on the Internet. An attractive title and a concise abstract serve to attract the attention of readers. The abstract serves as a stand-alone summary that describes the major contents and message of the article. The abstract is structured (IMRAD) with a strict word limit. It serves as a quick reference and shortcut for busy researchers.
Keywords are short phrases that capture the main topics of the article. These follow the abstract in the article. Keywords assist in cross-indexing and literature search.
Most journal editors subscribe to guidance from the International Committee of Medical Journal Editors (ICMJE)[ 8 ] also known as the Vancouver group. Contributors who meet all four of the below-mentioned criteria qualify for authorship.
- Substantial contributions to the conception or design of the work or the acquisition, analysis or interpretation of data for the work
- Drafting the work or revising it critically for important intellectual content
- Final approval of the version to be published
- Agreement to be accountable for all aspects of the work.
Acknowledgements
Those whose contributions do not justify authorship may be acknowledged and their contributions should be specified (e.g., ‘served as scientific advisors’, ‘critically reviewed the study proposal’, ‘collected data’, ‘provided and cared for study patients’ and ‘participated in writing or technical editing of the manuscript’).[ 8 ]
Conflict of interest
The ICMJE states that ‘a conflict of interest exists when professional judgement concerning a primary interest (such as patient's welfare or the validity of research) may be influenced by a secondary interest (such as financial gain)’. Public trust in the scientific process and the credibility of published articles depend in part on how transparently conflicts of interest are handled during the planning, implementation, writing, peer review, editing and publication of scientific work. Financial relationships (such as employment, consultancies, stock ownership or options, honoraria, patents and paid expert testimony) are the most easily identifiable conflicts of interest and the most likely to undermine the credibility of the journal, the authors, and science itself.[ 8 ]
A reference to articles serves to guide readers to a connected body of literature. Conference abstracts should not be used as references. They can be cited in the text, in parentheses, but not as page footnotes. References to papers accepted but not yet published should be designated as ‘in press’ or ‘forthcoming’. Information from manuscripts submitted but not accepted should be cited in the text as ‘unpublished observations’ with written permission from the source. Avoid citing a ‘personal communication’ unless it provides essential information not available from a public source, in which case the name of the person and date of communication should be cited in parentheses in the text.[ 8 ]
INSTRUCTIONS TO AUTHORS
It is mandatory to read and follow ‘Instructions to Authors’ provided by the journal where the manuscript is being sent for evaluation. Journals require electronic submission of manuscripts through specially designed editorial software (e.g. edition manager, manuscript central). The instructions provide detailed submission guidelines to Authors for submission of manuscripts. Instructions would normally include reference to ICMJE what an editor expects…pg 1124[ 9 ] and Committee on Publication Ethics (COPE) Guidelines[ 10 ] for good and ethical publication practice.
REPORTING GUIDELINES
It is strongly advised to follow recommended guidelines appropriate for the published study. These guidelines set international standards for reporting different types of research studies. A good checklist is provided for preparing the publication. The guidelines standardise trial design, facilitate accurate reporting and correct interpretation of results [ Table 2 ].[ 11 ]
Reporting guidelines for main study types
ROLE OF BIOSTATISTICIAN
The biostatistician provides invaluable input, advice and suggestions in construction of the manuscript. He/she should be consulted right from the concept and planning stage. He/she assists in protocol development with study design and study evaluations. He/she plans data management by confirming assessment of data on primary and secondary end-points of the study. He/she supervises data collection, archival and analysis. He/she implements and monitors the study on a periodic basis to its conclusion. Finally, the biostatistician assists with reporting results during writing of the manuscript.
DATA MANAGEMENT
Data management is the strategy used for collecting, organising and analysing data. The ultimate aim of conducting a study is to generate data to provide answers to the research question. The quality of data generated plays an important role in the outcome of the study. It follows that if primary data collection and entry are not considerate and meticulous, subsequent data analysis for outcome measures would not be satisfactory. Data need to be ultimately stored in electronic data capturing systems for ease of data management and analysis.
Several data analysis software systems are available that provide statistical results when data are fed into then in a predetermined format (Analyse-it, SPSS, WINKS SDA, Stata, Vitalnet).
WRITING STYLE
An effective writing style is easy to read and simple to understand. The connoisseur writer filters out unnecessary details and distills the essence of his/her communication in the manuscript. A short manuscript presented clear and lucidly is the most effective. Simple sentences in straightforward language convey the most information. A short sentence is easier to read and comprehend than a long rambling one, short, simple and familiar words are more reader-friendly than longer complicated phrases (replace ‘illustrate’ with ‘show’, ‘fundamental’ with ‘basic’ and ‘remainder’ with ‘rest’). A spell check and grammar check are mandatory after completing the manuscript.
New information is provided in a new paragraph. The main point appears at the start and should be clear, succinct and easy to find. The author consciously needs to avoid elitism/triumphalism in the article (the first report, the only study, the largest cohort). Exclamation and quotation marks are avoided in a formal medical manuscript. Proper punctuation marks such as full stops and commas are mandatory.
Text verbatim (copy and paste) from a previously published article or book must be marked as reference source. The author needs to follow the reference style required for submission to the journal. The Vancouver system[ 12 ] is the most commonly used. Abbreviations (INR – international normalised ratio, PT – prothrombin time) and acronyms (IMV – inferior mesenteric vein) should always be defined the first time they are used in the text. Abbreviations are useful to avoid unnecessary and frequent use of long phrases in the text. However, their use should be restricted in the text and never used in the title and abstract. In figures, abbreviations need to be explained in the legend and for tables in the footnote.
Tables and figures must be sufficiently clear, well labelled and interpretable without having to refer to the text. These should be placed in the text as near as possible to the place where they are referred to. Tables should not be used when data can be summarised in text (e.g. population sizes, sex ratios) or where data are better represented in graphs and figures. The legend carries descriptive information on the tables and figures to make them understandable as stand-alone segments. Table legends are placed above the body of the table, and figure legends are placed below the figures. Footnotes in a table explain abbreviations and P values.
PUBLICATION ETHICS
The COPE was founded in 1997 as a voluntary body to attempt to define best practice in the ethics of scientific publishing. The COPE guidelines on good publication practice are useful for authors, editors, editorial board members, readers, owners of journals and publishers. They address study design and ethical approval, data analysis, authorship, conflicts of interest, peer-review process, redundant publication, plagiarism, duties of editors, media relations, advertising and how to deal with misconduct.
- Study design and ethical approval: Good research should be well justified, well planned appropriately designed and ethically approved. To conduct research to a lower standard may constitute misconduct
- Data analysis: Data should be appropriately analysed, but inappropriate analysis does not necessarily amount to misconduct. Fabrication and falsification of data do constitute misconduct
- Authorship: There is no universally agreed definition of authorship although attempts have been made. As a minimum, authors should take responsibility for a particular section of the study
They may be personal, commercial, political, academic or financial. ‘Financial’ interests may include employment, research funding, stock or share ownership, payment for lectures or travel, consultancies and company support for staff
- Peer review: Peer reviewers are external experts chosen by editors to provide written opinions, with the aim of improving the study. Working methods vary from journal to journal, but some use open procedure in which the name of the reviewer is disclosed, together with the full or ‘edited’ report
- Redundant publication: Redundant publication occurs when two or more papers, without full cross-references, share the same hypothesis, data, discussion points, or conclusions
- Plagiarism: Plagiarism ranges from the unreferenced use of others published and unpublished ideas, including research grant applications to submission under ‘new’ authorship of a complete paper, something in a different language. It may occur at any stage of planning, research writing or publication: It applies to print and electronic versions
- Duties of editors: Editors are stewards of journals. They usually take over their journal from the previous editor(s) and always want to hand over the journal in good shape. Most editors provide direction for the journal and build a strong management team. They must consider and balance the interests of many constituents, including readers, authors, staff, owners, editorial board members, advertisers and the media
- Media relations: Medical research findings are of increasing interest to the print and broadcast media. Journalists may attend scientific meetings at which preliminary research findings are presented, leading to their premature publication in the mass media
- Advertising: Many scientific journals and meetings derive significant income from advertising. Reprints may also be lucrative.
Financial support and sponsorship
Conflicts of interest.
There are no conflicts of interest.
Click through the PLOS taxonomy to find articles in your field.
For more information about PLOS Subject Areas, click here .
Loading metrics
Open Access
Peer-reviewed
Research Article
Mind to move: Differences in running biomechanics between sensing and intuition shod runners
Contributed equally to this work with: Cyrille Gindre, Aurélien Patoz, Bastiaan Breine, Thibault Lussiana
Roles Conceptualization, Writing – review & editing
Affiliations Research and Development Department, Volodalen, Chavéria, France, Research and Development Department, Volodalen SwissSportLab, Aigle, Switzerland, MPFRPV, Université de Franche-Comté, Besançon, France, Exercise Performance Health Innovation (EPHI) Platform, Besançon, France
Roles Data curation, Formal analysis, Writing – original draft, Writing – review & editing
* E-mail: [email protected]
Affiliations Research and Development Department, Volodalen SwissSportLab, Aigle, Switzerland, Institute of Sport Sciences, University of Lausanne, Lausanne, Switzerland
Roles Data curation, Formal analysis, Writing – review & editing
Affiliations Research and Development Department, Volodalen SwissSportLab, Aigle, Switzerland, Department of Movement and Sports Sciences, Ghent University, Ghent, Belgium
Roles Conceptualization, Data curation, Formal analysis, Writing – original draft, Writing – review & editing
- Cyrille Gindre,
- Aurélien Patoz,
- Bastiaan Breine,
- Thibault Lussiana
- Published: April 3, 2024
- https://doi.org/10.1371/journal.pone.0300108
- Peer Review
- Reader Comments
Delving into the complexities of embodied cognition unveils the intertwined influence of mind, body, and environment. The connection of physical activity with cognition sparks a hypothesis linking motion and personality traits. Hence, this study explored whether personality traits could be linked to biomechanical variables characterizing running forms. To do so, 80 runners completed three randomized 50-m running-trials at 3.3, 4.2, and 5m/s during which their running biomechanics [ground contact time ( t c ), flight time ( t f ), duty factor (DF), step frequency (SF), leg stiffness ( k leg ), maximal vertical ground reaction force ( F max ), and maximal leg compression of the spring during stance (Δ L )] was evaluated. In addition, participants’ personality traits were assessed through the Myers-Briggs Type Indicator (MBTI) test. The MBTI classifies personality traits into one of two possible categories along four axes: extraversion-introversion; sensing-intuition; thinking-feeling; and judging-perceiving. This exploratory study offers compelling evidence that personality traits, specifically sensing and intuition, are associated with distinct running biomechanics. Individuals classified as sensing demonstrated a more grounded running style characterized by prolonged t c , shorter t f , higher DF, and greater Δ L compared to intuition individuals ( p ≤0.02). Conversely, intuition runners exhibited a more dynamic and elastic running style with a shorter t c and higher k leg than their sensing counterparts ( p ≤0.02). Post-hoc tests revealed a significant difference in t c between intuition and sensing runners at all speeds ( p ≤0.02). According to the definition of each category provided by the MBTI, sensing individuals tend to focus on concrete facts and physical realities while intuition individuals emphasize abstract concepts and patterns of information. These results suggest that runners with sensing and intuition personality traits differ in their ability to use their lower limb structures as springs. Intuition runners appeared to rely more in the stretch-shortening cycle to energetically optimize their running style while sensing runners seemed to optimize running economy by promoting more forward progression than vertical oscillations. This study underscores the intriguing interplay between personality traits of individuals and their preferred movement patterns.
Citation: Gindre C, Patoz A, Breine B, Lussiana T (2024) Mind to move: Differences in running biomechanics between sensing and intuition shod runners. PLoS ONE 19(4): e0300108. https://doi.org/10.1371/journal.pone.0300108
Editor: Yaodong Gu, Ningbo University, CHINA
Received: November 7, 2023; Accepted: February 21, 2024; Published: April 3, 2024
Copyright: © 2024 Gindre et al. This is an open access article distributed under the terms of the Creative Commons Attribution License , which permits unrestricted use, distribution, and reproduction in any medium, provided the original author and source are credited.
Data Availability: The datasets for this study are freely available using the access link https://github.com/aurelienPatoz/we-run-the-way-we-are .
Funding: The author(s) received no specific funding for this work.
Competing interests: No authors have competing interests.
Introduction
Embodied cognition, a compelling theoretical framework in cognitive science, challenges conventional notions that divorce the mind from the body [ 1 ]. This paradigm asserts a symbiotic relationship between cognitive processes and the physical body, underscoring the significance of sensory and motor experiences in shaping mental functions [ 2 ]. Unlike traditional views that confine cognition to the brain, embodied cognition recognizes the profound impact of the body’s interactions with the environment on cognitive phenomena [ 3 ]. This approach emphasizes both bottom-up processes, where sensory information informs cognitive processes, and top-down influences, where higher-order cognitive functions shape our perception and interaction with the world.
Exploring the intricate dynamics of embodied cognition sheds light on the reciprocal influence between the mind, body, and the vibrant world they jointly navigate. For example, an investigation revealed that the extraverted-introverted continuum influences upright posture, with 96% of extraverted individuals maintaining an “ideally aligned” posture, while 83% of introverted individuals exhibit a kyphosis-lordosis posture [ 4 ]. Furthermore, higher levels of extraversion and conscientiousness have been linked to increased physical activity levels [ 5 ] and to faster walking speeds [ 6 , 7 ], suggesting that the way individuals move may reflect their underlying personality traits. Conscientiousness, notably, has shown the capacity to mitigate the age-related decline in walking speed [ 6 , 8 ]. Research has also uncovered that personality traits manifest in an individual’s walking gait [ 9 ]. For instance, it was observed that greater pelvis motion in the horizontal plane during walking is associated with greater agreeableness in females, while, for males, greater thorax motion in the horizontal plane is linked with extraversion [ 9 ]. Since there were no significant distinctions in the horizontal motion of the thorax and pelvis between females and males, these correlations might be influenced by individual personalities, thus removing the influence of gender [ 9 ]. In a recent development, machine learning techniques were employed with notable accuracy to assess personality traits through the analysis of gait recorded using videos [ 10 ] or smartphone sensors [ 11 ].
Extending this line of inquiry into the realm of running, research on middle-aged male runners has identified common personality profiles and associated positive self-perception with long-term involvement in running and training [ 12 ]. Runners demonstrated heightened intelligence, creativity, self-sufficiency, sobriety, and forthrightness compared to the general population, embodying traits of introversion, shyness, and a propensity for imaginative pursuits in their personality composition [ 13 ]. Besides, a prospective study found that runners with high scores on the type A behaviour (characterized by agitation, hostility, rapid speech, and an extremely competitive nature) screening questionnaire experienced significantly more injuries, especially multiple injuries [ 14 ]. Nonetheless, limited information on the personality of recreational runners is available, primarily derived from older studies, and to the best of the author’s knowledge, with no recent research on this topic. This underscores the imperative for contemporary, original research specifically addressing the personality traits of recreational runners [ 15 ].
Personality traits could be effectively classified into one of two possible categories along various axes using the Myers-Briggs Type Indicator (MBTI) test, a tool rooted in Jungʼs psychology [ 16 ]. Notably, there is no superior category in each MBTI axis. Additionally, recent research suggested that the duty factor (DF) plays a pivotal role in illustrating two distinct spontaneous running forms in recreational runners, i.e., runners with either low or high DF [ 17 , 18 ]. DF represents the proportion of time spent in contact with the ground during a running stride and could be considered as a global variable to describe the running pattern. Both running forms (low or high DF runners) could be efficiently employed at endurance running speeds, leading to similar running economy measures [ 17 ]. Low DF runners were shown to exhibit a shorter contact time ( t c ), larger vertical oscillation of the center of mass during flight time ( t f ), and more anterior (midfoot and forefoot) strike pattern, favoring elastic energy reuse. Conversely, high DF runners demonstrated a longer t c , more rearfoot strike pattern, and reduced work against gravity to promote forward progression. Similarly, decreasing and increasing t c could represent two opposing yet efficient strategies for enhancing running economy [ 19 , 20 ]. The first strategy involves an increase in vertical stiffness to improve running economic [ 19 ] while the second strategy posits that generating force over a longer period might be more economical [ 20 ]. Consequently, one may contemplate whether each of these running strategies could be associated with a specific personality trait category.
In the present study, we delve into the intriguing realm of embodied cognition by exploring whether an intricate connection could exist between personality traits and the spontaneous running patterns of shod runners. Indeed, the aim of this study was to explore whether the two categories of personality traits within the various MBTI axes could be linked to biomechanical variables that characterize two distinct running forms naturally embraced by individuals. This exploration should shed light on the complex relationship between the mind and motion. We hypothesized that personality traits would demonstrate association with spontaneous running patterns.
Materials and methods
Participants.
Eighty recreational endurance runners with regular running training, 67 males (age: 29.3 ± 11.1 years, height: 178.2 ± 6.4 cm, body mass: 72.0 ± 8.5 kg, and weekly running hours: 6.4 ± 3.8 h/week) and 13 females (age: 29.8 ± 11.6 years, height: 167.2 ± 6.9 cm, body mass: 60.8 ± 9.1 kg, and weekly running hours: 8.5 ± 7.8 h/week), participated in this study. All runners identified as Caucasians. To ensure diverse participation in the study, we sought a heterogeneous panel of runners with varying training backgrounds. Consequently, participants were only mandated to run a minimum of one hour per week and maintain good self-reported general health, without any current or recent (<6 months) musculoskeletal injuries. However, nothing specific about their spontaneous running pattern such as their foot-strike pattern was required because the running pattern is assumed to be a global system with several interconnected variables [ 17 , 18 , 21 , 22 ]. All participants completed the study on a voluntary basis. The university’s institutional review board (Comité de Protection des Personnes Est 1 (CPP EST 1) approved the protocol prior to participant recruitment (ID RCB 2014-A00336-41), and the study was conducted in accordance with the latest amendments of the Declaration of Helsinki. Participants were recruited between the September 1 st and November 30 th of 2014. Each participant underwent two experimental sessions within one week: a running biomechanical analysis during the first session, and a personality traits assessment during the second one. All participants wore their habitual running shoes during the biomechanical analysis.
Assessment of biomechanical variables
After providing written informed consent, participants performed a 10-min warm-up run at a self-selected speed (range: 2.5–3.5 m/s) on an indoor athletic track. Subsequently, participants completed three randomized 50-m running-trials at speeds of 3.3, 4.2, and 5 m/s starting from a standing-still position (2-min rest period between trials). These running speeds were chosen because they represent the 10-km race pace of most of endurance runners [ 23 ]. Speed was monitored using photoelectric cells (Racetime2, MicroGate, Timing and Sport, Bolzano, Italy) placed at the 20 and 40-m marks. No participants showed difficulty in running at the requested paces. A running trial was accepted if the monitored speed was within ± 5% of the requested speed and repeated otherwise after a 2-min rest period. Less than 15% of the trials were discarded. The Optojump ® photoelectric cells (MicroGate Timing and Sport, Bolzano, Italy) were used to measure t c (in ms) and t f (in ms) between the 20 and 40-m marks. The cells consist of two parallel bars which were set 1 m apart and were connected to a personal computer. One bar acts as a transmitter unit containing light emitting diodes positioned 3 mm above the ground, whereas the other bar acts as the receiver unit. When the light is interrupted by an individual’s foot during running, a timer within the Optojump system records time with a precision of 1 ms (sampling frequency of 1000 Hz). This allows measuring t c as the time that the light is interrupted and t f as the time between interruptions. As for each participant, the average value over the 20-m distance was computed for t c and t f and used in what follows. The test-retest reliability of the Optojump system was demonstrated to be excellent, with low coefficients of variation (2.7%) and high intraclass correlation coefficients (range: 0.982 to 0.989) [ 24 ].
Assessment of personality traits
Based on the answers to 93 questions, the MBTI classifies personality traits into one of two possible categories along four axes: extraversion-introversion (favorite world); sensing-intuition (information processing preference); thinking-feeling (decision making); and judging-perceiving (structure). Together, these axes influence how an individual perceives a situation and decides on a course of action. The MBTI has demonstrated excellent stability with test-retest correlations between 0.83 and 0.97 over a 4-week interval, exceeding the stability of many established trait measures, and between 0.77 and 0.84 over a 9-month interval [ 29 ]. Moreover, each dichotomy showed an agreement of 84 to 96% over 4 weeks, with a median agreement of 90% [ 16 ]. Given potential context-dependent results of the MBTI [ 29 ], the personality traits of participants were reassessed through a face-to-face meeting lasting approximately one hour, conducted by an MBTI-certified practitioner, to ensure data quality.
Sample size calculations determined that 80 participants were required for this study, assuming moderate effect sizes (~0.5) for biomechanical differences between MBTI axes, an α error of 0.05, and a power of 0.8 [ 30 ] and was obtained using G*Power (v3.1, available at https://www.psychologie.hhu.de/arbeitsgruppen/allgemeine-psychologie-und-arbeitspsychologie/gpower ) [ 31 ]. Descriptive statistics are presented as mean ± standard deviation. Data normality and homogeneity of variance were evaluated using Kolmogorov-Smirnov and Levene’s tests, respectively. Participant characteristics were compared along each MBTI axis using ANOVA and non-parametric ANOVA when data normality was not verified. Repeated-measures ANOVA (speed x MBTI axes) with Mauchly’s correction for sphericity and employing Holm corrections for pair-wise post-hoc comparisons were used to investigate the effect of each MBTI axis on the biomechanical variables ( t c , t f , DF, SF, k leg , F max , and Δ L ) while accounting for the effect of running speed. 95% confidence intervals [lower, upper] of mean differences (Δs) were calculated for each significant post-hoc comparison along the MBTI axes. Cohen’s d effect sizes were calculated for participant characteristics along the four MBTI axes and for each significant post-hoc comparison. Effect sizes were classified as small , moderate , or large based on the magnitude of d values (0.2, 0.5, and 0.8, respectively) [ 32 ]. Statistical analysis was conducted using Jamovi (v1.6.23, available at https://www.jamovi.org ), with significance set at α ≤ 0.05.
Classifications of participants along the four MBTI axes are reported in Table 1 . Normality and homogeneity of variance were verified for age, height, body mass, and weekly running hours ( p ≥ 0.07; Table 1 ) except for age and weekly running hours which were not normally distributed ( p ≤ 0.04; Table 1 ). ANOVA and non-parametric ANOVA results indicated no main effect of the MBTI axes on age, height, body mass, and weekly running hours ( p ≥ 0.07; Table 1 ), suggesting that these characteristics were similar across each MBTI axis. Effect sizes were small for age, height, body mass, and weekly running hours between the categories of each MBTI axis (| d | ≤ 0.27; Table 1 ), except for weekly running hours of the extraversion-introversion axis, and height and body mass of the thinking-feeling axis which were moderate (0.40 ≤ | d | ≤ 0.66; Table 1 ).
- PPT PowerPoint slide
- PNG larger image
- TIFF original image
Significant differences ( p ≤ 0.05) are indicated in bold. Participant characteristics along each MBTI axis were compared using ANOVA and non-parametric ANOVA when data normality was not verified. Data normality and homogeneity of variance were evaluated using Kolmogorov-Smirnov and Levene’s tests, respectively.
https://doi.org/10.1371/journal.pone.0300108.t001
Data normality and homogeneity of variance of the biomechanical variables were all verified ( p ≥ 0.07; Table 2 ).
No significant difference was reported ( p > 0.05).
https://doi.org/10.1371/journal.pone.0300108.t002
A speed x sensing-intuition axis interaction effect was observed for t c ( p = 0.02), with no other significant interaction effects reported (other interactions: p ≥ 0.06). Pair-wise post-hoc comparisons revealed significantly shorter t c for intuition runners compared to sensing runners at all running speeds examined ( p ≤ 0.02; Fig 1a ) with moderate to large effect sizes (0.73 ≤ d ≤ 1.02).
a , contact time ( t c ); b , flight time ( t f ); c , duty factor (DF). Intuition runners (blue symbols; left side) exhibited shorter t c ( p = 0.002), longer t f ( p < 0.001), and lower DF ( p < 0.001) than sensing runners (red symbols; right side). A significant speed x sensing-intuition axis interaction effect was observed for t c ( p = 0.02). * Significantly shorter t c for intuition than sensing runners, as reported by the pair-wise post-hoc comparisons ( p ≤ 0.02). Empty circles denote the data of each participant.
https://doi.org/10.1371/journal.pone.0300108.g001
The sensing-intuition axis reported significant differences among the biomechanical variables, leading to sensing runners showing a longer t c (Δ = 13 ms [5 ms, 21 ms]; p = 0.002; small effect size; d = 0.44), shorter t f (Δ = -16 ms [-22 ms, -10 ms]; p < 0.001; moderate effect size; d = -0.73), higher DF (Δ = 2.1% [1.3%, 2.9%]; p < 0.001; moderate effect size; d = 0.66), smaller k leg (Δ = -1.1 kN [-1.5 kN, -0.7 kN]; p = 0.01; moderate effect size; d = -0.68), and larger Δ L (Δ = 1.4 cm [0.7 cm, 2.1 cm]; p = 0.02; moderate effect size; d = 0.55) than intuition runners ( Fig 1 and Table 3 ). The other three axes did not report any significant differences among the biomechanical variables ( p ≥ 0.09).
Significant sensing-intuition axis effects ( p ≤ 0.05) identified by the two-way repeated measures ANOVA are indicated in bold.
https://doi.org/10.1371/journal.pone.0300108.t003
All the biomechanical variables investigated herein ( t c , t f , DF, SF, k leg , F max , and Δ L ) reported a significant running speed effect ( p ≤ 0.02), where t c and DF decreased with increasing speed while t f , SF, k leg , F max , and Δ L increased with increasing running speed.
In this exploratory study, we delved into the relationship between personality traits, as determined by the MBTI and the biomechanical characteristics of runners. On the one hand, our findings revealed distinct differences in running biomechanics between "sensing" and "intuition" runners, supporting our initial hypothesis. Sensing runners adopted a grounded running form characterized by several key biomechanical attributes. They exhibited longer t c , shorter t f , higher DF, and larger Δ L compared to intuition runners. In essence, sensing runners seemed to favor a more earthbound running style. Conversely, intuition runners demonstrated a more dynamic and elastic running form. They displayed shorter t c and larger k leg than their sensing counterparts, indicating a propensity to harness the stretch-shortening cycle and utilize their lower limb structures as efficient springs during each stride. On the other hand, no association was found between running biomechanics and the remaining three MBTI axes, contradicting our initial hypothesis.
Based on the biomechanical variables observed herein (main effect for t c , t f , DF, Δ L , and k leg : p ≤ 0.02, Fig 1 and Table 1 ), sensing runners preferentially adopt a running form that favors a larger forward displacement during t c and smaller vertical displacement of the center of mass during t f compared to intuition runners. In terms of energetics, sensing runners would optimize running economy by promoting forward progression rather than vertical oscillations of the center of mass [ 17 ]. This forward progression strategy characterizes terrestrial runners [ 33 ] as well as high DF runners [ 17 , 18 ]. The linearity of the force-length relationship was shown to significantly decrease with increasing DF, suggesting a lower utilization of the spring-mass model with increasing DF [ 34 ]. These terrestrial and high DF runners were also characterized by an accentuated lower limb flexion during t c and a rearfoot strike pattern [ 17 , 18 , 33 ]. Sensing runners might describe their running form as: “I run very close to the ground to save as much energy as possible”. These individuals, according to the definition provided by the MBTI, should pay attention to physical realities and prefer practical and specific facts, preferably something they could perceive with their physical senses [ 16 , 35 ]. Hence, individuals with a more grounded running form should focus on practical facts (sensing individuals). The "physical contact" down-to-earth aspect of this personality trait seems to be reflected in both the mind and running form of sensing runners.
In contrast, intuition runners preferentially run with a larger vertical displacement of their center of mass during t f than sensing runners. The more elastic running form of intuition than sensing runners, along with their larger k leg , suggested that the re-use of elastic energy was an inherent feature of intuition runners. These individuals were better able to use their lower limb structures as springs, representing one of the multiple functional roles of the musculoskeletal system [ 36 ]. In other words, intuition runners promote the re-use of elastic energy (spring-mass model) and rely on the stretch-shortening cycle to optimize their running economy [ 17 ]. The greater reliance on the spring-mass model was a characteristic of the aerial running form [ 33 ] as well as of low DF runners [ 17 , 18 ]. These aerial and low DF runners were also characterized by an extended lower limb during t c and a forefoot/midfoot strike pattern [ 17 , 18 , 33 ]. Intuition runners might describe their running form as: “I spend energy to fight against gravity because I can use my leg springs to recover energy from each step”. These individuals, according to the definition provided by the MBTI, should pay attention to the meaning and patterns of information, prefer abstract concepts and theories, and make unconscious connections across their disciplines of knowledge [ 16 , 35 ]. Hence, individuals with a more dynamic and elastic running form should focus on abstract things (intuition individuals). While this specific study did not permit drawing causal or predictive conclusions, it highlights the fascinating interaction between an individual’s personality traits and their preferred movement patterns.
Importantly, our study noted that age, height, mass, and weekly running hours did not significantly differ between sensing and intuition runners ( p ≥ 0.07), removing potential confounding variables in our analysis [ 37 , 38 ]. However, it is worth noting that further investigations could explore whether differences in lower limb anatomy, such as tendon length or heel structure, might contribute to these observed biomechanical distinctions. Indeed, tendons and smaller moment arms of the Achilles tendon better support the elastic strategy than muscles and longer moment arms [ 39 ]. In addition, larger thickness and cross-sectional area of both the Achilles tendon and plantar fascia resulted in lower DF in barefoot running [ 40 ]. Hence, such investigations might reveal thicker and slenderer lower limbs, as well as shorter heels in intuition than sensing runners. This preliminary study has raised further questions about potential interactions between body morphology, movement preferences, and personality traits. Besides, given that DF is associated with foot-strike pattern, the degree of lower limb flexion during stance, and external forces [ 17 , 18 , 34 , 41 ], it would be valuable for future studies to investigate the connection between personality traits and these additional biomechanical variables.
It was previously demonstrated that the biomechanical characteristics of aerial and terrestrial running forms relate to feelings of pleasure-displeasure [ 42 ]. Ratings of pleasure-displeasure in runners change according to external variables, e.g., running speed. Feelings of pleasure are positively impacted in runners in situations where they are more biomechanically efficient, i.e., individuals with shorter t c and longer t f prefer running at faster speeds. As locomotion performance reflects trade-offs between different aspects of an individual’s biomechanics and environmental conditions [ 43 ], and that these aspects are linked with feelings of pleasure-displeasure, we could expect that intuition and sensing runners would take more pleasure at faster and slower running speeds, respectively. This assumption aligns with the MBTI description of both personality traits, where intuitive individuals are described as people living in the fast world of future possibilities, and sensing individuals as people living in the slow world of concrete things [ 16 ]. With such an integrative perspective that considers an individual’s movement patterns and environmental conditions, we can speculate that sensing and intuition runners would prefer different environments, supporting the theoretical framework of embodied cognition [ 2 , 3 ]. For instance, intuition runners may lean towards shorter and faster running events, opt for harder running surfaces, and favor more minimalist running shoes, whereas sensing runners may gravitate towards longer and slower running events, softer surfaces, and opt for more cushioned running shoes, reflecting their potential connection to DF and, consequently, the intuition-sensing personality. The assumption about the choice of running shoes is in line with previous observations that runners who have attempted barefoot running tend to be more open and less conscientious than shod runners [ 44 ]. Future work may further explore the interaction between personality traits, running biomechanics, and several environmental variables, including ground surface, running speed, and running footwear.
Notwithstanding, understanding the connections between personality traits and movement holds potential public health implications. Indeed, tailoring physical interventions through suitable exercises and instructions could mitigate non-adherence [ 45 ] and variability in responses [ 46 ] to a running training program in the context of a modern sedentary lifestyle. The disparities in running biomechanics associated with sensing and intuition personality traits might result in distinct injury locations or different underlying causes for a given injury. This suggests the need for tailored rehabilitation treatments, as previously advocated [ 47 ]. These observations partially align with findings from a prospective study, indicating that runners characterized by agitation, hostility, rapid speech, and an extremely competitive nature (Type A behavior) encountered significantly more injuries, particularly multiple injuries [ 14 ].
A few limitations to the present study exist. First, no causal or predictive conclusions could be drawn using this specific study’s design, but this study provides valuable information about personality traits and running forms. Then, even though runners were shown to demonstrate their most valid biomechanical running characteristics at their preferred running speed [ 48 ], biomechanical variables were evaluated at fixed running speeds to allow us comparing these variables between individuals. Besides, the MBTI validity has been questioned [ 49 ] and is regarded as a controversial approach [ 50 ], with psychometric limitations [ 51 , 52 ]. Nevertheless, this tool is still the most widely used personality assessment in the world [ 29 , 35 ]. Moreover, MBTI correlates well with the Neuroticism, Extraversion, Openness (NEO) Personality Inventory, another widely used personality assessment tool that examines the Big Five personality traits [ 53 , 54 ] and MBTI has been utilized, though several decades ago, to assess personality traits in middle-age male runners [ 12 ]. The MBTI was preferred over the Big Five in the present study due to its nuanced nature. The MBTI assigns a personality trait among two distinct categories for each axis, as opposed to the Big Five, which merely indicates the absence or presence of a given personality trait. As researchers, we assert that the Big Five tends to involve value judgments, whereas the MBTI assigns one of two possible personality traits to each axis without implying superiority for either. Next, several factors, such as emotion, mood, or facial expression, which were not measured herein, might have partly confounded the results of the present study. For instance, Williams, Exell [ 55 ] reported that sadness might increase running asymmetry while anger might facilitate symmetry and Brick, McElhinney [ 56 ] showed that oxygen consumption was lower when smiling than frowning during running and perceived effort was higher when frowning than smiling. However, to the best of authors knowledge, there was no direct scientific evidence that these factors could influence the biomechanical variables measured herein. Moreover, the present study did not account for sex distinctions. Despite utilizing a relatively large sample size ( n = 80), the decision was made not to differentiate between males ( n = 67) and females ( n = 13) to maintain simplicity and ensure an easily comprehensible manuscript, additionally given that separating the genders would have compromised statistical power. Nevertheless, future investigations should prioritize exploring the influence of sex when analyzing the connection between personality traits and running patterns, considering the demonstrated but subtle differences in personality types between males and females [ 57 ]. Furthermore, participants wore their own running shoes during testing, which could be confounding our results. Given that differences in footwear characteristics can underpin differences in running biomechanics [ 58 – 62 ], using a standardized shoe might have led to different study outcomes in terms of running biomechanics. Nonetheless, recreational runners are more comfortable wearing their own shoes [ 63 ], and show individual responses to novel footwear [ 63 , 64 ] and cushioning properties [ 65 ]. Finally, this study did not measure the foot-strike pattern of participants, despite existing biomechanical variations reported among different patterns [ 66 , 67 ]. Notably, forefoot and midfoot strikers exhibited significantly shorter contact times t c compared to heel strikers [ 68 ]. However, it’s crucial to recognize that the foot-strike pattern is just one element within the broader running pattern, encompassing various interconnected variables [ 17 , 18 , 21 , 22 ]. Considering this, runners with a more grounded running form, and associated with sensing personality trait, should exhibit a more rearfoot strike pattern because of the longer t c , while those with a more dynamic and elastic form, often associated with intuition personality trait, should demonstrate a more forefoot/midfoot strike pattern due to the shorter t c . Nevertheless, this statement requires validation through future research.
Conclusions
This exploratory study offers compelling evidence that personality traits, specifically sensing and intuition, are associated with distinct running biomechanics. Sensing runners, who pay attention to physical realities and prefer practical and specific facts, tend to adopt a more grounded running form associated with longer t c , shorter t f , higher DF, and larger Δ L than intuition runners. On the contrary, intuition runners, who prefer abstract concepts and theories, and make unconscious connections across their disciplines of knowledge, tend to opt for a more dynamic and elastic running form with shorter t c and larger k leg than sensing runners.
Supporting information
S1 file. personal protection committee est i..
https://doi.org/10.1371/journal.pone.0300108.s001
Acknowledgments
We thank Dr. Jean-Denis Rouillon and Prof. Laurent Mourot (University of Franche-Comté) for initiating this study. We also thank Dr. Kim Hébert-Losier (University of Waikato, New Zealand) for useful discussions and comments on the manuscript. We thank Stephanie Giordano Assante (MBTI certified practitioner) for the assessment of the personality traits of participants. We are grateful to the many volunteer runners who participated in this experiment.
- 1. Varela FJ, Rosch E, Thompson E. The Embodied Mind: Cognitive Science and Human Experience: The MIT Press; 1991.
- View Article
- Google Scholar
- 3. Schneegans S, Schöner G. 13—Dynamic Field Theory as a Framework for Understanding Embodied Cognition. In: Calvo P, Gomila A, editors. Handbook of Cognitive Science. San Diego: Elsevier; 2008. p. 241–71.
- PubMed/NCBI
- 16. Myers IB, McCaulley M, Quenk N, Hammer A. MBTI manual: a guide to the development and use of the Myers-Briggs Type Indicator. Palo Alto, Calif.: Consulting Psychologists Press; 1998.
- 28. Winter DA. Biomechanics of Human Movement: Wiley; 1979.
- 32. Cohen J. Statistical Power Analysis for the Behavioral Sciences: Routledge; 1988.
- 55. Williams C, Exell T, Al-Abbadey M. The influence of mood during treadmill running on biomechanical asymmetry of the lower-limbs. Proceedings of the 41st International Society of Biomechanics in Sports Conference. 2023.
How to write an introduction section of a scientific article?
Affiliation.
- 1 Department of Urology, Faculty of Medicine, Bezmialem Vakıf University, İstanbul, Turkey.
- PMID: 26328128
- PMCID: PMC4548565
- DOI: 10.5152/tud.2013.046
An article primarily includes the following sections: introduction, materials and methods, results, discussion, and conclusion. Before writing the introduction, the main steps, the heading and the familiarity level of the readers should be considered. Writing should begin when the experimental system and the equipment are available. The introduction section comprises the first portion of the manuscript, and it should be written using the simple present tense. Additionally, abbreviations and explanations are included in this section. The main goal of the introduction is to convey basic information to the readers without obligating them to investigate previous publications and to provide clues as to the results of the present study. To do this, the subject of the article should be thoroughly reviewed, and the aim of the study should be clearly stated immediately after discussing the basic references. In this review, we aim to convey the principles of writing the introduction section of a manuscript to residents and young investigators who have just begun to write a manuscript.
Keywords: Article; introduction; scientific.
This paper is in the following e-collection/theme issue:
Published on 5.4.2024 in Vol 26 (2024)
Evaluation of Large Language Model Performance and Reliability for Citations and References in Scholarly Writing: Cross-Disciplinary Study
Authors of this article:
Original Paper
- Joseph Mugaanyi 1 * , MBBS, MD ;
- Liuying Cai 2 * , MPhil ;
- Sumei Cheng 2 , PhD ;
- Caide Lu 1 , MD, PhD ;
- Jing Huang 1 , MD, PhD
1 Department of Hepato-Pancreato-Biliary Surgery, Ningbo Medical Center Lihuili Hospital, Health Science Center, Ningbo University, Ningbo, China
2 Institute of Philosophy, Shanghai Academy of Social Sciences, Shanghai, China
*these authors contributed equally
Corresponding Author:
Jing Huang, MD, PhD
Department of Hepato-Pancreato-Biliary Surgery, Ningbo Medical Center Lihuili Hospital
Health Science Center
Ningbo University
No 1111 Jiangnan Road
Ningbo, 315000
Phone: 86 13819803591
Email: [email protected]
Background: Large language models (LLMs) have gained prominence since the release of ChatGPT in late 2022.
Objective: The aim of this study was to assess the accuracy of citations and references generated by ChatGPT (GPT-3.5) in two distinct academic domains: the natural sciences and humanities.
Methods: Two researchers independently prompted ChatGPT to write an introduction section for a manuscript and include citations; they then evaluated the accuracy of the citations and Digital Object Identifiers (DOIs). Results were compared between the two disciplines.
Results: Ten topics were included, including 5 in the natural sciences and 5 in the humanities. A total of 102 citations were generated, with 55 in the natural sciences and 47 in the humanities. Among these, 40 citations (72.7%) in the natural sciences and 36 citations (76.6%) in the humanities were confirmed to exist ( P =.42). There were significant disparities found in DOI presence in the natural sciences (39/55, 70.9%) and the humanities (18/47, 38.3%), along with significant differences in accuracy between the two disciplines (18/55, 32.7% vs 4/47, 8.5%). DOI hallucination was more prevalent in the humanities (42/55, 89.4%). The Levenshtein distance was significantly higher in the humanities than in the natural sciences, reflecting the lower DOI accuracy.
Conclusions: ChatGPT’s performance in generating citations and references varies across disciplines. Differences in DOI standards and disciplinary nuances contribute to performance variations. Researchers should consider the strengths and limitations of artificial intelligence writing tools with respect to citation accuracy. The use of domain-specific models may enhance accuracy.
Introduction
In the ever-evolving landscape of scholarly research and academic discourse, the role of technology in aiding and enhancing the research process has grown exponentially. One of the most notable advancements in this regard is the emergence of large language models (LLMs) such as GPT-3.5, which have demonstrated impressive capabilities in generating written content across various domains, including academic writing. These LLMs, powered by vast corpora of text data and sophisticated machine-learning algorithms, have offered researchers and writers a new tool for assistance in crafting scholarly documents [ 1 - 3 ]. LLMs were initially designed and developed to primarily assist in natural language writing. However, since the release of ChatGPT in late 2022, the tool has been adopted in a wide range of scenarios, including customer care, expert systems, as well as literature searches and academic writing. Researchers have already used LLMs to write their academic papers, as demonstrated by Kishony and Ifargan [ 4 ]. While the potential of these tools is evident, it is essential to critically assess their performance, especially in the intricate domains of citations and references, which are the foundation of academic discourse and credibility.
Citations and references serve as the backbone of scholarly communication, providing the necessary context, evidence, and credit to prior works, thus fostering intellectual dialogue and ensuring the integrity of the research process. Accuracy in generating citations and the inclusion of Digital Object Identifiers (DOIs) [ 5 ] are paramount, as they directly influence the traceability and accessibility of cited works. Despite the promise of LLMs, concerns have emerged regarding the reliability and precision of their generated citations and references, raising questions about their suitability as academic writing assistants. Studies on the viability of LLMs as writing assistants in scholarly writing [ 6 - 8 ] underscore the significance of this body of research within the broader academic landscape. Although prior works are quite informative [ 9 - 12 ], there is a lack of an interdisciplinary perspective on citations and references generated by LLMs, which is vital for understanding how LLMs perform across different disciplines.
An increasing number of academics and researchers, especially in countries where English is not a first language (eg, China), are relying on ChatGPT to translate their work into English, research the existing published literature, and even generate citations and references to published literature. Therefore, the aim of this study was to evaluate LLM performance in generating citations and references across two distinct domains, the natural sciences and humanities, by assessing both the presence and accuracy of citations, the existence and accuracy of DOIs, and the potential for hallucination. We aim to provide valuable insights into the strengths and limitations of LLMs in supporting academic writing in diverse research contexts.
The outcomes of this study will contribute to a nuanced understanding of the capabilities and limitations of LLMs as academic writing assistants. Moreover, our findings may inform best practices for researchers and writers who employ these tools in their work, fostering transparency and accuracy in scholarly communication.
LLM Concepts
An LLM is a catch-all term for a machine-learning model designed and trained to understand and generate natural language. LLMs are considered “large” language models due to the sheer number of parameters in the model. A parameter in machine learning is a numerical variable or weight that is optimized through training to map a relationship between the input and the output. LLMs have millions to billions of parameters.
Current LLMs are mostly based on the transformer architecture ( Figure 1 ). However, before transformers were introduced in 2017 [ 13 ], recurrent neural nets (RNNs) were mostly used for natural language processing. One key limitation of RNNs was the length of text they could handle. In 2015, Bahdanau et al [ 14 ] proposed accounting for attention to improve RNN performance with long text. Drawing inspiration for the RNN’s encoder-decoder design, the transformer consists of an encoder and a decoder; however, unlike the RNN, the transformer does not perform sequential data processing and each layer can address all other layers. This allows the transformer model to handle different parts of the input as it processes each part at different stages. This is the mechanism that allows for self-attention in the transformer model.
The way attention works in a transformer model is by computing attention weights for each token, and then the relevance of the token is determined based on the weights. This allows the model to track and assign hierarchical values to each token. Fundamentally, this is similar to how humans process language by extracting the key details out of a chunk of text. This architecture is the linchpin for the majority of LLMs, including the GPT model [ 15 ] that is the basis of OpenAI’s ChatGPT or the bidirectional encoder representations from transformers (BERT) algorithm [ 16 ]. These are broadly categorized into encoder-style and decoder-style transformers, with the former mostly applying to predictive tasks and the latter applying to generative tasks.
Irrespective of the architecture, as an encoder-style or decoder-style transformer, the model is trained on a vast volume of data. The objective is to train a model capable of applying the knowledge gained from the training data to unseen data or situations. This is referred to as generalization. If the model is capable of precise recall of data it has previously been exposed to, this would be memorization and overfitting is said to have occurred. However, this does not mean that memorization is in itself a negative feature. Indeed, there are situations where memorization is preferable to generation such as in the task of information cataloging.

LLMs in Academia
LLMs can handle tasks such as text classification, translation, summarization, and text generation. Since the advent of the internet, and with it the publication of scientific information online, the amount of global academic output exploded, with more than 5 million articles published in 2022 ( Table 1 ). Given the pressure in academia to keep up with developments in one’s field, it is increasingly becoming more difficult to track, prioritize, and keep up with scientific information. It is against this backdrop that LLMs offer an opportunity. Perhaps the most obvious use case is in literature reviews and summarization, reference lookup, and data generation.
However, there are still several questions that need to be answered. First, machine-learning models are inherently probabilistic, meaning that they are not deterministic. Therefore, for the same user input, the model may give different results due to the variability baked into the model. While this can be a valuable trait for creative endeavors, in academic and scientific works, there is a need for reproducibility and reliability, and it remains unclear how well this can be achieved. Second, LLMs are constrained to the information they are trained on. This can be affected by selection bias, the quality of data used, artifacts resulting from data cleaning, and other factors. In essence, we rely on trusting the trainer to provide accurate and unbiased training data to the models.
There is potential for LLMs to be useful tools for delivering academic and scientific information to various audiences, including—but not limited to—students and other academics. However, for this use case, a degree of memorization of the underlying content is necessary. Where information is unviable, it would be better to state so rather than to interpolate. In the current iteration of LLMs, since the training is geared toward generalization and the models are probabilistic, they tend to interpolate and fill in the missing information with synthetic text. There is still a need to explore this process deeper to find solutions.
Data Collection and Validation
Topics were selected and categorized as either natural sciences or humanities. Topics were included if they were: (1) clinical or biomedical–related research in the natural sciences category and philosophy/psychology-related research in the humanities category, and (2) published in English. Topics were excluded if they were: (1) not in English, (2) related to a highly specialized or niche field, and (3) sensitive or controversial in nature. Two researchers independently prompted ChatGPT (GPT-3.5) to write sections of a manuscript while adhering to the American Psychological Association style [ 17 ] for citations and including the DOI of each reference. Citations and references generated by ChatGPT were collected for subsequent analysis. The researchers then independently validated the references by conducting searches on Google Scholar, PubMed, and Google Search for each cited reference. The primary objective was to confirm the existence and accuracy of the cited literature. DOI existence and validation were confirmed using the DOI Foundation website [ 18 ]. DOIs that did not exist or were matched to a different source were considered hallucinations [ 19 ]. Data collected by both researchers were aggregated and compared. Independent validation was performed to ensure agreement between the two researchers regarding the existence, validity, and accuracy of the citations and DOIs. Any disagreements or discrepancies were resolved through discussion and consensus.
In this study, hallucination refers to instances where ChatGPT 3.5 generates DOIs and/or citations that do not correspond to actual, valid DOIs/citations for scholarly references. In these instances, the model may produce DOIs and/or citations that seem authentic but are in fact incorrect or nonexistent. The Levenshtein distance, also known as the edit distance, is a measure of the similarity between two strings by calculating the minimum number of single-character edits (insertions, deletions, or substitutions) required to transform one string into the other. In other words, this metric quantifies the “distance” between two strings in terms of the minimum number of operations needed to make them identical. We used the Levenshtein distance to compare the DOI generated by ChatGPT with the correct DOI. This comparison helps to measure how closely the artificial intelligence (AI)–generated DOI aligns with the expected DOI for a given citation. By calculating the Levenshtein distance, we can quantify the differences between the AI-generated DOI and the correct DOI. Larger Levenshtein distance values suggest greater dissimilarity, indicating potential inaccuracies in the AI-generated DOI.
Statistical Analysis
Data analysis was conducted using SPSS 26 and Python. The Levenshtein distance [ 20 ] between the generated DOI and the actual DOI was calculated using the thefuzz package in Python to quantitatively assess the DOI accuracy. Continuous variables are reported as mean (SD) and categorical variables are presented as absolute numbers and percentages. An independent-sample t test was used to compare continuous variables, whereas the Fisher exact test was used for comparisons of categorical variables. A P value <.05 was considered statistically significant in all tests.
Ethical Considerations
This study was exempt from ethical review since no animal or human participants were involved.
Included Topics and Citations
Ten manuscript topics were selected and included in the study, with 5 in the natural sciences group and 5 in the humanities group. ChatGPT 3.5 was prompted to write an introduction section for each topic between July 10 and August 15, 2023. A total of 102 citations were generated by ChatGPT. Of these, 55 were in the natural sciences group and 47 in the humanities group. The existence, validity, and relevance of citations were examined irrespective of the corresponding DOIs. The results are summarized in Table 2 . A list of the included topics and a sample of prompts to ChatGPT are provided in Multimedia Appendix 1 .
a Categorical variables were compared using the Fisher exact test; the continuous variable (Levenshtein distance) was compared using the independent-sample t test.
b DOI: Digital Object Identifier.
Citation Existence and Accuracy
Of the 102 generated citations, 76 (74.5%) were found to be real and exist in the published literature, with 72.7% and 76.6% of the citations verified in the natural and humanities group, respectively. There was no significant difference between the two groups ( P =.42), indicating that the validity of the citations was relatively consistent between the two domains. Similarly, when assessing the accuracy of the citations, no significant difference was observed ( Table 2 ).
Citation Relevance
The relevance of citations generated by ChatGPT was evaluated by assessing whether they were appropriate and contextually meaningful within the research topics. Our analysis indicated that 70.9% and 74.5% of citations in the natural sciences and humanities categories were deemed relevant, respectively ( Table 2 ). The difference was not statistically significant ( P =.43), suggesting that ChatGPT demonstrated a similar ability to generate contextually relevant citations in both domains.
DOI Existence, Accuracy, and Hallucination
Our analysis revealed significant differences between the two domains with respect to DOIs. In the natural sciences, 70.9% of the included DOIs were real, whereas in the humanities, only 38.3% of the DOIs generated were real ( P =.001; Table 2 ). Similarly, the level of DOI accuracy was significantly higher for the natural sciences than for the humanities ( P =.003). Moreover, the occurrence of DOI hallucination, where ChatGPT generates DOIs that do not correspond with the existing literature, was more prevalent in the humanities than in the natural sciences ( P =.001). The mean Levenshtein distance, which measures the deviation between the generated DOI and the actual DOI, was significantly higher in the natural sciences group than in the humanities ( P =.009; Table 2 ).
Principal Findings
The results of this study shed light on the performance of ChatGPT (GPT-3.5) as an academic writing assistant in generating citations and references in natural sciences and humanities topics. Our findings reveal notable differences in the accuracy and reliability of the citations and references generated by ChatGPT when applied to natural sciences and humanities topics. Hallucination in the context of LLMs such as ChatGPT refers to a phenomenon where the model generates content that is incorrect, fabricated, or not grounded in reality. Hallucination occurs when the model produces information that appears plausible or contextually relevant but lacks accuracy or fidelity to real-world knowledge.
The most striking observation was the significant disparity in the existence and accuracy of the DOIs between the two domains. In natural sciences topics, DOIs were real in 70.9% of the generated citations, representing a significantly higher rate compared to the low rate of 38.3% real DOIs in the humanities topics. The discrepancies in the DOI existence and accuracy in the two domains may be attributed to the differential adoption and availability of DOIs across academic disciplines, where the natural sciences literature has often been more proactive in adopting the DOI system of referencing and linking to scholarly works than the humanities. It is a general practice that journals publishing on the natural sciences frequently mandate DOI inclusion, whereas publishers in the humanities have been slower to adopt such standards [ 21 , 22 ]. Consequently, the performance of the ChatGPT LLM in generating accurate DOIs appears to reflect these disciplinary disparities.
LLMs may generate fictional “facts” presented as true “real-world facts,” which is referred to as hallucination [ 19 , 23 ]. In this study, we considered hallucination to have occurred if the DOI of the generated citation was not real or was real but was linked to a different source. DOI hallucination was more frequent in the humanities (89.4%) than in the natural sciences (61.8%). This finding may be explained by the broader and less structured nature of the humanities literature. There is also a high tendency to provide citations from books and other media that do not use DOIs in the humanities. Therefore, researchers in the humanities should not consider DOIs generated by ChatGPT. Even when ChatGPT generates DOIs for humanities citations, they are more likely to deviate from the correct DOI, potentially leading to the inability to access the cited sources and use the DOIs in citation management tools such as EndNote.
In contrast to the disparities observed in DOI-related metrics, our study found a remarkable consistency in the existence, validity, and relevance of the generated citations in the natural sciences and humanities, with real citations found 72.7% and 76.6% of the time and accurate citations confirmed in 67.3% and 61.7% of cases, respectively. This suggests that the citations generated by ChatGPT can be expected to be reliable approximately 60% of the time.
The divergent performance of ChatGPT between the natural sciences and humanities underscores the importance of considering disciplinary nuances when implementing AI-driven writing assistants in academic contexts. Researchers and writers in both domains should be aware of the strengths and limitations of such tools, particularly in relation to citation practices and DOI accuracy. Future research could delve deeper into the factors influencing DOI accuracy and explore strategies for improving DOI generation by LLMs in the humanities literature. Additionally, the development of domain-specific AI writing models may offer tailored solutions to enhance citation and reference accuracy in various academic disciplines.
In this study, we focused only on the potential use of LLMs in citations and references in scholarly writing; however, the scope to which these models are going to be adopted in academic works is much broader. We believe that these models will be improved over time and that they are here to stay. As such, our argument in this paper is not that LLMs should not be used in scholarly writing, but rather that in their iteration, we ought to be aware of their limitations, primarily concerning the reliability of not only the text they generate but also how they interpret that text.
Although the transformer models that are the foundation of LLMs are very capable of handling a significant amount of information, they still do have context-window limitations. The context window is the textual range or span of the input that the LLM can evaluate to generate a response at any given moment. As an example, GPT-3 has a context window of 2000 tokens, whereas GPT-4’s context window is 32,000 tokens. As such, since the size of the context window impacts model performance (larger is better), GPT-4 outperforms GPT-3 (at the cost of more computation and memory). In scientific knowledge, context is key. Removing a word from the context may greatly affect the information being conveyed. Therefore, we believe that the future of LLMs in academia will rely on fine-tuning the LLMs to capitalize on memorization where necessary, reproducibility and stability of the models, as well as access to the latest information rather than only the training data.
Limitations
There were several limitations to this study. The study included a limited number of topics (10 in total), which can only offer insight but cannot possibly cover the full spectrum of complexity and diversity within the two disciplines. Only ChatGPT 3.5 was prompted since it is the most widely used LLM for this purpose and has a free tier that the majority of users rely on. Newer models, including GPT-4, Claude+, and Google’s Gemini, may give significantly different results. Our study focused on the accuracy of citations and DOIs without an exploration of potential user feedback or subjective assessment of the overall quality and coherence of the generated content. These limitations can be addressed in future research.
In conclusion, our study provides valuable insights into the performance of ChatGPT in generating citations and references across interdisciplinary domains. These findings contribute to the ongoing discourse on the use of LLMs in scholarly writing, emphasizing the need for nuanced consideration of discipline-specific challenges and the importance of robust validation processes to ensure the accuracy and reliability of generated content.
Acknowledgments
This work was supported by the Municipal Key Technical Research and Development Program of Ningbo (2023Z160).
Data Availability
The data sets generated during and/or analyzed during this study are available from the corresponding author upon reasonable request.
Conflicts of Interest
None declared.
List of included topics and ChatGPT 3.5 prompt structure.
- Golan R, Reddy R, Muthigi A, Ramasamy R. Artificial intelligence in academic writing: a paradigm-shifting technological advance. Nat Rev Urol. Jun 2023;20(6):327-328. [ CrossRef ] [ Medline ]
- Checco A, Bracciale L, Loreti P, Pinfield S, Bianchi G. AI-assisted peer review. Humanit Soc Sci Commun. Jan 25, 2021;8(1):25. [ CrossRef ]
- Hutson M. Could AI help you to write your next paper? Nature. Nov 31, 2022;611(7934):192-193. [ CrossRef ] [ Medline ]
- Conroy G. Scientists used ChatGPT to generate an entire paper from scratch - but is it any good? Nature. Jul 2023;619(7970):443-444. [ CrossRef ] [ Medline ]
- Paskin N. Digital object identifier (DOI®) system. In: Encyclopedia of Library and Information Sciences. Milton Park. Taylor and Francis; 2010;1586-1592.
- Hosseini M, Horbach SPJM. Fighting reviewer fatigue or amplifying bias? Considerations and recommendations for use of ChatGPT and other large language models in scholarly peer review. Res Integr Peer Rev. May 18, 2023;8(1):4. [ FREE Full text ] [ CrossRef ] [ Medline ]
- Santra PP, Majhi D. Scholarly communication and machine-generated text: is it finally AI vs AI in plagiarism detection? J Inf Knowl. Jul 01, 2023;60(3):175-183. [ CrossRef ]
- Esplugas M. The use of artificial intelligence (AI) to enhance academic communication, education and research: a balanced approach. J Hand Surg Eur Vol. Sep 07, 2023;48(8):819-822. [ CrossRef ] [ Medline ]
- Kumar AHS. Analysis of ChatGPT tool to assess the potential of its utility for academic writing in biomedical domain. BEMS Reports. Jan 05, 2023;9(1):24-30. [ CrossRef ]
- Marchandot B, Matsushita K, Carmona A, Trimaille A, Morel O. ChatGPT: the next frontier in academic writing for cardiologists or a pandora's box of ethical dilemmas. Eur Heart J Open. Mar 2023;3(2):oead007. [ FREE Full text ] [ CrossRef ] [ Medline ]
- Zheng H, Zhan H. ChatGPT in scientific writing: a cautionary tale. Am J Med. Aug 2023;136(8):725-726. [ CrossRef ] [ Medline ]
- Alkaissi H, McFarlane S. Artificial hallucinations in ChatGPT: implications in scientific writing. Cureus. Feb 2023;15(2):e35179. [ FREE Full text ] [ CrossRef ] [ Medline ]
- Vaswani A, Shazeer N, Parmar N, Uszkoreit J, Jones L, Gomez A, et al. Attention is all you need. arXiv. [ FREE Full text ]
- Bahdanau D, Cho K, Bengio Y. Neural machine translation by jointly learning to align and translate. arXiv. [ FREE Full text ]
- Radford A, Narasimhan K, Salimans T, Sutskever I. Improving language understanding by generative pre-training. OpenAI. 2018. URL: https://openai.com/research/language-unsupervised [accessed 2024-04-01]
- Devlin J, Chang M, Lee K, Toutanova K. Bert: Pre-training of deep bidirectional transformers for language understanding. arXiv. Preprint posted online on October 11, 2018. [ CrossRef ]
- Degelman D, Harris M. APA style essentials. Vanguard University. 2000. URL: https://www.vanguard.edu/uploaded/research/apa_style_guide/apastyleessentials.pdf [accessed 2024-04-01]
- DOI Foundation. URL: https://doi.org/ [accessed 2024-04-01]
- Salvagno M, Taccone FS, Gerli AG. Artificial intelligence hallucinations. Crit Care. May 10, 2023;27(1):180. [ CrossRef ] [ Medline ]
- Yujian L, Bo L. A normalized Levenshtein distance metric. IEEE Trans Pattern Anal Machine Intell. Jun 2007;29(6):1091-1095. [ CrossRef ]
- Eve MP. Open Access and the Humanities. Cambridge, UK. Cambridge University Press; 2014.
- Narayan B, Luca E, Tiffen B, England A, Booth M, Boateng H. Scholarly communication practices in humanities and social sciences: a study of researchers' attitudes and awareness of open access. Open Inf Sci. 2018;2(1):168-180. [ CrossRef ]
- Zhang Y, Li Y, Cui L, Cai D, Liu L, Fu T, et al. Siren's song in the AI ocean: a survey on hallucination in large language models. arXiv. [ FREE Full text ]
Abbreviations
Edited by A Mavragani; submitted 19.09.23; peer-reviewed by Y Bu, W Li, I Liu, A Mihalache; comments to author 08.12.23; revised version received 14.12.23; accepted 12.03.24; published 05.04.24.
©Joseph Mugaanyi, Liuying Cai, Sumei Cheng, Caide Lu, Jing Huang. Originally published in the Journal of Medical Internet Research (https://www.jmir.org), 05.04.2024.
This is an open-access article distributed under the terms of the Creative Commons Attribution License (https://creativecommons.org/licenses/by/4.0/), which permits unrestricted use, distribution, and reproduction in any medium, provided the original work, first published in the Journal of Medical Internet Research, is properly cited. The complete bibliographic information, a link to the original publication on https://www.jmir.org/, as well as this copyright and license information must be included.
Thank you for visiting nature.com. You are using a browser version with limited support for CSS. To obtain the best experience, we recommend you use a more up to date browser (or turn off compatibility mode in Internet Explorer). In the meantime, to ensure continued support, we are displaying the site without styles and JavaScript.
- View all journals
- My Account Login
- Explore content
- About the journal
- Publish with us
- Sign up for alerts
- Open access
- Published: 26 March 2024
Predicting and improving complex beer flavor through machine learning
- Michiel Schreurs ORCID: orcid.org/0000-0002-9449-5619 1 , 2 , 3 na1 ,
- Supinya Piampongsant 1 , 2 , 3 na1 ,
- Miguel Roncoroni ORCID: orcid.org/0000-0001-7461-1427 1 , 2 , 3 na1 ,
- Lloyd Cool ORCID: orcid.org/0000-0001-9936-3124 1 , 2 , 3 , 4 ,
- Beatriz Herrera-Malaver ORCID: orcid.org/0000-0002-5096-9974 1 , 2 , 3 ,
- Christophe Vanderaa ORCID: orcid.org/0000-0001-7443-5427 4 ,
- Florian A. Theßeling 1 , 2 , 3 ,
- Łukasz Kreft ORCID: orcid.org/0000-0001-7620-4657 5 ,
- Alexander Botzki ORCID: orcid.org/0000-0001-6691-4233 5 ,
- Philippe Malcorps 6 ,
- Luk Daenen 6 ,
- Tom Wenseleers ORCID: orcid.org/0000-0002-1434-861X 4 &
- Kevin J. Verstrepen ORCID: orcid.org/0000-0002-3077-6219 1 , 2 , 3
Nature Communications volume 15 , Article number: 2368 ( 2024 ) Cite this article
50k Accesses
851 Altmetric
Metrics details
- Chemical engineering
- Gas chromatography
- Machine learning
- Metabolomics
- Taste receptors
The perception and appreciation of food flavor depends on many interacting chemical compounds and external factors, and therefore proves challenging to understand and predict. Here, we combine extensive chemical and sensory analyses of 250 different beers to train machine learning models that allow predicting flavor and consumer appreciation. For each beer, we measure over 200 chemical properties, perform quantitative descriptive sensory analysis with a trained tasting panel and map data from over 180,000 consumer reviews to train 10 different machine learning models. The best-performing algorithm, Gradient Boosting, yields models that significantly outperform predictions based on conventional statistics and accurately predict complex food features and consumer appreciation from chemical profiles. Model dissection allows identifying specific and unexpected compounds as drivers of beer flavor and appreciation. Adding these compounds results in variants of commercial alcoholic and non-alcoholic beers with improved consumer appreciation. Together, our study reveals how big data and machine learning uncover complex links between food chemistry, flavor and consumer perception, and lays the foundation to develop novel, tailored foods with superior flavors.
BitterSweet: Building machine learning models for predicting the bitter and sweet taste of small molecules
Rudraksh Tuwani, Somin Wadhwa & Ganesh Bagler

Sensory lexicon and aroma volatiles analysis of brewing malt
Xiaoxia Su, Miao Yu, … Tianyi Du

Predicting odor from molecular structure: a multi-label classification approach
Kushagra Saini & Venkatnarayan Ramanathan
Introduction
Predicting and understanding food perception and appreciation is one of the major challenges in food science. Accurate modeling of food flavor and appreciation could yield important opportunities for both producers and consumers, including quality control, product fingerprinting, counterfeit detection, spoilage detection, and the development of new products and product combinations (food pairing) 1 , 2 , 3 , 4 , 5 , 6 . Accurate models for flavor and consumer appreciation would contribute greatly to our scientific understanding of how humans perceive and appreciate flavor. Moreover, accurate predictive models would also facilitate and standardize existing food assessment methods and could supplement or replace assessments by trained and consumer tasting panels, which are variable, expensive and time-consuming 7 , 8 , 9 . Lastly, apart from providing objective, quantitative, accurate and contextual information that can help producers, models can also guide consumers in understanding their personal preferences 10 .
Despite the myriad of applications, predicting food flavor and appreciation from its chemical properties remains a largely elusive goal in sensory science, especially for complex food and beverages 11 , 12 . A key obstacle is the immense number of flavor-active chemicals underlying food flavor. Flavor compounds can vary widely in chemical structure and concentration, making them technically challenging and labor-intensive to quantify, even in the face of innovations in metabolomics, such as non-targeted metabolic fingerprinting 13 , 14 . Moreover, sensory analysis is perhaps even more complicated. Flavor perception is highly complex, resulting from hundreds of different molecules interacting at the physiochemical and sensorial level. Sensory perception is often non-linear, characterized by complex and concentration-dependent synergistic and antagonistic effects 15 , 16 , 17 , 18 , 19 , 20 , 21 that are further convoluted by the genetics, environment, culture and psychology of consumers 22 , 23 , 24 . Perceived flavor is therefore difficult to measure, with problems of sensitivity, accuracy, and reproducibility that can only be resolved by gathering sufficiently large datasets 25 . Trained tasting panels are considered the prime source of quality sensory data, but require meticulous training, are low throughput and high cost. Public databases containing consumer reviews of food products could provide a valuable alternative, especially for studying appreciation scores, which do not require formal training 25 . Public databases offer the advantage of amassing large amounts of data, increasing the statistical power to identify potential drivers of appreciation. However, public datasets suffer from biases, including a bias in the volunteers that contribute to the database, as well as confounding factors such as price, cult status and psychological conformity towards previous ratings of the product.
Classical multivariate statistics and machine learning methods have been used to predict flavor of specific compounds by, for example, linking structural properties of a compound to its potential biological activities or linking concentrations of specific compounds to sensory profiles 1 , 26 . Importantly, most previous studies focused on predicting organoleptic properties of single compounds (often based on their chemical structure) 27 , 28 , 29 , 30 , 31 , 32 , 33 , thus ignoring the fact that these compounds are present in a complex matrix in food or beverages and excluding complex interactions between compounds. Moreover, the classical statistics commonly used in sensory science 34 , 35 , 36 , 37 , 38 , 39 require a large sample size and sufficient variance amongst predictors to create accurate models. They are not fit for studying an extensive set of hundreds of interacting flavor compounds, since they are sensitive to outliers, have a high tendency to overfit and are less suited for non-linear and discontinuous relationships 40 .
In this study, we combine extensive chemical analyses and sensory data of a set of different commercial beers with machine learning approaches to develop models that predict taste, smell, mouthfeel and appreciation from compound concentrations. Beer is particularly suited to model the relationship between chemistry, flavor and appreciation. First, beer is a complex product, consisting of thousands of flavor compounds that partake in complex sensory interactions 41 , 42 , 43 . This chemical diversity arises from the raw materials (malt, yeast, hops, water and spices) and biochemical conversions during the brewing process (kilning, mashing, boiling, fermentation, maturation and aging) 44 , 45 . Second, the advent of the internet saw beer consumers embrace online review platforms, such as RateBeer (ZX Ventures, Anheuser-Busch InBev SA/NV) and BeerAdvocate (Next Glass, inc.). In this way, the beer community provides massive data sets of beer flavor and appreciation scores, creating extraordinarily large sensory databases to complement the analyses of our professional sensory panel. Specifically, we characterize over 200 chemical properties of 250 commercial beers, spread across 22 beer styles, and link these to the descriptive sensory profiling data of a 16-person in-house trained tasting panel and data acquired from over 180,000 public consumer reviews. These unique and extensive datasets enable us to train a suite of machine learning models to predict flavor and appreciation from a beer’s chemical profile. Dissection of the best-performing models allows us to pinpoint specific compounds as potential drivers of beer flavor and appreciation. Follow-up experiments confirm the importance of these compounds and ultimately allow us to significantly improve the flavor and appreciation of selected commercial beers. Together, our study represents a significant step towards understanding complex flavors and reinforces the value of machine learning to develop and refine complex foods. In this way, it represents a stepping stone for further computer-aided food engineering applications 46 .
To generate a comprehensive dataset on beer flavor, we selected 250 commercial Belgian beers across 22 different beer styles (Supplementary Fig. S1 ). Beers with ≤ 4.2% alcohol by volume (ABV) were classified as non-alcoholic and low-alcoholic. Blonds and Tripels constitute a significant portion of the dataset (12.4% and 11.2%, respectively) reflecting their presence on the Belgian beer market and the heterogeneity of beers within these styles. By contrast, lager beers are less diverse and dominated by a handful of brands. Rare styles such as Brut or Faro make up only a small fraction of the dataset (2% and 1%, respectively) because fewer of these beers are produced and because they are dominated by distinct characteristics in terms of flavor and chemical composition.
Extensive analysis identifies relationships between chemical compounds in beer
For each beer, we measured 226 different chemical properties, including common brewing parameters such as alcohol content, iso-alpha acids, pH, sugar concentration 47 , and over 200 flavor compounds (Methods, Supplementary Table S1 ). A large portion (37.2%) are terpenoids arising from hopping, responsible for herbal and fruity flavors 16 , 48 . A second major category are yeast metabolites, such as esters and alcohols, that result in fruity and solvent notes 48 , 49 , 50 . Other measured compounds are primarily derived from malt, or other microbes such as non- Saccharomyces yeasts and bacteria (‘wild flora’). Compounds that arise from spices or staling are labeled under ‘Others’. Five attributes (caloric value, total acids and total ester, hop aroma and sulfur compounds) are calculated from multiple individually measured compounds.
As a first step in identifying relationships between chemical properties, we determined correlations between the concentrations of the compounds (Fig. 1 , upper panel, Supplementary Data 1 and 2 , and Supplementary Fig. S2 . For the sake of clarity, only a subset of the measured compounds is shown in Fig. 1 ). Compounds of the same origin typically show a positive correlation, while absence of correlation hints at parameters varying independently. For example, the hop aroma compounds citronellol, and alpha-terpineol show moderate correlations with each other (Spearman’s rho=0.39 and 0.57), but not with the bittering hop component iso-alpha acids (Spearman’s rho=0.16 and −0.07). This illustrates how brewers can independently modify hop aroma and bitterness by selecting hop varieties and dosage time. If hops are added early in the boiling phase, chemical conversions increase bitterness while aromas evaporate, conversely, late addition of hops preserves aroma but limits bitterness 51 . Similarly, hop-derived iso-alpha acids show a strong anti-correlation with lactic acid and acetic acid, likely reflecting growth inhibition of lactic acid and acetic acid bacteria, or the consequent use of fewer hops in sour beer styles, such as West Flanders ales and Fruit beers, that rely on these bacteria for their distinct flavors 52 . Finally, yeast-derived esters (ethyl acetate, ethyl decanoate, ethyl hexanoate, ethyl octanoate) and alcohols (ethanol, isoamyl alcohol, isobutanol, and glycerol), correlate with Spearman coefficients above 0.5, suggesting that these secondary metabolites are correlated with the yeast genetic background and/or fermentation parameters and may be difficult to influence individually, although the choice of yeast strain may offer some control 53 .

Spearman rank correlations are shown. Descriptors are grouped according to their origin (malt (blue), hops (green), yeast (red), wild flora (yellow), Others (black)), and sensory aspect (aroma, taste, palate, and overall appreciation). Please note that for the chemical compounds, for the sake of clarity, only a subset of the total number of measured compounds is shown, with an emphasis on the key compounds for each source. For more details, see the main text and Methods section. Chemical data can be found in Supplementary Data 1 , correlations between all chemical compounds are depicted in Supplementary Fig. S2 and correlation values can be found in Supplementary Data 2 . See Supplementary Data 4 for sensory panel assessments and Supplementary Data 5 for correlation values between all sensory descriptors.
Interestingly, different beer styles show distinct patterns for some flavor compounds (Supplementary Fig. S3 ). These observations agree with expectations for key beer styles, and serve as a control for our measurements. For instance, Stouts generally show high values for color (darker), while hoppy beers contain elevated levels of iso-alpha acids, compounds associated with bitter hop taste. Acetic and lactic acid are not prevalent in most beers, with notable exceptions such as Kriek, Lambic, Faro, West Flanders ales and Flanders Old Brown, which use acid-producing bacteria ( Lactobacillus and Pediococcus ) or unconventional yeast ( Brettanomyces ) 54 , 55 . Glycerol, ethanol and esters show similar distributions across all beer styles, reflecting their common origin as products of yeast metabolism during fermentation 45 , 53 . Finally, low/no-alcohol beers contain low concentrations of glycerol and esters. This is in line with the production process for most of the low/no-alcohol beers in our dataset, which are produced through limiting fermentation or by stripping away alcohol via evaporation or dialysis, with both methods having the unintended side-effect of reducing the amount of flavor compounds in the final beer 56 , 57 .
Besides expected associations, our data also reveals less trivial associations between beer styles and specific parameters. For example, geraniol and citronellol, two monoterpenoids responsible for citrus, floral and rose flavors and characteristic of Citra hops, are found in relatively high amounts in Christmas, Saison, and Brett/co-fermented beers, where they may originate from terpenoid-rich spices such as coriander seeds instead of hops 58 .
Tasting panel assessments reveal sensorial relationships in beer
To assess the sensory profile of each beer, a trained tasting panel evaluated each of the 250 beers for 50 sensory attributes, including different hop, malt and yeast flavors, off-flavors and spices. Panelists used a tasting sheet (Supplementary Data 3 ) to score the different attributes. Panel consistency was evaluated by repeating 12 samples across different sessions and performing ANOVA. In 95% of cases no significant difference was found across sessions ( p > 0.05), indicating good panel consistency (Supplementary Table S2 ).
Aroma and taste perception reported by the trained panel are often linked (Fig. 1 , bottom left panel and Supplementary Data 4 and 5 ), with high correlations between hops aroma and taste (Spearman’s rho=0.83). Bitter taste was found to correlate with hop aroma and taste in general (Spearman’s rho=0.80 and 0.69), and particularly with “grassy” noble hops (Spearman’s rho=0.75). Barnyard flavor, most often associated with sour beers, is identified together with stale hops (Spearman’s rho=0.97) that are used in these beers. Lactic and acetic acid, which often co-occur, are correlated (Spearman’s rho=0.66). Interestingly, sweetness and bitterness are anti-correlated (Spearman’s rho = −0.48), confirming the hypothesis that they mask each other 59 , 60 . Beer body is highly correlated with alcohol (Spearman’s rho = 0.79), and overall appreciation is found to correlate with multiple aspects that describe beer mouthfeel (alcohol, carbonation; Spearman’s rho= 0.32, 0.39), as well as with hop and ester aroma intensity (Spearman’s rho=0.39 and 0.35).
Similar to the chemical analyses, sensorial analyses confirmed typical features of specific beer styles (Supplementary Fig. S4 ). For example, sour beers (Faro, Flanders Old Brown, Fruit beer, Kriek, Lambic, West Flanders ale) were rated acidic, with flavors of both acetic and lactic acid. Hoppy beers were found to be bitter and showed hop-associated aromas like citrus and tropical fruit. Malt taste is most detected among scotch, stout/porters, and strong ales, while low/no-alcohol beers, which often have a reputation for being ‘worty’ (reminiscent of unfermented, sweet malt extract) appear in the middle. Unsurprisingly, hop aromas are most strongly detected among hoppy beers. Like its chemical counterpart (Supplementary Fig. S3 ), acidity shows a right-skewed distribution, with the most acidic beers being Krieks, Lambics, and West Flanders ales.
Tasting panel assessments of specific flavors correlate with chemical composition
We find that the concentrations of several chemical compounds strongly correlate with specific aroma or taste, as evaluated by the tasting panel (Fig. 2 , Supplementary Fig. S5 , Supplementary Data 6 ). In some cases, these correlations confirm expectations and serve as a useful control for data quality. For example, iso-alpha acids, the bittering compounds in hops, strongly correlate with bitterness (Spearman’s rho=0.68), while ethanol and glycerol correlate with tasters’ perceptions of alcohol and body, the mouthfeel sensation of fullness (Spearman’s rho=0.82/0.62 and 0.72/0.57 respectively) and darker color from roasted malts is a good indication of malt perception (Spearman’s rho=0.54).

Heatmap colors indicate Spearman’s Rho. Axes are organized according to sensory categories (aroma, taste, mouthfeel, overall), chemical categories and chemical sources in beer (malt (blue), hops (green), yeast (red), wild flora (yellow), Others (black)). See Supplementary Data 6 for all correlation values.
Interestingly, for some relationships between chemical compounds and perceived flavor, correlations are weaker than expected. For example, the rose-smelling phenethyl acetate only weakly correlates with floral aroma. This hints at more complex relationships and interactions between compounds and suggests a need for a more complex model than simple correlations. Lastly, we uncovered unexpected correlations. For instance, the esters ethyl decanoate and ethyl octanoate appear to correlate slightly with hop perception and bitterness, possibly due to their fruity flavor. Iron is anti-correlated with hop aromas and bitterness, most likely because it is also anti-correlated with iso-alpha acids. This could be a sign of metal chelation of hop acids 61 , given that our analyses measure unbound hop acids and total iron content, or could result from the higher iron content in dark and Fruit beers, which typically have less hoppy and bitter flavors 62 .
Public consumer reviews complement expert panel data
To complement and expand the sensory data of our trained tasting panel, we collected 180,000 reviews of our 250 beers from the online consumer review platform RateBeer. This provided numerical scores for beer appearance, aroma, taste, palate, overall quality as well as the average overall score.
Public datasets are known to suffer from biases, such as price, cult status and psychological conformity towards previous ratings of a product. For example, prices correlate with appreciation scores for these online consumer reviews (rho=0.49, Supplementary Fig. S6 ), but not for our trained tasting panel (rho=0.19). This suggests that prices affect consumer appreciation, which has been reported in wine 63 , while blind tastings are unaffected. Moreover, we observe that some beer styles, like lagers and non-alcoholic beers, generally receive lower scores, reflecting that online reviewers are mostly beer aficionados with a preference for specialty beers over lager beers. In general, we find a modest correlation between our trained panel’s overall appreciation score and the online consumer appreciation scores (Fig. 3 , rho=0.29). Apart from the aforementioned biases in the online datasets, serving temperature, sample freshness and surroundings, which are all tightly controlled during the tasting panel sessions, can vary tremendously across online consumers and can further contribute to (among others, appreciation) differences between the two categories of tasters. Importantly, in contrast to the overall appreciation scores, for many sensory aspects the results from the professional panel correlated well with results obtained from RateBeer reviews. Correlations were highest for features that are relatively easy to recognize even for untrained tasters, like bitterness, sweetness, alcohol and malt aroma (Fig. 3 and below).

RateBeer text mining results can be found in Supplementary Data 7 . Rho values shown are Spearman correlation values, with asterisks indicating significant correlations ( p < 0.05, two-sided). All p values were smaller than 0.001, except for Esters aroma (0.0553), Esters taste (0.3275), Esters aroma—banana (0.0019), Coriander (0.0508) and Diacetyl (0.0134).
Besides collecting consumer appreciation from these online reviews, we developed automated text analysis tools to gather additional data from review texts (Supplementary Data 7 ). Processing review texts on the RateBeer database yielded comparable results to the scores given by the trained panel for many common sensory aspects, including acidity, bitterness, sweetness, alcohol, malt, and hop tastes (Fig. 3 ). This is in line with what would be expected, since these attributes require less training for accurate assessment and are less influenced by environmental factors such as temperature, serving glass and odors in the environment. Consumer reviews also correlate well with our trained panel for 4-vinyl guaiacol, a compound associated with a very characteristic aroma. By contrast, correlations for more specific aromas like ester, coriander or diacetyl are underrepresented in the online reviews, underscoring the importance of using a trained tasting panel and standardized tasting sheets with explicit factors to be scored for evaluating specific aspects of a beer. Taken together, our results suggest that public reviews are trustworthy for some, but not all, flavor features and can complement or substitute taste panel data for these sensory aspects.
Models can predict beer sensory profiles from chemical data
The rich datasets of chemical analyses, tasting panel assessments and public reviews gathered in the first part of this study provided us with a unique opportunity to develop predictive models that link chemical data to sensorial features. Given the complexity of beer flavor, basic statistical tools such as correlations or linear regression may not always be the most suitable for making accurate predictions. Instead, we applied different machine learning models that can model both simple linear and complex interactive relationships. Specifically, we constructed a set of regression models to predict (a) trained panel scores for beer flavor and quality and (b) public reviews’ appreciation scores from beer chemical profiles. We trained and tested 10 different models (Methods), 3 linear regression-based models (simple linear regression with first-order interactions (LR), lasso regression with first-order interactions (Lasso), partial least squares regressor (PLSR)), 5 decision tree models (AdaBoost regressor (ABR), extra trees (ET), gradient boosting regressor (GBR), random forest (RF) and XGBoost regressor (XGBR)), 1 support vector regression (SVR), and 1 artificial neural network (ANN) model.
To compare the performance of our machine learning models, the dataset was randomly split into a training and test set, stratified by beer style. After a model was trained on data in the training set, its performance was evaluated on its ability to predict the test dataset obtained from multi-output models (based on the coefficient of determination, see Methods). Additionally, individual-attribute models were ranked per descriptor and the average rank was calculated, as proposed by Korneva et al. 64 . Importantly, both ways of evaluating the models’ performance agreed in general. Performance of the different models varied (Table 1 ). It should be noted that all models perform better at predicting RateBeer results than results from our trained tasting panel. One reason could be that sensory data is inherently variable, and this variability is averaged out with the large number of public reviews from RateBeer. Additionally, all tree-based models perform better at predicting taste than aroma. Linear models (LR) performed particularly poorly, with negative R 2 values, due to severe overfitting (training set R 2 = 1). Overfitting is a common issue in linear models with many parameters and limited samples, especially with interaction terms further amplifying the number of parameters. L1 regularization (Lasso) successfully overcomes this overfitting, out-competing multiple tree-based models on the RateBeer dataset. Similarly, the dimensionality reduction of PLSR avoids overfitting and improves performance, to some extent. Still, tree-based models (ABR, ET, GBR, RF and XGBR) show the best performance, out-competing the linear models (LR, Lasso, PLSR) commonly used in sensory science 65 .
GBR models showed the best overall performance in predicting sensory responses from chemical information, with R 2 values up to 0.75 depending on the predicted sensory feature (Supplementary Table S4 ). The GBR models predict consumer appreciation (RateBeer) better than our trained panel’s appreciation (R 2 value of 0.67 compared to R 2 value of 0.09) (Supplementary Table S3 and Supplementary Table S4 ). ANN models showed intermediate performance, likely because neural networks typically perform best with larger datasets 66 . The SVR shows intermediate performance, mostly due to the weak predictions of specific attributes that lower the overall performance (Supplementary Table S4 ).
Model dissection identifies specific, unexpected compounds as drivers of consumer appreciation
Next, we leveraged our models to infer important contributors to sensory perception and consumer appreciation. Consumer preference is a crucial sensory aspects, because a product that shows low consumer appreciation scores often does not succeed commercially 25 . Additionally, the requirement for a large number of representative evaluators makes consumer trials one of the more costly and time-consuming aspects of product development. Hence, a model for predicting chemical drivers of overall appreciation would be a welcome addition to the available toolbox for food development and optimization.
Since GBR models on our RateBeer dataset showed the best overall performance, we focused on these models. Specifically, we used two approaches to identify important contributors. First, rankings of the most important predictors for each sensorial trait in the GBR models were obtained based on impurity-based feature importance (mean decrease in impurity). High-ranked parameters were hypothesized to be either the true causal chemical properties underlying the trait, to correlate with the actual causal properties, or to take part in sensory interactions affecting the trait 67 (Fig. 4A ). In a second approach, we used SHAP 68 to determine which parameters contributed most to the model for making predictions of consumer appreciation (Fig. 4B ). SHAP calculates parameter contributions to model predictions on a per-sample basis, which can be aggregated into an importance score.

A The impurity-based feature importance (mean deviance in impurity, MDI) calculated from the Gradient Boosting Regression (GBR) model predicting RateBeer appreciation scores. The top 15 highest ranked chemical properties are shown. B SHAP summary plot for the top 15 parameters contributing to our GBR model. Each point on the graph represents a sample from our dataset. The color represents the concentration of that parameter, with bluer colors representing low values and redder colors representing higher values. Greater absolute values on the horizontal axis indicate a higher impact of the parameter on the prediction of the model. C Spearman correlations between the 15 most important chemical properties and consumer overall appreciation. Numbers indicate the Spearman Rho correlation coefficient, and the rank of this correlation compared to all other correlations. The top 15 important compounds were determined using SHAP (panel B).
Both approaches identified ethyl acetate as the most predictive parameter for beer appreciation (Fig. 4 ). Ethyl acetate is the most abundant ester in beer with a typical ‘fruity’, ‘solvent’ and ‘alcoholic’ flavor, but is often considered less important than other esters like isoamyl acetate. The second most important parameter identified by SHAP is ethanol, the most abundant beer compound after water. Apart from directly contributing to beer flavor and mouthfeel, ethanol drastically influences the physical properties of beer, dictating how easily volatile compounds escape the beer matrix to contribute to beer aroma 69 . Importantly, it should also be noted that the importance of ethanol for appreciation is likely inflated by the very low appreciation scores of non-alcoholic beers (Supplementary Fig. S4 ). Despite not often being considered a driver of beer appreciation, protein level also ranks highly in both approaches, possibly due to its effect on mouthfeel and body 70 . Lactic acid, which contributes to the tart taste of sour beers, is the fourth most important parameter identified by SHAP, possibly due to the generally high appreciation of sour beers in our dataset.
Interestingly, some of the most important predictive parameters for our model are not well-established as beer flavors or are even commonly regarded as being negative for beer quality. For example, our models identify methanethiol and ethyl phenyl acetate, an ester commonly linked to beer staling 71 , as a key factor contributing to beer appreciation. Although there is no doubt that high concentrations of these compounds are considered unpleasant, the positive effects of modest concentrations are not yet known 72 , 73 .
To compare our approach to conventional statistics, we evaluated how well the 15 most important SHAP-derived parameters correlate with consumer appreciation (Fig. 4C ). Interestingly, only 6 of the properties derived by SHAP rank amongst the top 15 most correlated parameters. For some chemical compounds, the correlations are so low that they would have likely been considered unimportant. For example, lactic acid, the fourth most important parameter, shows a bimodal distribution for appreciation, with sour beers forming a separate cluster, that is missed entirely by the Spearman correlation. Additionally, the correlation plots reveal outliers, emphasizing the need for robust analysis tools. Together, this highlights the need for alternative models, like the Gradient Boosting model, that better grasp the complexity of (beer) flavor.
Finally, to observe the relationships between these chemical properties and their predicted targets, partial dependence plots were constructed for the six most important predictors of consumer appreciation 74 , 75 , 76 (Supplementary Fig. S7 ). One-way partial dependence plots show how a change in concentration affects the predicted appreciation. These plots reveal an important limitation of our models: appreciation predictions remain constant at ever-increasing concentrations. This implies that once a threshold concentration is reached, further increasing the concentration does not affect appreciation. This is false, as it is well-documented that certain compounds become unpleasant at high concentrations, including ethyl acetate (‘nail polish’) 77 and methanethiol (‘sulfury’ and ‘rotten cabbage’) 78 . The inability of our models to grasp that flavor compounds have optimal levels, above which they become negative, is a consequence of working with commercial beer brands where (off-)flavors are rarely too high to negatively impact the product. The two-way partial dependence plots show how changing the concentration of two compounds influences predicted appreciation, visualizing their interactions (Supplementary Fig. S7 ). In our case, the top 5 parameters are dominated by additive or synergistic interactions, with high concentrations for both compounds resulting in the highest predicted appreciation.
To assess the robustness of our best-performing models and model predictions, we performed 100 iterations of the GBR, RF and ET models. In general, all iterations of the models yielded similar performance (Supplementary Fig. S8 ). Moreover, the main predictors (including the top predictors ethanol and ethyl acetate) remained virtually the same, especially for GBR and RF. For the iterations of the ET model, we did observe more variation in the top predictors, which is likely a consequence of the model’s inherent random architecture in combination with co-correlations between certain predictors. However, even in this case, several of the top predictors (ethanol and ethyl acetate) remain unchanged, although their rank in importance changes (Supplementary Fig. S8 ).
Next, we investigated if a combination of RateBeer and trained panel data into one consolidated dataset would lead to stronger models, under the hypothesis that such a model would suffer less from bias in the datasets. A GBR model was trained to predict appreciation on the combined dataset. This model underperformed compared to the RateBeer model, both in the native case and when including a dataset identifier (R 2 = 0.67, 0.26 and 0.42 respectively). For the latter, the dataset identifier is the most important feature (Supplementary Fig. S9 ), while most of the feature importance remains unchanged, with ethyl acetate and ethanol ranking highest, like in the original model trained only on RateBeer data. It seems that the large variation in the panel dataset introduces noise, weakening the models’ performances and reliability. In addition, it seems reasonable to assume that both datasets are fundamentally different, with the panel dataset obtained by blind tastings by a trained professional panel.
Lastly, we evaluated whether beer style identifiers would further enhance the model’s performance. A GBR model was trained with parameters that explicitly encoded the styles of the samples. This did not improve model performance (R2 = 0.66 with style information vs R2 = 0.67). The most important chemical features are consistent with the model trained without style information (eg. ethanol and ethyl acetate), and with the exception of the most preferred (strong ale) and least preferred (low/no-alcohol) styles, none of the styles were among the most important features (Supplementary Fig. S9 , Supplementary Table S5 and S6 ). This is likely due to a combination of style-specific chemical signatures, such as iso-alpha acids and lactic acid, that implicitly convey style information to the original models, as well as the low number of samples belonging to some styles, making it difficult for the model to learn style-specific patterns. Moreover, beer styles are not rigorously defined, with some styles overlapping in features and some beers being misattributed to a specific style, all of which leads to more noise in models that use style parameters.
Model validation
To test if our predictive models give insight into beer appreciation, we set up experiments aimed at improving existing commercial beers. We specifically selected overall appreciation as the trait to be examined because of its complexity and commercial relevance. Beer flavor comprises a complex bouquet rather than single aromas and tastes 53 . Hence, adding a single compound to the extent that a difference is noticeable may lead to an unbalanced, artificial flavor. Therefore, we evaluated the effect of combinations of compounds. Because Blond beers represent the most extensive style in our dataset, we selected a beer from this style as the starting material for these experiments (Beer 64 in Supplementary Data 1 ).
In the first set of experiments, we adjusted the concentrations of compounds that made up the most important predictors of overall appreciation (ethyl acetate, ethanol, lactic acid, ethyl phenyl acetate) together with correlated compounds (ethyl hexanoate, isoamyl acetate, glycerol), bringing them up to 95 th percentile ethanol-normalized concentrations (Methods) within the Blond group (‘Spiked’ concentration in Fig. 5A ). Compared to controls, the spiked beers were found to have significantly improved overall appreciation among trained panelists, with panelist noting increased intensity of ester flavors, sweetness, alcohol, and body fullness (Fig. 5B ). To disentangle the contribution of ethanol to these results, a second experiment was performed without the addition of ethanol. This resulted in a similar outcome, including increased perception of alcohol and overall appreciation.

Adding the top chemical compounds, identified as best predictors of appreciation by our model, into poorly appreciated beers results in increased appreciation from our trained panel. Results of sensory tests between base beers and those spiked with compounds identified as the best predictors by the model. A Blond and Non/Low-alcohol (0.0% ABV) base beers were brought up to 95th-percentile ethanol-normalized concentrations within each style. B For each sensory attribute, tasters indicated the more intense sample and selected the sample they preferred. The numbers above the bars correspond to the p values that indicate significant changes in perceived flavor (two-sided binomial test: alpha 0.05, n = 20 or 13).
In a last experiment, we tested whether using the model’s predictions can boost the appreciation of a non-alcoholic beer (beer 223 in Supplementary Data 1 ). Again, the addition of a mixture of predicted compounds (omitting ethanol, in this case) resulted in a significant increase in appreciation, body, ester flavor and sweetness.
Predicting flavor and consumer appreciation from chemical composition is one of the ultimate goals of sensory science. A reliable, systematic and unbiased way to link chemical profiles to flavor and food appreciation would be a significant asset to the food and beverage industry. Such tools would substantially aid in quality control and recipe development, offer an efficient and cost-effective alternative to pilot studies and consumer trials and would ultimately allow food manufacturers to produce superior, tailor-made products that better meet the demands of specific consumer groups more efficiently.
A limited set of studies have previously tried, to varying degrees of success, to predict beer flavor and beer popularity based on (a limited set of) chemical compounds and flavors 79 , 80 . Current sensitive, high-throughput technologies allow measuring an unprecedented number of chemical compounds and properties in a large set of samples, yielding a dataset that can train models that help close the gaps between chemistry and flavor, even for a complex natural product like beer. To our knowledge, no previous research gathered data at this scale (250 samples, 226 chemical parameters, 50 sensory attributes and 5 consumer scores) to disentangle and validate the chemical aspects driving beer preference using various machine-learning techniques. We find that modern machine learning models outperform conventional statistical tools, such as correlations and linear models, and can successfully predict flavor appreciation from chemical composition. This could be attributed to the natural incorporation of interactions and non-linear or discontinuous effects in machine learning models, which are not easily grasped by the linear model architecture. While linear models and partial least squares regression represent the most widespread statistical approaches in sensory science, in part because they allow interpretation 65 , 81 , 82 , modern machine learning methods allow for building better predictive models while preserving the possibility to dissect and exploit the underlying patterns. Of the 10 different models we trained, tree-based models, such as our best performing GBR, showed the best overall performance in predicting sensory responses from chemical information, outcompeting artificial neural networks. This agrees with previous reports for models trained on tabular data 83 . Our results are in line with the findings of Colantonio et al. who also identified the gradient boosting architecture as performing best at predicting appreciation and flavor (of tomatoes and blueberries, in their specific study) 26 . Importantly, besides our larger experimental scale, we were able to directly confirm our models’ predictions in vivo.
Our study confirms that flavor compound concentration does not always correlate with perception, suggesting complex interactions that are often missed by more conventional statistics and simple models. Specifically, we find that tree-based algorithms may perform best in developing models that link complex food chemistry with aroma. Furthermore, we show that massive datasets of untrained consumer reviews provide a valuable source of data, that can complement or even replace trained tasting panels, especially for appreciation and basic flavors, such as sweetness and bitterness. This holds despite biases that are known to occur in such datasets, such as price or conformity bias. Moreover, GBR models predict taste better than aroma. This is likely because taste (e.g. bitterness) often directly relates to the corresponding chemical measurements (e.g., iso-alpha acids), whereas such a link is less clear for aromas, which often result from the interplay between multiple volatile compounds. We also find that our models are best at predicting acidity and alcohol, likely because there is a direct relation between the measured chemical compounds (acids and ethanol) and the corresponding perceived sensorial attribute (acidity and alcohol), and because even untrained consumers are generally able to recognize these flavors and aromas.
The predictions of our final models, trained on review data, hold even for blind tastings with small groups of trained tasters, as demonstrated by our ability to validate specific compounds as drivers of beer flavor and appreciation. Since adding a single compound to the extent of a noticeable difference may result in an unbalanced flavor profile, we specifically tested our identified key drivers as a combination of compounds. While this approach does not allow us to validate if a particular single compound would affect flavor and/or appreciation, our experiments do show that this combination of compounds increases consumer appreciation.
It is important to stress that, while it represents an important step forward, our approach still has several major limitations. A key weakness of the GBR model architecture is that amongst co-correlating variables, the largest main effect is consistently preferred for model building. As a result, co-correlating variables often have artificially low importance scores, both for impurity and SHAP-based methods, like we observed in the comparison to the more randomized Extra Trees models. This implies that chemicals identified as key drivers of a specific sensory feature by GBR might not be the true causative compounds, but rather co-correlate with the actual causative chemical. For example, the high importance of ethyl acetate could be (partially) attributed to the total ester content, ethanol or ethyl hexanoate (rho=0.77, rho=0.72 and rho=0.68), while ethyl phenylacetate could hide the importance of prenyl isobutyrate and ethyl benzoate (rho=0.77 and rho=0.76). Expanding our GBR model to include beer style as a parameter did not yield additional power or insight. This is likely due to style-specific chemical signatures, such as iso-alpha acids and lactic acid, that implicitly convey style information to the original model, as well as the smaller sample size per style, limiting the power to uncover style-specific patterns. This can be partly attributed to the curse of dimensionality, where the high number of parameters results in the models mainly incorporating single parameter effects, rather than complex interactions such as style-dependent effects 67 . A larger number of samples may overcome some of these limitations and offer more insight into style-specific effects. On the other hand, beer style is not a rigid scientific classification, and beers within one style often differ a lot, which further complicates the analysis of style as a model factor.
Our study is limited to beers from Belgian breweries. Although these beers cover a large portion of the beer styles available globally, some beer styles and consumer patterns may be missing, while other features might be overrepresented. For example, many Belgian ales exhibit yeast-driven flavor profiles, which is reflected in the chemical drivers of appreciation discovered by this study. In future work, expanding the scope to include diverse markets and beer styles could lead to the identification of even more drivers of appreciation and better models for special niche products that were not present in our beer set.
In addition to inherent limitations of GBR models, there are also some limitations associated with studying food aroma. Even if our chemical analyses measured most of the known aroma compounds, the total number of flavor compounds in complex foods like beer is still larger than the subset we were able to measure in this study. For example, hop-derived thiols, that influence flavor at very low concentrations, are notoriously difficult to measure in a high-throughput experiment. Moreover, consumer perception remains subjective and prone to biases that are difficult to avoid. It is also important to stress that the models are still immature and that more extensive datasets will be crucial for developing more complete models in the future. Besides more samples and parameters, our dataset does not include any demographic information about the tasters. Including such data could lead to better models that grasp external factors like age and culture. Another limitation is that our set of beers consists of high-quality end-products and lacks beers that are unfit for sale, which limits the current model in accurately predicting products that are appreciated very badly. Finally, while models could be readily applied in quality control, their use in sensory science and product development is restrained by their inability to discern causal relationships. Given that the models cannot distinguish compounds that genuinely drive consumer perception from those that merely correlate, validation experiments are essential to identify true causative compounds.
Despite the inherent limitations, dissection of our models enabled us to pinpoint specific molecules as potential drivers of beer aroma and consumer appreciation, including compounds that were unexpected and would not have been identified using standard approaches. Important drivers of beer appreciation uncovered by our models include protein levels, ethyl acetate, ethyl phenyl acetate and lactic acid. Currently, many brewers already use lactic acid to acidify their brewing water and ensure optimal pH for enzymatic activity during the mashing process. Our results suggest that adding lactic acid can also improve beer appreciation, although its individual effect remains to be tested. Interestingly, ethanol appears to be unnecessary to improve beer appreciation, both for blond beer and alcohol-free beer. Given the growing consumer interest in alcohol-free beer, with a predicted annual market growth of >7% 84 , it is relevant for brewers to know what compounds can further increase consumer appreciation of these beers. Hence, our model may readily provide avenues to further improve the flavor and consumer appreciation of both alcoholic and non-alcoholic beers, which is generally considered one of the key challenges for future beer production.
Whereas we see a direct implementation of our results for the development of superior alcohol-free beverages and other food products, our study can also serve as a stepping stone for the development of novel alcohol-containing beverages. We want to echo the growing body of scientific evidence for the negative effects of alcohol consumption, both on the individual level by the mutagenic, teratogenic and carcinogenic effects of ethanol 85 , 86 , as well as the burden on society caused by alcohol abuse and addiction. We encourage the use of our results for the production of healthier, tastier products, including novel and improved beverages with lower alcohol contents. Furthermore, we strongly discourage the use of these technologies to improve the appreciation or addictive properties of harmful substances.
The present work demonstrates that despite some important remaining hurdles, combining the latest developments in chemical analyses, sensory analysis and modern machine learning methods offers exciting avenues for food chemistry and engineering. Soon, these tools may provide solutions in quality control and recipe development, as well as new approaches to sensory science and flavor research.
Beer selection
250 commercial Belgian beers were selected to cover the broad diversity of beer styles and corresponding diversity in chemical composition and aroma. See Supplementary Fig. S1 .
Chemical dataset
Sample preparation.
Beers within their expiration date were purchased from commercial retailers. Samples were prepared in biological duplicates at room temperature, unless explicitly stated otherwise. Bottle pressure was measured with a manual pressure device (Steinfurth Mess-Systeme GmbH) and used to calculate CO 2 concentration. The beer was poured through two filter papers (Macherey-Nagel, 500713032 MN 713 ¼) to remove carbon dioxide and prevent spontaneous foaming. Samples were then prepared for measurements by targeted Headspace-Gas Chromatography-Flame Ionization Detector/Flame Photometric Detector (HS-GC-FID/FPD), Headspace-Solid Phase Microextraction-Gas Chromatography-Mass Spectrometry (HS-SPME-GC-MS), colorimetric analysis, enzymatic analysis, Near-Infrared (NIR) analysis, as described in the sections below. The mean values of biological duplicates are reported for each compound.
HS-GC-FID/FPD
HS-GC-FID/FPD (Shimadzu GC 2010 Plus) was used to measure higher alcohols, acetaldehyde, esters, 4-vinyl guaicol, and sulfur compounds. Each measurement comprised 5 ml of sample pipetted into a 20 ml glass vial containing 1.75 g NaCl (VWR, 27810.295). 100 µl of 2-heptanol (Sigma-Aldrich, H3003) (internal standard) solution in ethanol (Fisher Chemical, E/0650DF/C17) was added for a final concentration of 2.44 mg/L. Samples were flushed with nitrogen for 10 s, sealed with a silicone septum, stored at −80 °C and analyzed in batches of 20.
The GC was equipped with a DB-WAXetr column (length, 30 m; internal diameter, 0.32 mm; layer thickness, 0.50 µm; Agilent Technologies, Santa Clara, CA, USA) to the FID and an HP-5 column (length, 30 m; internal diameter, 0.25 mm; layer thickness, 0.25 µm; Agilent Technologies, Santa Clara, CA, USA) to the FPD. N 2 was used as the carrier gas. Samples were incubated for 20 min at 70 °C in the headspace autosampler (Flow rate, 35 cm/s; Injection volume, 1000 µL; Injection mode, split; Combi PAL autosampler, CTC analytics, Switzerland). The injector, FID and FPD temperatures were kept at 250 °C. The GC oven temperature was first held at 50 °C for 5 min and then allowed to rise to 80 °C at a rate of 5 °C/min, followed by a second ramp of 4 °C/min until 200 °C kept for 3 min and a final ramp of (4 °C/min) until 230 °C for 1 min. Results were analyzed with the GCSolution software version 2.4 (Shimadzu, Kyoto, Japan). The GC was calibrated with a 5% EtOH solution (VWR International) containing the volatiles under study (Supplementary Table S7 ).
HS-SPME-GC-MS
HS-SPME-GC-MS (Shimadzu GCMS-QP-2010 Ultra) was used to measure additional volatile compounds, mainly comprising terpenoids and esters. Samples were analyzed by HS-SPME using a triphase DVB/Carboxen/PDMS 50/30 μm SPME fiber (Supelco Co., Bellefonte, PA, USA) followed by gas chromatography (Thermo Fisher Scientific Trace 1300 series, USA) coupled to a mass spectrometer (Thermo Fisher Scientific ISQ series MS) equipped with a TriPlus RSH autosampler. 5 ml of degassed beer sample was placed in 20 ml vials containing 1.75 g NaCl (VWR, 27810.295). 5 µl internal standard mix was added, containing 2-heptanol (1 g/L) (Sigma-Aldrich, H3003), 4-fluorobenzaldehyde (1 g/L) (Sigma-Aldrich, 128376), 2,3-hexanedione (1 g/L) (Sigma-Aldrich, 144169) and guaiacol (1 g/L) (Sigma-Aldrich, W253200) in ethanol (Fisher Chemical, E/0650DF/C17). Each sample was incubated at 60 °C in the autosampler oven with constant agitation. After 5 min equilibration, the SPME fiber was exposed to the sample headspace for 30 min. The compounds trapped on the fiber were thermally desorbed in the injection port of the chromatograph by heating the fiber for 15 min at 270 °C.
The GC-MS was equipped with a low polarity RXi-5Sil MS column (length, 20 m; internal diameter, 0.18 mm; layer thickness, 0.18 µm; Restek, Bellefonte, PA, USA). Injection was performed in splitless mode at 320 °C, a split flow of 9 ml/min, a purge flow of 5 ml/min and an open valve time of 3 min. To obtain a pulsed injection, a programmed gas flow was used whereby the helium gas flow was set at 2.7 mL/min for 0.1 min, followed by a decrease in flow of 20 ml/min to the normal 0.9 mL/min. The temperature was first held at 30 °C for 3 min and then allowed to rise to 80 °C at a rate of 7 °C/min, followed by a second ramp of 2 °C/min till 125 °C and a final ramp of 8 °C/min with a final temperature of 270 °C.
Mass acquisition range was 33 to 550 amu at a scan rate of 5 scans/s. Electron impact ionization energy was 70 eV. The interface and ion source were kept at 275 °C and 250 °C, respectively. A mix of linear n-alkanes (from C7 to C40, Supelco Co.) was injected into the GC-MS under identical conditions to serve as external retention index markers. Identification and quantification of the compounds were performed using an in-house developed R script as described in Goelen et al. and Reher et al. 87 , 88 (for package information, see Supplementary Table S8 ). Briefly, chromatograms were analyzed using AMDIS (v2.71) 89 to separate overlapping peaks and obtain pure compound spectra. The NIST MS Search software (v2.0 g) in combination with the NIST2017, FFNSC3 and Adams4 libraries were used to manually identify the empirical spectra, taking into account the expected retention time. After background subtraction and correcting for retention time shifts between samples run on different days based on alkane ladders, compound elution profiles were extracted and integrated using a file with 284 target compounds of interest, which were either recovered in our identified AMDIS list of spectra or were known to occur in beer. Compound elution profiles were estimated for every peak in every chromatogram over a time-restricted window using weighted non-negative least square analysis after which peak areas were integrated 87 , 88 . Batch effect correction was performed by normalizing against the most stable internal standard compound, 4-fluorobenzaldehyde. Out of all 284 target compounds that were analyzed, 167 were visually judged to have reliable elution profiles and were used for final analysis.
Discrete photometric and enzymatic analysis
Discrete photometric and enzymatic analysis (Thermo Scientific TM Gallery TM Plus Beermaster Discrete Analyzer) was used to measure acetic acid, ammonia, beta-glucan, iso-alpha acids, color, sugars, glycerol, iron, pH, protein, and sulfite. 2 ml of sample volume was used for the analyses. Information regarding the reagents and standard solutions used for analyses and calibrations is included in Supplementary Table S7 and Supplementary Table S9 .
NIR analyses
NIR analysis (Anton Paar Alcolyzer Beer ME System) was used to measure ethanol. Measurements comprised 50 ml of sample, and a 10% EtOH solution was used for calibration.
Correlation calculations
Pairwise Spearman Rank correlations were calculated between all chemical properties.
Sensory dataset
Trained panel.
Our trained tasting panel consisted of volunteers who gave prior verbal informed consent. All compounds used for the validation experiment were of food-grade quality. The tasting sessions were approved by the Social and Societal Ethics Committee of the KU Leuven (G-2022-5677-R2(MAR)). All online reviewers agreed to the Terms and Conditions of the RateBeer website.
Sensory analysis was performed according to the American Society of Brewing Chemists (ASBC) Sensory Analysis Methods 90 . 30 volunteers were screened through a series of triangle tests. The sixteen most sensitive and consistent tasters were retained as taste panel members. The resulting panel was diverse in age [22–42, mean: 29], sex [56% male] and nationality [7 different countries]. The panel developed a consensus vocabulary to describe beer aroma, taste and mouthfeel. Panelists were trained to identify and score 50 different attributes, using a 7-point scale to rate attributes’ intensity. The scoring sheet is included as Supplementary Data 3 . Sensory assessments took place between 10–12 a.m. The beers were served in black-colored glasses. Per session, between 5 and 12 beers of the same style were tasted at 12 °C to 16 °C. Two reference beers were added to each set and indicated as ‘Reference 1 & 2’, allowing panel members to calibrate their ratings. Not all panelists were present at every tasting. Scores were scaled by standard deviation and mean-centered per taster. Values are represented as z-scores and clustered by Euclidean distance. Pairwise Spearman correlations were calculated between taste and aroma sensory attributes. Panel consistency was evaluated by repeating samples on different sessions and performing ANOVA to identify differences, using the ‘stats’ package (v4.2.2) in R (for package information, see Supplementary Table S8 ).
Online reviews from a public database
The ‘scrapy’ package in Python (v3.6) (for package information, see Supplementary Table S8 ). was used to collect 232,288 online reviews (mean=922, min=6, max=5343) from RateBeer, an online beer review database. Each review entry comprised 5 numerical scores (appearance, aroma, taste, palate and overall quality) and an optional review text. The total number of reviews per reviewer was collected separately. Numerical scores were scaled and centered per rater, and mean scores were calculated per beer.
For the review texts, the language was estimated using the packages ‘langdetect’ and ‘langid’ in Python. Reviews that were classified as English by both packages were kept. Reviewers with fewer than 100 entries overall were discarded. 181,025 reviews from >6000 reviewers from >40 countries remained. Text processing was done using the ‘nltk’ package in Python. Texts were corrected for slang and misspellings; proper nouns and rare words that are relevant to the beer context were specified and kept as-is (‘Chimay’,’Lambic’, etc.). A dictionary of semantically similar sensorial terms, for example ‘floral’ and ‘flower’, was created and collapsed together into one term. Words were stemmed and lemmatized to avoid identifying words such as ‘acid’ and ‘acidity’ as separate terms. Numbers and punctuation were removed.
Sentences from up to 50 randomly chosen reviews per beer were manually categorized according to the aspect of beer they describe (appearance, aroma, taste, palate, overall quality—not to be confused with the 5 numerical scores described above) or flagged as irrelevant if they contained no useful information. If a beer contained fewer than 50 reviews, all reviews were manually classified. This labeled data set was used to train a model that classified the rest of the sentences for all beers 91 . Sentences describing taste and aroma were extracted, and term frequency–inverse document frequency (TFIDF) was implemented to calculate enrichment scores for sensorial words per beer.
The sex of the tasting subject was not considered when building our sensory database. Instead, results from different panelists were averaged, both for our trained panel (56% male, 44% female) and the RateBeer reviews (70% male, 30% female for RateBeer as a whole).
Beer price collection and processing
Beer prices were collected from the following stores: Colruyt, Delhaize, Total Wine, BeerHawk, The Belgian Beer Shop, The Belgian Shop, and Beer of Belgium. Where applicable, prices were converted to Euros and normalized per liter. Spearman correlations were calculated between these prices and mean overall appreciation scores from RateBeer and the taste panel, respectively.
Pairwise Spearman Rank correlations were calculated between all sensory properties.
Machine learning models
Predictive modeling of sensory profiles from chemical data.
Regression models were constructed to predict (a) trained panel scores for beer flavors and quality from beer chemical profiles and (b) public reviews’ appreciation scores from beer chemical profiles. Z-scores were used to represent sensory attributes in both data sets. Chemical properties with log-normal distributions (Shapiro-Wilk test, p < 0.05 ) were log-transformed. Missing chemical measurements (0.1% of all data) were replaced with mean values per attribute. Observations from 250 beers were randomly separated into a training set (70%, 175 beers) and a test set (30%, 75 beers), stratified per beer style. Chemical measurements (p = 231) were normalized based on the training set average and standard deviation. In total, three linear regression-based models: linear regression with first-order interaction terms (LR), lasso regression with first-order interaction terms (Lasso) and partial least squares regression (PLSR); five decision tree models, Adaboost regressor (ABR), Extra Trees (ET), Gradient Boosting regressor (GBR), Random Forest (RF) and XGBoost regressor (XGBR); one support vector machine model (SVR) and one artificial neural network model (ANN) were trained. The models were implemented using the ‘scikit-learn’ package (v1.2.2) and ‘xgboost’ package (v1.7.3) in Python (v3.9.16). Models were trained, and hyperparameters optimized, using five-fold cross-validated grid search with the coefficient of determination (R 2 ) as the evaluation metric. The ANN (scikit-learn’s MLPRegressor) was optimized using Bayesian Tree-Structured Parzen Estimator optimization with the ‘Optuna’ Python package (v3.2.0). Individual models were trained per attribute, and a multi-output model was trained on all attributes simultaneously.
Model dissection
GBR was found to outperform other methods, resulting in models with the highest average R 2 values in both trained panel and public review data sets. Impurity-based rankings of the most important predictors for each predicted sensorial trait were obtained using the ‘scikit-learn’ package. To observe the relationships between these chemical properties and their predicted targets, partial dependence plots (PDP) were constructed for the six most important predictors of consumer appreciation 74 , 75 .
The ‘SHAP’ package in Python (v0.41.0) was implemented to provide an alternative ranking of predictor importance and to visualize the predictors’ effects as a function of their concentration 68 .
Validation of causal chemical properties
To validate the effects of the most important model features on predicted sensory attributes, beers were spiked with the chemical compounds identified by the models and descriptive sensory analyses were carried out according to the American Society of Brewing Chemists (ASBC) protocol 90 .
Compound spiking was done 30 min before tasting. Compounds were spiked into fresh beer bottles, that were immediately resealed and inverted three times. Fresh bottles of beer were opened for the same duration, resealed, and inverted thrice, to serve as controls. Pairs of spiked samples and controls were served simultaneously, chilled and in dark glasses as outlined in the Trained panel section above. Tasters were instructed to select the glass with the higher flavor intensity for each attribute (directional difference test 92 ) and to select the glass they prefer.
The final concentration after spiking was equal to the within-style average, after normalizing by ethanol concentration. This was done to ensure balanced flavor profiles in the final spiked beer. The same methods were applied to improve a non-alcoholic beer. Compounds were the following: ethyl acetate (Merck KGaA, W241415), ethyl hexanoate (Merck KGaA, W243906), isoamyl acetate (Merck KGaA, W205508), phenethyl acetate (Merck KGaA, W285706), ethanol (96%, Colruyt), glycerol (Merck KGaA, W252506), lactic acid (Merck KGaA, 261106).
Significant differences in preference or perceived intensity were determined by performing the two-sided binomial test on each attribute.
Reporting summary
Further information on research design is available in the Nature Portfolio Reporting Summary linked to this article.
Data availability
The data that support the findings of this work are available in the Supplementary Data files and have been deposited to Zenodo under accession code 10653704 93 . The RateBeer scores data are under restricted access, they are not publicly available as they are property of RateBeer (ZX Ventures, USA). Access can be obtained from the authors upon reasonable request and with permission of RateBeer (ZX Ventures, USA). Source data are provided with this paper.
Code availability
The code for training the machine learning models, analyzing the models, and generating the figures has been deposited to Zenodo under accession code 10653704 93 .
Tieman, D. et al. A chemical genetic roadmap to improved tomato flavor. Science 355 , 391–394 (2017).
Article ADS CAS PubMed Google Scholar
Plutowska, B. & Wardencki, W. Application of gas chromatography–olfactometry (GC–O) in analysis and quality assessment of alcoholic beverages – A review. Food Chem. 107 , 449–463 (2008).
Article CAS Google Scholar
Legin, A., Rudnitskaya, A., Seleznev, B. & Vlasov, Y. Electronic tongue for quality assessment of ethanol, vodka and eau-de-vie. Anal. Chim. Acta 534 , 129–135 (2005).
Loutfi, A., Coradeschi, S., Mani, G. K., Shankar, P. & Rayappan, J. B. B. Electronic noses for food quality: A review. J. Food Eng. 144 , 103–111 (2015).
Ahn, Y.-Y., Ahnert, S. E., Bagrow, J. P. & Barabási, A.-L. Flavor network and the principles of food pairing. Sci. Rep. 1 , 196 (2011).
Article CAS PubMed PubMed Central Google Scholar
Bartoshuk, L. M. & Klee, H. J. Better fruits and vegetables through sensory analysis. Curr. Biol. 23 , R374–R378 (2013).
Article CAS PubMed Google Scholar
Piggott, J. R. Design questions in sensory and consumer science. Food Qual. Prefer. 3293 , 217–220 (1995).
Article Google Scholar
Kermit, M. & Lengard, V. Assessing the performance of a sensory panel-panellist monitoring and tracking. J. Chemom. 19 , 154–161 (2005).
Cook, D. J., Hollowood, T. A., Linforth, R. S. T. & Taylor, A. J. Correlating instrumental measurements of texture and flavour release with human perception. Int. J. Food Sci. Technol. 40 , 631–641 (2005).
Chinchanachokchai, S., Thontirawong, P. & Chinchanachokchai, P. A tale of two recommender systems: The moderating role of consumer expertise on artificial intelligence based product recommendations. J. Retail. Consum. Serv. 61 , 1–12 (2021).
Ross, C. F. Sensory science at the human-machine interface. Trends Food Sci. Technol. 20 , 63–72 (2009).
Chambers, E. IV & Koppel, K. Associations of volatile compounds with sensory aroma and flavor: The complex nature of flavor. Molecules 18 , 4887–4905 (2013).
Pinu, F. R. Metabolomics—The new frontier in food safety and quality research. Food Res. Int. 72 , 80–81 (2015).
Danezis, G. P., Tsagkaris, A. S., Brusic, V. & Georgiou, C. A. Food authentication: state of the art and prospects. Curr. Opin. Food Sci. 10 , 22–31 (2016).
Shepherd, G. M. Smell images and the flavour system in the human brain. Nature 444 , 316–321 (2006).
Meilgaard, M. C. Prediction of flavor differences between beers from their chemical composition. J. Agric. Food Chem. 30 , 1009–1017 (1982).
Xu, L. et al. Widespread receptor-driven modulation in peripheral olfactory coding. Science 368 , eaaz5390 (2020).
Kupferschmidt, K. Following the flavor. Science 340 , 808–809 (2013).
Billesbølle, C. B. et al. Structural basis of odorant recognition by a human odorant receptor. Nature 615 , 742–749 (2023).
Article ADS PubMed PubMed Central Google Scholar
Smith, B. Perspective: Complexities of flavour. Nature 486 , S6–S6 (2012).
Pfister, P. et al. Odorant receptor inhibition is fundamental to odor encoding. Curr. Biol. 30 , 2574–2587 (2020).
Moskowitz, H. W., Kumaraiah, V., Sharma, K. N., Jacobs, H. L. & Sharma, S. D. Cross-cultural differences in simple taste preferences. Science 190 , 1217–1218 (1975).
Eriksson, N. et al. A genetic variant near olfactory receptor genes influences cilantro preference. Flavour 1 , 22 (2012).
Ferdenzi, C. et al. Variability of affective responses to odors: Culture, gender, and olfactory knowledge. Chem. Senses 38 , 175–186 (2013).
Article PubMed Google Scholar
Lawless, H. T. & Heymann, H. Sensory evaluation of food: Principles and practices. (Springer, New York, NY). https://doi.org/10.1007/978-1-4419-6488-5 (2010).
Colantonio, V. et al. Metabolomic selection for enhanced fruit flavor. Proc. Natl. Acad. Sci. 119 , e2115865119 (2022).
Fritz, F., Preissner, R. & Banerjee, P. VirtualTaste: a web server for the prediction of organoleptic properties of chemical compounds. Nucleic Acids Res 49 , W679–W684 (2021).
Tuwani, R., Wadhwa, S. & Bagler, G. BitterSweet: Building machine learning models for predicting the bitter and sweet taste of small molecules. Sci. Rep. 9 , 1–13 (2019).
Dagan-Wiener, A. et al. Bitter or not? BitterPredict, a tool for predicting taste from chemical structure. Sci. Rep. 7 , 1–13 (2017).
Pallante, L. et al. Toward a general and interpretable umami taste predictor using a multi-objective machine learning approach. Sci. Rep. 12 , 1–11 (2022).
Malavolta, M. et al. A survey on computational taste predictors. Eur. Food Res. Technol. 248 , 2215–2235 (2022).
Lee, B. K. et al. A principal odor map unifies diverse tasks in olfactory perception. Science 381 , 999–1006 (2023).
Mayhew, E. J. et al. Transport features predict if a molecule is odorous. Proc. Natl. Acad. Sci. 119 , e2116576119 (2022).
Niu, Y. et al. Sensory evaluation of the synergism among ester odorants in light aroma-type liquor by odor threshold, aroma intensity and flash GC electronic nose. Food Res. Int. 113 , 102–114 (2018).
Yu, P., Low, M. Y. & Zhou, W. Design of experiments and regression modelling in food flavour and sensory analysis: A review. Trends Food Sci. Technol. 71 , 202–215 (2018).
Oladokun, O. et al. The impact of hop bitter acid and polyphenol profiles on the perceived bitterness of beer. Food Chem. 205 , 212–220 (2016).
Linforth, R., Cabannes, M., Hewson, L., Yang, N. & Taylor, A. Effect of fat content on flavor delivery during consumption: An in vivo model. J. Agric. Food Chem. 58 , 6905–6911 (2010).
Guo, S., Na Jom, K. & Ge, Y. Influence of roasting condition on flavor profile of sunflower seeds: A flavoromics approach. Sci. Rep. 9 , 11295 (2019).
Ren, Q. et al. The changes of microbial community and flavor compound in the fermentation process of Chinese rice wine using Fagopyrum tataricum grain as feedstock. Sci. Rep. 9 , 3365 (2019).
Hastie, T., Friedman, J. & Tibshirani, R. The Elements of Statistical Learning. (Springer, New York, NY). https://doi.org/10.1007/978-0-387-21606-5 (2001).
Dietz, C., Cook, D., Huismann, M., Wilson, C. & Ford, R. The multisensory perception of hop essential oil: a review. J. Inst. Brew. 126 , 320–342 (2020).
CAS Google Scholar
Roncoroni, Miguel & Verstrepen, Kevin Joan. Belgian Beer: Tested and Tasted. (Lannoo, 2018).
Meilgaard, M. Flavor chemistry of beer: Part II: Flavor and threshold of 239 aroma volatiles. in (1975).
Bokulich, N. A. & Bamforth, C. W. The microbiology of malting and brewing. Microbiol. Mol. Biol. Rev. MMBR 77 , 157–172 (2013).
Dzialo, M. C., Park, R., Steensels, J., Lievens, B. & Verstrepen, K. J. Physiology, ecology and industrial applications of aroma formation in yeast. FEMS Microbiol. Rev. 41 , S95–S128 (2017).
Article PubMed PubMed Central Google Scholar
Datta, A. et al. Computer-aided food engineering. Nat. Food 3 , 894–904 (2022).
American Society of Brewing Chemists. Beer Methods. (American Society of Brewing Chemists, St. Paul, MN, U.S.A.).
Olaniran, A. O., Hiralal, L., Mokoena, M. P. & Pillay, B. Flavour-active volatile compounds in beer: production, regulation and control. J. Inst. Brew. 123 , 13–23 (2017).
Verstrepen, K. J. et al. Flavor-active esters: Adding fruitiness to beer. J. Biosci. Bioeng. 96 , 110–118 (2003).
Meilgaard, M. C. Flavour chemistry of beer. part I: flavour interaction between principal volatiles. Master Brew. Assoc. Am. Tech. Q 12 , 107–117 (1975).
Briggs, D. E., Boulton, C. A., Brookes, P. A. & Stevens, R. Brewing 227–254. (Woodhead Publishing). https://doi.org/10.1533/9781855739062.227 (2004).
Bossaert, S., Crauwels, S., De Rouck, G. & Lievens, B. The power of sour - A review: Old traditions, new opportunities. BrewingScience 72 , 78–88 (2019).
Google Scholar
Verstrepen, K. J. et al. Flavor active esters: Adding fruitiness to beer. J. Biosci. Bioeng. 96 , 110–118 (2003).
Snauwaert, I. et al. Microbial diversity and metabolite composition of Belgian red-brown acidic ales. Int. J. Food Microbiol. 221 , 1–11 (2016).
Spitaels, F. et al. The microbial diversity of traditional spontaneously fermented lambic beer. PLoS ONE 9 , e95384 (2014).
Blanco, C. A., Andrés-Iglesias, C. & Montero, O. Low-alcohol Beers: Flavor Compounds, Defects, and Improvement Strategies. Crit. Rev. Food Sci. Nutr. 56 , 1379–1388 (2016).
Jackowski, M. & Trusek, A. Non-Alcohol. beer Prod. – Overv. 20 , 32–38 (2018).
Takoi, K. et al. The contribution of geraniol metabolism to the citrus flavour of beer: Synergy of geraniol and β-citronellol under coexistence with excess linalool. J. Inst. Brew. 116 , 251–260 (2010).
Kroeze, J. H. & Bartoshuk, L. M. Bitterness suppression as revealed by split-tongue taste stimulation in humans. Physiol. Behav. 35 , 779–783 (1985).
Mennella, J. A. et al. A spoonful of sugar helps the medicine go down”: Bitter masking bysucrose among children and adults. Chem. Senses 40 , 17–25 (2015).
Wietstock, P., Kunz, T., Perreira, F. & Methner, F.-J. Metal chelation behavior of hop acids in buffered model systems. BrewingScience 69 , 56–63 (2016).
Sancho, D., Blanco, C. A., Caballero, I. & Pascual, A. Free iron in pale, dark and alcohol-free commercial lager beers. J. Sci. Food Agric. 91 , 1142–1147 (2011).
Rodrigues, H. & Parr, W. V. Contribution of cross-cultural studies to understanding wine appreciation: A review. Food Res. Int. 115 , 251–258 (2019).
Korneva, E. & Blockeel, H. Towards better evaluation of multi-target regression models. in ECML PKDD 2020 Workshops (eds. Koprinska, I. et al.) 353–362 (Springer International Publishing, Cham, 2020). https://doi.org/10.1007/978-3-030-65965-3_23 .
Gastón Ares. Mathematical and Statistical Methods in Food Science and Technology. (Wiley, 2013).
Grinsztajn, L., Oyallon, E. & Varoquaux, G. Why do tree-based models still outperform deep learning on tabular data? Preprint at http://arxiv.org/abs/2207.08815 (2022).
Gries, S. T. Statistics for Linguistics with R: A Practical Introduction. in Statistics for Linguistics with R (De Gruyter Mouton, 2021). https://doi.org/10.1515/9783110718256 .
Lundberg, S. M. et al. From local explanations to global understanding with explainable AI for trees. Nat. Mach. Intell. 2 , 56–67 (2020).
Ickes, C. M. & Cadwallader, K. R. Effects of ethanol on flavor perception in alcoholic beverages. Chemosens. Percept. 10 , 119–134 (2017).
Kato, M. et al. Influence of high molecular weight polypeptides on the mouthfeel of commercial beer. J. Inst. Brew. 127 , 27–40 (2021).
Wauters, R. et al. Novel Saccharomyces cerevisiae variants slow down the accumulation of staling aldehydes and improve beer shelf-life. Food Chem. 398 , 1–11 (2023).
Li, H., Jia, S. & Zhang, W. Rapid determination of low-level sulfur compounds in beer by headspace gas chromatography with a pulsed flame photometric detector. J. Am. Soc. Brew. Chem. 66 , 188–191 (2008).
Dercksen, A., Laurens, J., Torline, P., Axcell, B. C. & Rohwer, E. Quantitative analysis of volatile sulfur compounds in beer using a membrane extraction interface. J. Am. Soc. Brew. Chem. 54 , 228–233 (1996).
Molnar, C. Interpretable Machine Learning: A Guide for Making Black-Box Models Interpretable. (2020).
Zhao, Q. & Hastie, T. Causal interpretations of black-box models. J. Bus. Econ. Stat. Publ. Am. Stat. Assoc. 39 , 272–281 (2019).
Article MathSciNet Google Scholar
Hastie, T., Tibshirani, R. & Friedman, J. The Elements of Statistical Learning. (Springer, 2019).
Labrado, D. et al. Identification by NMR of key compounds present in beer distillates and residual phases after dealcoholization by vacuum distillation. J. Sci. Food Agric. 100 , 3971–3978 (2020).
Lusk, L. T., Kay, S. B., Porubcan, A. & Ryder, D. S. Key olfactory cues for beer oxidation. J. Am. Soc. Brew. Chem. 70 , 257–261 (2012).
Gonzalez Viejo, C., Torrico, D. D., Dunshea, F. R. & Fuentes, S. Development of artificial neural network models to assess beer acceptability based on sensory properties using a robotic pourer: A comparative model approach to achieve an artificial intelligence system. Beverages 5 , 33 (2019).
Gonzalez Viejo, C., Fuentes, S., Torrico, D. D., Godbole, A. & Dunshea, F. R. Chemical characterization of aromas in beer and their effect on consumers liking. Food Chem. 293 , 479–485 (2019).
Gilbert, J. L. et al. Identifying breeding priorities for blueberry flavor using biochemical, sensory, and genotype by environment analyses. PLOS ONE 10 , 1–21 (2015).
Goulet, C. et al. Role of an esterase in flavor volatile variation within the tomato clade. Proc. Natl. Acad. Sci. 109 , 19009–19014 (2012).
Article ADS CAS PubMed PubMed Central Google Scholar
Borisov, V. et al. Deep Neural Networks and Tabular Data: A Survey. IEEE Trans. Neural Netw. Learn. Syst. 1–21 https://doi.org/10.1109/TNNLS.2022.3229161 (2022).
Statista. Statista Consumer Market Outlook: Beer - Worldwide.
Seitz, H. K. & Stickel, F. Molecular mechanisms of alcoholmediated carcinogenesis. Nat. Rev. Cancer 7 , 599–612 (2007).
Voordeckers, K. et al. Ethanol exposure increases mutation rate through error-prone polymerases. Nat. Commun. 11 , 3664 (2020).
Goelen, T. et al. Bacterial phylogeny predicts volatile organic compound composition and olfactory response of an aphid parasitoid. Oikos 129 , 1415–1428 (2020).
Article ADS Google Scholar
Reher, T. et al. Evaluation of hop (Humulus lupulus) as a repellent for the management of Drosophila suzukii. Crop Prot. 124 , 104839 (2019).
Stein, S. E. An integrated method for spectrum extraction and compound identification from gas chromatography/mass spectrometry data. J. Am. Soc. Mass Spectrom. 10 , 770–781 (1999).
American Society of Brewing Chemists. Sensory Analysis Methods. (American Society of Brewing Chemists, St. Paul, MN, U.S.A., 1992).
McAuley, J., Leskovec, J. & Jurafsky, D. Learning Attitudes and Attributes from Multi-Aspect Reviews. Preprint at https://doi.org/10.48550/arXiv.1210.3926 (2012).
Meilgaard, M. C., Carr, B. T. & Carr, B. T. Sensory Evaluation Techniques. (CRC Press, Boca Raton). https://doi.org/10.1201/b16452 (2014).
Schreurs, M. et al. Data from: Predicting and improving complex beer flavor through machine learning. Zenodo https://doi.org/10.5281/zenodo.10653704 (2024).
Download references
Acknowledgements
We thank all lab members for their discussions and thank all tasting panel members for their contributions. Special thanks go out to Dr. Karin Voordeckers for her tremendous help in proofreading and improving the manuscript. M.S. was supported by a Baillet-Latour fellowship, L.C. acknowledges financial support from KU Leuven (C16/17/006), F.A.T. was supported by a PhD fellowship from FWO (1S08821N). Research in the lab of K.J.V. is supported by KU Leuven, FWO, VIB, VLAIO and the Brewing Science Serves Health Fund. Research in the lab of T.W. is supported by FWO (G.0A51.15) and KU Leuven (C16/17/006).
Author information
These authors contributed equally: Michiel Schreurs, Supinya Piampongsant, Miguel Roncoroni.
Authors and Affiliations
VIB—KU Leuven Center for Microbiology, Gaston Geenslaan 1, B-3001, Leuven, Belgium
Michiel Schreurs, Supinya Piampongsant, Miguel Roncoroni, Lloyd Cool, Beatriz Herrera-Malaver, Florian A. Theßeling & Kevin J. Verstrepen
CMPG Laboratory of Genetics and Genomics, KU Leuven, Gaston Geenslaan 1, B-3001, Leuven, Belgium
Leuven Institute for Beer Research (LIBR), Gaston Geenslaan 1, B-3001, Leuven, Belgium
Laboratory of Socioecology and Social Evolution, KU Leuven, Naamsestraat 59, B-3000, Leuven, Belgium
Lloyd Cool, Christophe Vanderaa & Tom Wenseleers
VIB Bioinformatics Core, VIB, Rijvisschestraat 120, B-9052, Ghent, Belgium
Łukasz Kreft & Alexander Botzki
AB InBev SA/NV, Brouwerijplein 1, B-3000, Leuven, Belgium
Philippe Malcorps & Luk Daenen
You can also search for this author in PubMed Google Scholar
Contributions
S.P., M.S. and K.J.V. conceived the experiments. S.P., M.S. and K.J.V. designed the experiments. S.P., M.S., M.R., B.H. and F.A.T. performed the experiments. S.P., M.S., L.C., C.V., L.K., A.B., P.M., L.D., T.W. and K.J.V. contributed analysis ideas. S.P., M.S., L.C., C.V., T.W. and K.J.V. analyzed the data. All authors contributed to writing the manuscript.
Corresponding author
Correspondence to Kevin J. Verstrepen .
Ethics declarations
Competing interests.
K.J.V. is affiliated with bar.on. The other authors declare no competing interests.
Peer review
Peer review information.
Nature Communications thanks Florian Bauer, Andrew John Macintosh and the other, anonymous, reviewer(s) for their contribution to the peer review of this work. A peer review file is available.
Additional information
Publisher’s note Springer Nature remains neutral with regard to jurisdictional claims in published maps and institutional affiliations.
Supplementary information
Supplementary information, peer review file, description of additional supplementary files, supplementary data 1, supplementary data 2, supplementary data 3, supplementary data 4, supplementary data 5, supplementary data 6, supplementary data 7, reporting summary, source data, source data, rights and permissions.
Open Access This article is licensed under a Creative Commons Attribution 4.0 International License, which permits use, sharing, adaptation, distribution and reproduction in any medium or format, as long as you give appropriate credit to the original author(s) and the source, provide a link to the Creative Commons licence, and indicate if changes were made. The images or other third party material in this article are included in the article’s Creative Commons licence, unless indicated otherwise in a credit line to the material. If material is not included in the article’s Creative Commons licence and your intended use is not permitted by statutory regulation or exceeds the permitted use, you will need to obtain permission directly from the copyright holder. To view a copy of this licence, visit http://creativecommons.org/licenses/by/4.0/ .
Reprints and permissions
About this article
Cite this article.
Schreurs, M., Piampongsant, S., Roncoroni, M. et al. Predicting and improving complex beer flavor through machine learning. Nat Commun 15 , 2368 (2024). https://doi.org/10.1038/s41467-024-46346-0
Download citation
Received : 30 October 2023
Accepted : 21 February 2024
Published : 26 March 2024
DOI : https://doi.org/10.1038/s41467-024-46346-0
Share this article
Anyone you share the following link with will be able to read this content:
Sorry, a shareable link is not currently available for this article.
Provided by the Springer Nature SharedIt content-sharing initiative
By submitting a comment you agree to abide by our Terms and Community Guidelines . If you find something abusive or that does not comply with our terms or guidelines please flag it as inappropriate.
Quick links
- Explore articles by subject
- Guide to authors
- Editorial policies
Sign up for the Nature Briefing: Translational Research newsletter — top stories in biotechnology, drug discovery and pharma.

- Online Degree Explore Bachelor’s & Master’s degrees
- MasterTrack™ Earn credit towards a Master’s degree
- University Certificates Advance your career with graduate-level learning
- Top Courses
- Join for Free
Letter of Introduction Writing Guide + Samples
Write a letter of introduction to connect two people you know or to reach out to someone new.
![[Featured image] A woman in an off-white sweater writes a letter of introduction on a laptop computer.](https://d3njjcbhbojbot.cloudfront.net/api/utilities/v1/imageproxy/https://images.ctfassets.net/wp1lcwdav1p1/WZhsiHaVcE9Ui7GL38Pap/a51622661ff4c2e3d291ac8266f6bf6b/GettyImages-1131374713.jpg?w=1500&h=680&q=60&fit=fill&f=faces&fm=jpg&fl=progressive&auto=format%2Ccompress&dpr=1&w=1000 "writing an introduction for a journal article")
A letter of introduction is an email that formally connects one person to another, often intended to forge new relationships, collaborations, or networking opportunities. You may write an introduction letter to connect two people you know, introduce a new team member to your department, or introduce yourself to someone you want to know.
Here, we’ll discuss when you need to write an introduction letter and go through the steps to craft your own.
When to write an introduction letter
There are several occasions when it may be appropriate to write a letter of introduction, such as when you want to:
Connect two people you know
Network with a new person
Introduce yourself at a new job
Welcome new team members
Onboard a new client, contractor, or freelancer
Most commonly, you’ll write a letter of introduction connecting two of your contacts who may benefit from knowing each other. For example, say your friend Priya is considering shifting from content marketing to a career in user experience (UX) design—the same shift your former co-worker Amil made two years ago. You may offer to write a letter of introduction connecting Priya and Amil so that Priya can learn more about her desired career change from someone who recently underwent the same process.
Tip: Before you send your letter of introduction, namely when you are connecting two people, it’s important to message each person separately to make sure that they’re okay with you initiating this new relationship.
How to write a letter of introduction
Whether you’re writing to connect two people or introducing yourself to someone new, the structure for your letter of introduction will be pretty consistent. However, you’ll always want to tailor the language in each section to the particular people and purpose.
In your email, you’ll want to include:
Why you’re writing
Quick introduction.
Relevance to your contact
Necessary contact information
Let’s take a closer look at each section.
You'll want to open a new email chain with a greeting whenever you get it. Since this note will introduce two of your friends, keeping your greeting casual and friendly is fine.
Hi Amil—I hope all is well.
Make it clear from the outset that this is an introduction by naming the other parties in your email.
Meet Priya Khan, cc’d here.
In one or two sentences, tell your recipient a bit about the person you’re introducing. You may include details like how you know them or what they do. Keep it brief, as you can anticipate that the people you’re connecting will spend more time getting to know each other later.
Priya is one of my closest friends and a content marketer at Company X. You may be familiar with their blog, Blog-X, for which she helped develop the strategy.
Establish relevance
Next, lay the groundwork for this new relationship by stating what your contacts have in common or how they may be able to help each other.
She’s interested in exploring UX design and has been taking some online classes from Google. Since you’ve gone through a similar career transition, I thought you might be willing to share your experience moving into the field.
Share contact information
If there’s any contact information you want to share beyond your email address, such as a phone number, be sure to include that before you send your email.
You can reach Priya via email or call her at (555) 555-5555.
As with any email, end with a sign-off, such as “thank you,” “best,” or “sincerely.”
I’ll let you two take it from here.
Letter of introduction samples
Putting the above sample all together, a letter of introduction may read something like:
Priya is one of my closest friends and a content marketer at Company X. You may be familiar with their blog, Blog-X, for which she helped develop the strategy. She’s interested in exploring UX design and has been taking some online classes from Google. Since you’ve gone through a similar career transition, I thought you might be willing to share your experience moving into the field.
Introducing a new team member
To welcome a new colleague onto a team, you may write something like this:
Meet Jai, our team’s newest software engineer manager.
Jai joins us from B Industries, where they led the development of the company’s recently launched app. Outside work, they enjoy exploring national parks and playing guitar in their cover band. Here, they will oversee the team working on our operating system updates and liaise with various product managers and marketing team members.
Jai is set up on email and Slack, so please join me in welcoming them to the team!
Introducing yourself
If you are writing a letter of introduction to introduce yourself, you can follow a similar structure, though the result may read slightly differently. Here’s an example of how you may introduce yourself to a potential new contact:
Hi Mr. Shah,
My name is Amar Patel, and I’m a marketing associate at Firm Y. I admire the analytical work you contributed to the M Project. I’m wondering if you may be open to talking about your expertise.
Recently, I’ve gravitated towards incorporating data into campaign planning and am earning a Professional Certificate in Marketing Analytics from Meta. I’m hoping to supplement my learning with insight from professionals like you.
I’d love to schedule a 20-minute video call if you can connect. Please let me know via email here.
Looking forward to your thoughts!
Tips for writing an introduction letter
Allow your relationships to guide your tone. You know the most effective way to communicate with your contacts. Set the tone for the connection you’re building by writing naturally.
Keep it brief . Your role in this email chain is to introduce two people. Stay focused on your task and keep your language concise.
Personalise every introduction email. Each person entering this new connection comes with their background and goals, and your email should reflect their uniqueness.
Keep exploring
Learn more communication skills with the Effective Communication: Writing, Design, and Presentation Specialisation from the University of Colorado Boulder, available on Coursera. Once you sign up for Coursera, you can explore over 5,000 courses—many of which are free to audit. Join today !
Keep reading
Coursera staff.
Editorial Team
Coursera’s editorial team is comprised of highly experienced professional editors, writers, and fact...
This content has been made available for informational purposes only. Learners are advised to conduct additional research to ensure that courses and other credentials pursued meet their personal, professional, and financial goals.
IMAGES
VIDEO
COMMENTS
To round out our guide to drafting the Introduction of your journal article, we provide some general tips about the technical aspects of writing the Introduction section below. Use the active voice. Be concise. Avoid nominalizations (converting phrases, including adjectives and verbs, into nouns).
Clarity is achieved by providing information in a predictable order. Successful introductions are therefore composed of 4 ordered components which are referred to as the "introduction formula". General Background. Introduce the general area of science in which your project takes place, highlighting the status of our understanding of that ...
Abstract. An article primarily includes the following sections: introduction, materials and methods, results, discussion, and conclusion. Before writing the introduction, the main steps, the heading and the familiarity level of the readers should be considered. Writing should begin when the experimental system and the equipment are available.
2. Lay a foundation of information already known by presenting findings of other researchers on aspects of the problem you addressed. 3. Indicate the need for more investigation by highlighting a gap in the existing work, showing a need for extension of the work, or creating a research 'niche' that your study fills. 4.
Journal Article: Introduction. Your paper's Introduction section should provide your readers with the information they need to grasp, appreciate, and build on the knowledge you present. Despite audience-dependent variations, the Introduction generally follows a four-part structure that sets the stage for the core of the paper.
An introduction has a lot of work to do in few words. Pat Thomson clarifies the core components of a journal article introduction and argues it should be thought of as a kind of mini-thesis statement, with the what, why and how of the argument spelled out in advance of the extended version. Writing a good introduction typically means "straightforward" writing and generally lays out a kind ...
Table of contents. Step 1: Introduce your topic. Step 2: Describe the background. Step 3: Establish your research problem. Step 4: Specify your objective (s) Step 5: Map out your paper. Research paper introduction examples. Frequently asked questions about the research paper introduction.
Whether you are writing a journal article to share your research, contribute to your field, or progress your career, a well-written and structured article will increase the likelihood of acceptance and of your article making an impact after publication. ... Introduction. Introduce your argument or outline the problem; Describe your approach ...
Writing the introduction to a journal article: Say what the reader is going to encounter and why it is important. An introduction has a lot of work to do in few words. Pat Thomson clarifies the core components of a journal article introduction and argues it should be thought of as a kind of mini-thesis statement, with
In this short paper I will give advice, but will also direct the readers to other available references on how to write the introduction and background sections for a research article. I will use the Journal of Advanced Nursing's (JAN) advice on empirical research papers as a framework (JAN, 2007). All references provided will be sourced online ...
Refine the paragraphs, check off your outline, and polish your introduction section. Make sure your introduction section has all the four common components: 1. The background information of the study. 2. The reasoning that leads to experimental hypothesis (gap analysis) 3. The goal of the study and research hypothesis.
To clearly establish the context for the study, the introduction contains four main components: General background information. Specific background information. A description of the gap in our knowledge that the study was designed to fill. A statement of study objective, and (optionally) a brief summary of study.
Abstract. The purpose of your abstract is to express the key points of your research, clearly and concisely. An abstract must always be well considered, as it is the primary element of your work that readers will come across. An abstract should be a short paragraph (around 300 words) that summarizes the findings of your journal article.
The introduction to your journal article must create a good impression. Readers get a strong view of the rest of the paper from the first couple of paragraphs. If your work is engaging, concise and well structured, then readers are encouraged to go on. On the other hand, if the introduction is poorly structured, doesn't get to the point, and ...
This article provides an overview of writing for publication in peer-reviewed journals. While the main focus is on writing a research article, it also provides guidance on factors influencing journal selection, including journal scope, intended audience for the findings, open access requirements, and journal citation metrics.
A scientific paper should have an introduction in the form of an inverted pyramid. The writer should start with the general information about the topic and subsequently narrow it down to the specific topic-related introduction. Fig. 17.1. Flow of ideas from the general to the specific. Full size image.
We describe here the basic steps to follow in writing a scientific article. We outline the main sections that an average article should contain; the elements that should appear in these sections, and some pointers for making the overall result attractive and acceptable for publication. 1.
17.2 What Are the Principles of Writing a Good Introduction? A good introduction will 'sell' an article to a journal editor, reviewer, and nally to a reader [3]. It should contain the following information [5, 6]: • The known—The background scientic data • The unknown—Gaps in the current knowledge • Research hypothesis or question
Important Statistics about Journal Article Introductions. Over 90% of readers decide whether to continue reading an article based on the introduction. Articles with well-crafted introductions are more likely to be cited by other researchers. The average length of a journal article introduction is around 500-1000 words.
Step 1 - Master the Opening Line. To have a strong introduction, you need to open with a strong first sentence. The millisecond your reader hits the page, they have an extremely high likelihood of leaving the page. Data says so. The first sentence has one single purpose: to entice the reader to read the next sentence.
The introduction and background sections to a research article are often overlooked and fitted in around the study design. Everyone is understandably keen to write up their method and publish their results. But not only do these sections set the tone and structure for both the article and the study to be described, they also have the potential ...
A reference to articles serves to guide readers to a connected body of literature. Conference abstracts should not be used as references. They can be cited in the text, in parentheses, but not as page footnotes. References to papers accepted but not yet published should be designated as 'in press' or 'forthcoming'.
Delving into the complexities of embodied cognition unveils the intertwined influence of mind, body, and environment. The connection of physical activity with cognition sparks a hypothesis linking motion and personality traits. Hence, this study explored whether personality traits could be linked to biomechanical variables characterizing running forms. To do so, 80 runners completed three ...
An article primarily includes the following sections: introduction, materials and methods, results, discussion, and conclusion. Before writing the introduction, the main steps, the heading and the familiarity level of the readers should be considered. Writing should begin when the experimental system and the equipment are available.
Background: Large language models (LLMs) have gained prominence since the release of ChatGPT in late 2022. Objective: The aim of this study was to assess the accuracy of citations and references generated by ChatGPT (GPT-3.5) in two distinct academic domains: the natural sciences and humanities. Methods: Two researchers independently prompted ChatGPT to write an introduction section for a ...
The perception and appreciation of food flavor depends on many interacting chemical compounds and external factors, and therefore proves challenging to understand and predict. Here, we combine ...
A letter of introduction is an email that formally connects one person to another, often intended to forge new relationships, collaborations, or networking opportunities. You may write an introduction letter to connect two people you know, introduce a new team member to your department, or introduce yourself to someone you want to know.