

How to Use Graphic Organizers to Write Better Essays
Lucid Content
Reading time: about 6 min
If you’re a student, there’s no way around the inevitable: You’re going to have to write essays. Lots of essays. In fact, the five-paragraph essay is so fundamental to the high school curriculum that it’s still used on the ACTs, and knowing how to recognize the organizational structure of essays will help you score higher on the SATs.
Even though it seems like a chore, knowing how to organize and write an essay can have a lasting effect on your life, from getting into a better college to scoring a better job to performing better in that job long after your high school days are over.
Here’s a secret: Using graphic organizers for writing essays can help you write better essays faster. (And don’t count yourself out if you’re an educator—you can offer these tools to help your students succeed.) We’ll show you exactly how to do it.
Why use graphic organizers
When ACT graders or teachers are looking your essay, they’re looking for very specific criteria; essentially, they’re looking at how well you’ve organized your thoughts. Many students don’t take the time to outline their essay structure before writing, and that always means a lower score on a test and a lower grade on the essay in class.
Using a writing template can feel like an unnecessary step in an already complicated process. If you need extra motivation to implement these organizers into your writing routine, consider all of their benefits. Graphic organizers can help you:
- Save time by showing you where each piece of the essay “lives.”
- Have more productive brainstorming sessions, either by yourself or with a group.
- Make connections between ideas and create a more cohesive argument.
- Pinpoint holes in your arguments and either adjust the thesis or find supporting statements.
- Keep track of your research.
- Organize your thoughts and come to interesting, more compelling conclusions.
- Stay in the right direction when you feel lost in a sea of words.
- Manage anxiety by converting the fear of a blank assignment into an action plan with a clear map.
With all those benefits, it’s hard to ignore how useful and vital graphic organizers are to writing. And once you’ve become adept at organizing your thoughts for something like a school essay, you’ll find that skill carries with you throughout your life, whether you’re trying to become a more intelligent debater to negotiate prices. It goes beyond just the essay to becoming a better thinker. And it starts with a simple template.
We’ll walk you through several use cases for graphic organizers and provide templates for you to download and fill in when you’re ready to write.
Brainstorming graphic organizers
Brainstorming is important, not only to come up with ideas for topics but to determine what information you need to include in the essay once you’ve determined your topic. Though many think of brainstorming as just freeflow thinking, brainstorming is most productive when you work within specific parameters.
That’s why essay brainstorming graphic organizers are useful, whether you’re using one to brainstorm on your own or you’re working with a group.
In Lucidchart, our mind map shapes and templates double as brainstorming graphic organizers. Start with an essay prompt as your central shape and then fill in the shapes that branch off your prompt with topic ideas. Alternatively, you can add your selected topic to the center and start brainstorming the different ideas you need to cover in your paper.
When the template is filled in, you’ll have a clear starting point for your essay or research paper.
Research paper graphic organizers
Nothing paralyzes students with fear quite like a research paper. These long-form papers require—as the name implies—quite a bit of research, and their purpose is to teach students how to look for valid sources to support their arguments.
But keeping track of all those sources and tying them into your argument can be tricky. That’s where a research paper graphic organizer can be a student’s greatest ally.

This template lays out the writing process itself. After you come up with a general topic, like “the disappearance of honey bees,” fill in the “Research Paper Topic” box.
Then, start looking for reputable sources (Wikipedia doesn’t count) and use the five sources boxes to hold the most relevant quotes and statistics you find. Using those quotes and statistics, you can then fill out a thesis statement that is supported by the research.
Then, you’ll be able to focus your paragraphs on a single topic each that supports the thesis statement and your overarching argument. After you’ve filled out the template, the backbone of the research paper is complete: All that’s left to do is fill in the spaces between sources and arguments.
5-paragraph essay graphic organizer
When it comes to writing the five-paragraph essay, writing diagrams are key. By using graphic organizers for writing, you’re no longer staring at a giant blank piece of paper with no idea how or where to begin. Your graphic organizer is your map.
Although using writing diagrams may seem time-consuming, the fact is that taking the time to fill a graphic organizer in before writing actually saves time. If there’s a problem with the argument, it will show up on the diagram, or if there’s not enough evidence to support your argument, you’ll know before you’ve wasted time writing the paper. And, as we said before, even if your writing is terrible, if your argument is sound, you’ll still score a decent grade.
Try this 5-paragraph essay template to get you started.

Don’t feel pressured to come up with a compelling title right away. Instead, it’s more important that you come up with a thesis statement that can be supported by three solid arguments. Fill in that thesis statement and your arguments. Then, for each argument, figure out three supporting details to support your case.
That’s it! You’ve got the most essential parts of your 5-paragraph essay completed.
Now, come up with an introduction that sets the stage for your argument and a conclusion that wraps up and restates your thesis and supporting arguments in a compelling way. Now you have a solid plan for your paper and can approach it with confidence.
If you’d like a more linear graphic that exactly follows the structure of the 5-paragraph, use the writing template below and follow the same process.

Visuals, such as graphic organizers for writing, can help you better understand concepts, think creatively, and collaborate with your classmates—and there are plenty of other templates where these came from.
Lucidchart offers hundreds of templates to help you through your studies, including timelines, Venn diagrams, word maps, and more. Sign up for Lucidchart and upgrade to an Educational account for free.
Resources for teachers
Providing graphic resources to students is essential; after all, many of your students will be visual learners, so while you may beautifully explain how the process works, there will be some who won’t understand until they see a template of the essay itself.
Lucidchart has many resources for teachers, from lesson plans to writing templates. While you’re teaching your students how to write essays or research papers, it’s useful to print out the templates and fill them out together (even using a completed template as a separate assignment with a separate grade) so that your students can get a feel for properly filling out graphic organizers before attempting it on their own.
Lucidchart, a cloud-based intelligent diagramming application, is a core component of Lucid Software's Visual Collaboration Suite. This intuitive, cloud-based solution empowers teams to collaborate in real-time to build flowcharts, mockups, UML diagrams, customer journey maps, and more. Lucidchart propels teams forward to build the future faster. Lucid is proud to serve top businesses around the world, including customers such as Google, GE, and NBC Universal, and 99% of the Fortune 500. Lucid partners with industry leaders, including Google, Atlassian, and Microsoft. Since its founding, Lucid has received numerous awards for its products, business, and workplace culture. For more information, visit lucidchart.com.
Related articles

Check out how Annika, a recent English graduate of the University of Michigan, used mind mapping in Lucidchart to develop her honors thesis.
Bring your bright ideas to life.
or continue with
Free Editable Essay Graphic Organizer Examples
Essays are complex and large write-ups that are not easy to intercept. That’s why it is better to use an essay graphic organizer to visualize your complex structured outline in a simple manner. In fact, there is nothing better than some free graphic organizer examples that save both your time and effort. So, let’s have an overview of this essay organizers and free example templates.
1. What is Essay Graphic Organizer
An essay graphic organizer enhances your research with visual elements. It helps the writer to correlate facts, observations, and notions. On top of that, it outlines the essay and provides an organized strategy for the writer.
A graphic organizer for writing helps the writers to tackle hard and long essay formats. A writer can use its visual aid to complete the write-up step by step. A graphic organizer for essays has different types based on primary functions.
- An Outline Based Essay Organizer
These types of essay organizers have at least 3 thesis. The whole story revolves around these. Moreover, the organizer includes specific supporting details and subtopic names that make the way crystal clear for writers. However, these organizers do not need much essay explanation. Most indications are worldly phrases that direct the attention toward thoughts and observations.
- A Contrasting Essay Organizer :
As the name indicates, it helps the writer to organize varying thoughts about topics and compare them. Moreover, it helps the writer to collect, conceive and portray the information ahead of time. The writer can use it for two collective primary topics or a single point from both topics. In both cases, the essay organizer will help them take visual notes and use them to their advantage while writing.
- Organizer For A Persuasive Essay :
The persuasive essay organizer helps the writer to persuade an audience toward a single topic. It includes three or more supporting details for the topic. Furthermore, the organizer includes written evidence for those details that help prove the point.
2. The Essay Graphic Organizer Examples
Using an essay graphic organizer for writing brings credibility and flexibility to your essays with extensive research. Essay writing is a tough job, especially if it has more than one subtopic.
Essays require tons of details. All that quality is up to no good if it is not organized and well structured. An essay organizer for writing helps you understand how the minor details contribute to overall concepts. With thorough research and long formats, essay writing may become dull. However, an organizer helps you to perfectly structure your thoughts with appealing visuals that make them engaging and far less challenging.

Basic 5-Paragraph Essay Graphic Organzier

5-Paragraph Essay

Expository Essay Graphic Organizer

Persuasive Essay Graphic Organizer

Essay Graphic Organzier

Narrative Essay Graphic Organizer
Example 1: 5 Paragraph Essay Graphic Organzier
The most common type of essay writing format is a 5-paragraph essay. Essay graphic organizer for writing helps organize all those 5 paragraphs and insert valuable information inside them. It includes the first paragraph section in which the writer inserts the topic sentence and at least three thesis statements. The upcoming three paragraphs briefly summarize those statements and provide at least three pieces of evidence for each thesis. Finally, the last paragraph repeats the main statement and includes an overall concluding statement. Moreover, every thesis detail includes a conclusion statement that conceives the entire concept.

Example 2: Printable 5 Paragraph Essay Graphic Organizer
It is also the type of essay organizer writers use to organize the outline of a 5-paragraph essay format. Its first paragraph is of introduction which includes with a thesis statement instead of a topic sentence. The statement inside the paragraph includes three supporting examples with itself. Moreover, the second paragraph has a topic sentence that the previous thesis supports. Plus, it has individual evidence details that prove the topic sentence true. The third paragraph includes a thesis statement that correlates with the previous and upcoming topic sentence. Finally, the last paragraph has the essay's main idea and a concluding statement that proves the point.

Example 3: Argumentative Essay Graphic Organizer
This template solemnly deals with the expository template of the essay. It focuses on the essay's three most basic parts: the introduction, body, and conclusion. Moreover, the writer evaluates the selected topic in it with examples and evidence and closes the argument clearly and concisely. The exemplary diagram includes 2 separate boxes in the introduction sections. One of them is for the hook that engages the audience, whereas the other depicts the essay's main idea. Inside the body section, the writer briefly lists three examples, each with individual supporting details. Finally, the conclusion includes two sections; one for reviewing and rewriting the central concept and the other to input the closing details of the essay.

Example 4: Persuasive Essay Graphic Organizer
This example diagram of the essay graphic organizer for writing helps to persuade a general or specific audience toward your point of view. The primary purpose is to enlist your opinion and evaluate it with the help of numerous supporting details. As for the organizer, it is for a 5 paragraph format. The first one has an engaging beginning, a summary of the issue, and your opinion. Furthermore, the next 3 provide different reasons that support your opinion. Moreover, the section also includes evidence in the form of examples and textual details that support every reason individually. The last paragraph is a conclusive one that restates the opinion, summarizes all three reasons again, and gives a CTA (call to action) at the end. However, you can ditch the CTA and add a simple closing statement that supports your opinion.

Example 5: Informational Essay Graphic Organizer
This type of organizer is for essays having more than one main idea. The organizer's interface has several colors that make it engaging and appealing. Due to the color, it is referred to as a Rainbow essay organizer. A big individual box includes the whole organized outline of the essay. The writer has to briefly write all three ideas in it and support their point of view. Moreover, the organizer includes an introduction and conclusion description. At last, there is a final draft section that concludes the whole essay and supports either all three or one suitable main idea.

Example 6: Narrative Essay Graphic Organizer
The expository essay is a genre that requires the student to investigate an idea, evaluate evidence, expound on the idea, and set forth an argument concerning that idea clearly and concisely. The below expository essay web diagram is created using EdrawMax Online and shows blank spaces for Thesis Statement, Example 1, Example 2, Example 3, Details about all the examples, and argumentative points. Expository writing gives facts and information about a topic, and as the web diagram suggests, a good expository essay introduces the main idea and develops it with facts and supporting details.

3. How to Make an Essay Graphic Organizer
Graphic organizers are the modern way of learning. With passing time, people are using them in every type of write-up. Therefore, it is better to understand its production process so that you can make one specifically for your essay. The online production software uses four simple steps to generate a graphic organizer for essays.
Step 1 - Head on to EdrawMax Online or download EdrawMax . Make an account and log in to it.
Step 2 - Once inside, you can start creating the graphic organizer on a blank edit sheet or readymade essay organizers, such as mindmaps and spider maps. However, this process is time-consuming. If you want an easy solution, head to the main menu on the left, look for Templates Community , and click on it.
Step 3 - Clicking on the Template Community option will take you to a social network of designers and a general audience like you that post templates daily for public use. You can search for your very own template and duplicate it onto your sheet using the button Duplicate.
Step 4 - Finally, start customizing it as you like. You can change the font, color, and components. Moreover, you can add new ones if you like. Once you are done and satisfied, export and share your template with others using the Button Publish present on the top right corner.
4. Online Graphic Organizer Maker
Traditional ways are gone when you had to work extensively for a simple diagram in lining software. Online graphic organizers like EdrawMax made graphic organizer designing much easier and less time-consuming. All thanks to its easy-to-use interface and basic yet helpful tool kits, designing a diagram is possible for every individual with basic knowledge.
Moreover, EdrawMax saves a lot of effort and time with the help of readymade templates. This online graphic organizer maker is suitable for any type of consumer to generate any variation of the graphic organizer. Its biggest pro is the Templates Community , with thousands of readymade templates for users. In this social biome, you can not only pick the one that suits you well but share your ideas with the community as well.
5. Key Takeaways
The visual aid of essay graphic organizers helps the writers to organize their researched facts and general thoughts according to references. Moreover, it gives a direction to the audience and the writer for the essay. As for its usage, the writers are helping themselves with it in their professional careers. Moreover, it proves exponentially efficient in the academic field for students. When it comes to essay writing, it helps in both of these by establishing a relevant and valid connection. Plus, communicating our thoughts with visual sketches and doodles is less boring and more engaging.

Free Editable Decision Flowcharts

Free Editable Sales Process Flowcharts

Free Editable Flowchart Infographic Examples

Free Editable Sports Infographic Examples

Free Editable Roadmap Infographic Examples

Free Editable Interactive Infographic Examples

We use essential cookies to make Venngage work. By clicking “Accept All Cookies”, you agree to the storing of cookies on your device to enhance site navigation, analyze site usage, and assist in our marketing efforts.
Manage Cookies
Cookies and similar technologies collect certain information about how you’re using our website. Some of them are essential, and without them you wouldn’t be able to use Venngage. But others are optional, and you get to choose whether we use them or not.
Strictly Necessary Cookies
These cookies are always on, as they’re essential for making Venngage work, and making it safe. Without these cookies, services you’ve asked for can’t be provided.
Show cookie providers
- Google Login
Functionality Cookies
These cookies help us provide enhanced functionality and personalisation, and remember your settings. They may be set by us or by third party providers.
Performance Cookies
These cookies help us analyze how many people are using Venngage, where they come from and how they're using it. If you opt out of these cookies, we can’t get feedback to make Venngage better for you and all our users.
- Google Analytics
Targeting Cookies
These cookies are set by our advertising partners to track your activity and show you relevant Venngage ads on other sites as you browse the internet.
- Google Tag Manager
- Infographics
- Daily Infographics
- Graphic Design
- Graphs and Charts
- Data Visualization
- Human Resources
- Training and Development
- Beginner Guides
Blog Graphs and Charts
19 Graphic Organizer Examples to Simplify Complex Concepts
By Danesh Ramuthi , Nov 28, 2023

Graphic organizers serve as essential visual aids that assist students in structuring and displaying information in a clear, accessible manner. These tools are particularly effective in simplifying and demystifying complex topics, ensuring that intricate concepts are easier to understand and remember.
From Venn diagrams to concept maps, these organizers play a pivotal role in enhancing comprehension and retention of the main idea, especially in educational settings.
Each type of graphic organizer offers a unique approach to organize information, making it easier to grasp complex concepts and brainstorm ideas. These organizers are not just tools for visual representation, but also catalysts for deeper understanding and creative thinking.
Discover these engaging tools on Venngage and sign up today to start creating your own effective graphic organizers for enhanced learning.
By signing up , you gain access to a diverse array of graphic organizer templates, enabling you to create your own effective graphic organizers.
Click to jump ahead:
Venn diagram
Concept map, double bubble map, hierarchy chart, cluster diagram, sequence chart, idea web graphic organizer, spider map graphic organizer, circle map graphic organizer, hexagon organizer, idea wheel graphic organizer, tree chart graphic organizer, sequence of events chain graphic organizer, cause and effect map graphic organizer, problem-solving chart, organizational chart graphic organizer.
- Bottom line
A venn diagram is a highly versatile tool used to visually represent the relationships between different sets of items. Typically composed of overlapping circles, each circle represents a distinct set of items or ideas, with the overlapping areas indicating commonalities.
Venn diagram is particularly effective in comparing and contrasting concepts, highlighting similarities and differences in a straightforward, easily comprehensible manner. Venn diagrams are widely used in various fields ranging from education to business, aiding in problem-solving, data analysis and brainstorming sessions.
They offer a clear and concise way to visualize the connections and distinctions among multiple groups or concepts, making them an invaluable tool for organizing complex information.

Mind maps are dynamic tools used for brainstorming, planning and organizing thoughts in a visually appealing and structured manner. Centered around a single, central idea, they branch out into various related sub-topics, creating a spider-web-like structure.
A mind map helps in visualizing the relationships between different ideas, fostering creative thinking and memory retention. Mind maps are commonly used in educational settings for note-taking, essay planning and studying, as well as in business for project planning and strategy development.
Their flexible nature allows for the integration of words, images and colors, making them an engaging and effective way to explore and expand upon ideas, both simple and complex.

Concept maps are graphical tools used for organizing and representing knowledge. They consist of concepts, usually enclosed in circles or boxes, connected by labeled arrows in a downward-branching hierarchical structure.
These maps are designed to illustrate the relationships among various concepts, often capturing complex structures of understanding or knowledge.
Concept maps are particularly useful in educational settings for learning, teaching and assessment, as they encourage deep understanding and integration of new information with existing knowledge.
In professional contexts, they aid in problem-solving, decision-making and explaining intricate processes or systems.
Concept maps are a powerful tool for making sense of complex topics by visually breaking them down into more manageable components.

Story maps are specialized graphic organizers used for dissecting and understanding the elements of a story or narrative. They typically focus on identifying key components such as the setting, characters, plot, conflict and resolution.
By breaking down a story into its fundamental elements, these maps provide a clear framework for analyzing and comprehending narratives. They are particularly useful in educational environments for teaching literary analysis, improving reading comprehension and assisting in creative writing.
Story maps not only aid students in summarizing and understanding literature but also provide a structured approach for planning and outlining their own stories, ensuring a coherent and well-structured narrative flow.

The double bubble map is an effective graphic organizer used for comparing and contrasting two items, concepts or events. It features two central bubbles representing the items being compared, surrounded by outer bubbles that contain attributes or characteristics of each item.
The unique aspect of this map is the inclusion of additional bubbles in the overlapping area, highlighting the similarities between the two central items.
A double bubble map provides a clear visual representation of how two entities are alike and different, making it a valuable tool in educational settings for critical thinking exercises, literary analysis and enhancing comprehension of complex topics.
The double bubble map helps students organize information systematically, encouraging them to explore and understand the nuances of comparison and contrast.

A hierarchy chart, also known as an organizational chart, is a graphic organizer that illustrates the structure of an organization or a system. It is structured in a top-down manner, with the highest level at the top (like a CEO or the main concept) and subsequent levels representing different ranks or sub-categories.
This type of chart is crucial for visualizing the chain of command within an organization or the breakdown of complex systems into smaller, more manageable parts.
Hierarchy charts are widely used in business for depicting organizational structures, in education for breaking down concepts and in project management for outlining the structure of a project. They offer a clear, easy-to-understand representation of relationships and roles within any hierarchical system.

The T-chart is a simple yet versatile graphic organizer that helps in comparing two aspects of a single topic. It consists of a large ‘T’ shape, with the vertical line dividing the page into two columns. Each column represents a different aspect, viewpoint or characteristic, allowing for a clear, side-by-side comparison.
T-charts are widely used in educational settings for analyzing texts, comparing historical events, or weighing pros and cons in decision-making processes. They are particularly helpful in enhancing students’ analytical skills, as they encourage them to organize their thoughts and view topics from multiple perspectives.
The simplicity of the T-chart makes it an accessible tool for students of all ages, fostering critical thinking and structured analysis.

Cluster diagrams, also known as cloud diagrams, are graphic organizers that help in brainstorming and organizing ideas around a central concept. The main idea is placed in the center, usually within a circle, and related ideas or subtopics branch out from it, forming a cluster-like structure.
This diagram is particularly useful for visualizing the relationships between a main concept and its various components or aspects. Cluster diagrams are widely used in brainstorming sessions, idea generation and planning phases of projects.
They encourage creative thinking and help in the exploration of complex topics by breaking them down into smaller, interconnected parts. This organizer is an effective tool for both individual and group activities, aiding in the visual representation and organization of thoughts and ideas.

Sequence charts are essential graphic organizers for outlining the chronological order of events or steps in a process. They are particularly effective in helping students understand the time-based progression of events in history, literature or scientific processes.
Sequence charts typically consist of boxes or arrows that guide the viewer through a series of steps or events, emphasizing the order and interconnectivity of each part.
In educational settings, they assist in simplifying complex sequences and timelines, making them more accessible and easier to remember.
They are also used in project planning and workflow management, providing a clear visual representation of stages in a process or project.

Idea web graphic organizers are designed to visually map out the connections between a central idea and related concepts.
At the heart of the web is the main topic, from which various lines or branches extend to link to secondary and tertiary ideas or details. This spider-web-like structure is ideal for brainstorming sessions, where it helps in organizing thoughts and fostering creative associations.
Idea webs are widely used in educational contexts for essay planning, story writing and exploring complex concepts. They encourage students to think divergently, making connections between different ideas and expanding upon the central theme in a visually coherent way.

Spider map graphic organizers, resembling a spider’s web, are used for detailing the attributes or components of a central idea or theme. The main concept sits at the center, with lines extending outward to secondary nodes that represent related information or subtopics.
Spider maps are versatile tools in education for note-taking, studying and brainstorming, enabling students to visually organize and interconnect ideas.
They also serve as valuable tools in project planning and conceptual mapping in various professional fields.

Circle map graphic organizers are utilized for brainstorming and defining concepts in a clear, concise manner. They consist of two concentric circles: the inner circle hosts the main idea or topic, while the outer circle contains information, attributes or related ideas.
This map is particularly effective for initiating thought processes around a new topic, gathering prior knowledge or brainstorming ideas before delving into more detailed study or analysis.
Circle maps are popular in educational settings for introducing new concepts, encouraging students to explore and connect their existing knowledge with new information, thereby facilitating a deeper understanding of the subject matter.

Hexagon organizers are dynamic graphic tools used for exploring connections and relationships between various ideas or concepts. Each hexagon represents a unique idea or piece of information, and these hexagons are arranged next to each other to demonstrate how they interconnect.
Hexagon organizers are popular in brainstorming sessions, for mapping out systems or processes, and in educational settings to help students understand the interdependent nature of certain concepts or events.

Idea wheel graphic organizers are circular tools that help in brainstorming and organizing ideas around a central theme or question. The central hub of the wheel represents the main idea, and spokes radiate out to smaller circles or sections where related ideas or details are noted.
This organizer is effective for visualizing the components of a topic, planning essays or projects, and encouraging creative thinking.
In educational settings, idea wheels assist students in exploring topics thoroughly, ensuring that all aspects are considered and helping them to see how different ideas connect to the central theme.

Tree chart graphic organizers are hierarchical tools used to represent the structure of ideas or concepts. Resembling a tree, the main idea forms the trunk and branches represent subtopics or related information.
It is particularly effective for breaking down complex information into manageable parts, making it easier to understand and analyze.
Tree charts are widely used in educational environments for studying biology, corporate structures or family genealogies, as well as in business for mapping organizational hierarchies or decision trees.
They provide a clear, visual method of showing relationships and hierarchies within a topic.

Read Also: What is a Decision Tree and How to Make One [Templates + Examples]
Sequence of events chain graphic organizers are linear tools designed to help visualize the order of events or steps in a process. Each link in the chain represents a sequential event or action, clearly illustrating the progression from one stage to the next.
It is invaluable in teaching narrative structure, historical timelines or scientific processes, as it helps students understand the temporal relationships between events.
Sequence chains are also beneficial in project planning and workflow management, offering a straightforward method to track the progression of tasks or stages.

Cause and effect map graphic organizers are used to visually display the relationships between various causes and their effects.
Each cause is linked to its direct effect, often using arrows or lines, allowing for a clear representation of the impact of various factors.
These organizers are particularly useful in scientific studies, history and literature analysis, as they aid students in understanding the interplay between different elements and their consequences.
Cause and effect maps are also beneficial in problem-solving and decision-making processes, helping to identify potential outcomes of various actions.

Problem-solving charts are effective tools used for breaking down and analyzing complex problems into more manageable components. They typically involve identifying the problem, exploring possible causes, brainstorming potential solutions and then evaluating and selecting the most feasible options.
These charts are instrumental in both educational and professional contexts, aiding in critical thinking, decision-making and creative problem-solving processes.
By providing a structured approach to tackling challenges, problem-solving charts help individuals and teams to systematically address issues, ensuring that all aspects of a problem are considered before arriving at a solution.

Organizational chart graphic organizers are used to depict the structure of an organization or a group, illustrating the hierarchy and relationships between different roles and departments.
These charts typically represent higher-level positions at the top, with lines branching down to subordinate roles, clearly showing the chain of command and communication pathways.
They are essential in business and institutional settings for providing a clear overview of the organizational structure, facilitating better understanding and communication within the organization.
In educational settings, organizational charts aid in teaching concepts of management and organizational behavior, helping students visualize and understand complex organizational dynamics.

Related: 40+ Charts & Graphs Examples To Unlock Insights
Bottom line
Graphic organizers play a crucial role in learning and information processing due to their ability to visually structure and simplify complex information.
By leveraging the power of graphic organizers, you can transform the way information is absorbed and presented.
With Venngage’s user-friendly platform, the creation of your own custom graphic organizers is just a few clicks away.
Sign up on Venngage today and gain access to a treasure trove of graphic organizer templates, ready to be tailored to your educational needs.
404 Not found

About this Interactive
Related resources.
Expository writing is an increasingly important skill for elementary, middle, and high school students to master. This interactive graphic organizer helps students develop an outline that includes an introductory statement, main ideas they want to discuss or describe, supporting details, and a conclusion that summarizes the main ideas. The tool offers multiple ways to navigate information including a graphic in the upper right-hand corner that allows students to move around the map without having to work in a linear fashion. The finished map can be saved, e-mailed, or printed.
- Student Interactives
- Strategy Guides
- Lesson Plans
- Calendar Activities
The Persuasion Map is an interactive graphic organizer that enables students to map out their arguments for a persuasive essay or debate.
This Strategy Guide describes the processes involved in composing and producing audio files that are published online as podcasts.
This strategy guide explains the writing process and offers practical methods for applying it in your classroom to help students become proficient writers.
This strategy guide clarifies the difference between persuasion and argumentation, stressing the connection between close reading of text to gather evidence and formation of a strong argumentative claim about text.
Students will identify how Martin Luther King Jr.'s dream of nonviolent conflict-resolution is reinterpreted in modern texts. Homework is differentiated to prompt discussion on how nonviolence is portrayed through characterization and conflict. Students will be formally assessed on a thesis essay that addresses the Six Kingian Principles of Nonviolence.
Students develop their reading, writing, research, and technology skills using graphic novels. As a final activity, students create their own graphic novels using comic software.
Students are encouraged to understand a book that the teacher reads aloud to create a new ending for it using the writing process.
While drafting a literary analysis essay (or another type of argument) of their own, students work in pairs to investigate advice for writing conclusions and to analyze conclusions of sample essays. They then draft two conclusions for their essay, select one, and reflect on what they have learned through the process.
Students analyze rhetorical strategies in online editorials, building knowledge of strategies and awareness of local and national issues. This lesson teaches students connections between subject, writer, and audience and how rhetorical strategies are used in everyday writing.
It's not easy surviving fourth grade (or third or fifth)! In this lesson, students brainstorm survival tips for future fourth graders and incorporate those tips into an essay.
Students explore the nature and structure of expository texts that focus on cause and effect and apply what they learned using graphic organizers and writing paragraphs to outline cause-and-effect relationships.
Students prepare an already published scholarly article for presentation, with an emphasis on identification of the author's thesis and argument structure.
- Print this resource
Explore Resources by Grade
- Kindergarten K
10 Free Graphic Organizer Templates for Any Subject
Different lessons require different types of content to help students learn. Here are 10 free graphic organizer templates to use for any subject.

Most students are returning to the classroom in Fall 2021, but everyone’s learning methods have had to change over the past two years. It’s important to adapt as an educator with new techniques , digital materials, and fresh content to keep students engaged .
For any subject, graphic organizers provide effective ways to introduce, teach, develop, and test new material. But different lessons require different types of content to help students learn best. I’m going to give you 10 free graphic organizer templates to use for any subject – just use the Make It button to customize, label, and download your graphic organizer.
- Venn Diagram
- Plot Pyramid
- Brainstorm Chart
- Concept Map
- 5-Paragraph Essay Outline
- 4 Square Writing Chart
1. Flowchart

The Flowchart is one of the most versatile and recognizable forms of graphic organizer out there, ideal for project planning and science experiments. A goes to B goes to C goes to D . With this version, you can copy and paste sections of the chart to make it as long or as short as you need, label each section with specific details, and add a title and other information for your assignment.
2. Timeline

The Timeline is similar to the flowchart , with events spaced out along a single path . In a Timeline, however, the intervals between the events is important to the graphic organizer as a whole. Using this template, you can drag events from one point of the Timeline to another, and add text labels for years and events.
3. Venn Diagram

One of the most widely-used graphic organizers, the Venn Diagram provides a simple way for students to compare and contrast 2 or more distinct ideas. With this template, you can copy and recolor the Venn Diagram circles to compare any number of items with each other.
4. Plot Pyramid

This graphic organizer is most commonly used in elementary and middle school English, language arts, and literature classes. It’s used to identify and map the various stages of a plot arc , from exposition to conclusion. Use this template to title the Plot Pyramid and add any other relevant information you need.
5. Brainstorm Chart

The Brainstorm Chart is a far more freeform type of graphic organizer than most others on this list, and can be arranged almost any way you like. All it requires is a central idea or “problem” to solve, along with an array of other ideas and concepts that are connected to it, and supporting details for these connected points. The freeform nature of the Brainstorm Chart allows students to think creatively and originally on any subject.
6. Concept Map

The Concept Map is similar in form to the Brainstorm Chart, but with slightly more limitations on how it’s used. It’s used to illustrate the relationships that exist between various related concepts , filling in different sections of the organizer to show how the different parts are connected. The Concept Map is perfect for introducing students to a new set of related vocabulary terms in any subject.
7. 5-Paragraph Essay Outline

While some of your students may not remember the 5-paragraph essay too fondly years later, it’s an important step in developing their persuasive writing . This classic 5-paragraph planner is perfect for helping students construct their arguments, counter-arguments, supporting data, and conclusions before they put pen to paper.
8. 4 Square Writing Chart

The 4 Square Writing Chart is similar to the 5-paragraph essay outline, it gives space for looser organizational styles and more creative types of writing structure . The central area contains the main idea or argument, and the surrounding squares are filled with supporting arguments, sections of a narrative essay, personal experiences, or several sides to the same story.
9. Story Map

The Story Map is used for a similar purpose to the Plot Pyramid, but with a broader approach to narrative plot arcs. In the Story Map, students not only recount the plot progression of a story, but detail the setting , characters , and central problems and outcomes . There are dozens of ways to organize your own Story Map, so I recommend you use this template to include whatever areas are most important for your students to identify and analyze.
10. KWL Chart

KWL Charts ask students to write on three different things before and after completing a lesson, activity, or reading: what they Know already about the topic, what they Want to learn from the lesson, and, afterward, what they Learned from the experience. It creates more of a big-picture exercise than most of the graphic organizers on this list, allowing students to identify what they gain from their lessons.
I hope these graphic organizer templates help you engage students effectively in every subject you teach. For more tips and tutorials on creating great digital content in 2021, check out the Kapwing YouTube channel or read through some related articles on education materials:
• 10 Back to School Frames for Fall 2021 • The 4 Best Ways to Learn Video Editing Online • How to Add Subtitles to a Lecture Video • How to Make a Frayer Model Online

5 Free Zoom Virtual Backgrounds for Teachers in 2020

5 Perfect Zoom Virtual Backgrounds for Chemistry Teachers

5 Free Zoom Virtual Backgrounds for Students
The Ultimate List of Graphic Organizers for Teachers and Students
Graphic organizers integrate both text and visuals. This has been scientifically proven to be an effective way of teaching and learning. Using them can be extremely useful for both teachers and students as they will make lessons more engaging as well as easily comprehensible.
We have listed below multiple types of graphic organizers you can use during various scenarios, whether you are reading, writing, doing research or studying for exams. Each tool is accompanied by a template that you can use right away.
1. What are Graphic Organizers
1.1. Benefits of graphic organizers
2. Types of Graphic Organizers
2.1. Graphic Organizers for Writing
2.1.1. 1. Persuasion map
2.1.2. 2. Sequence Chart
2.2. Graphic Organizers for Reading
2.2.1. 3. Story map
2.2.2. 4. Biography graphic organizer
2.2.3. 5. KWL chart
2.3. Graphic Organizers for Teaching
2.3.1. 6. Learning map
2.3.2. 7. Analogy graphic organizer
2.3.3. 8. Vocabulary graphic organizer
2.3.4. 9. Problem-solving organizer
2.3.5. 10. Math Graphic Organizer
2.4. Graphic Organizers for Learning
2.4.1. 11. Timeline graphic organizer
2.4.2. 12. T chart
2.4.3. 13. Hierarchy chart
2.4.4. 14. Star diagram
2.5. Graphic Organizers for Brainstorming
2.5.1. 15. Cluster diagram
2.5.2. 16. Lotus diagram
2.5.3. 17. Cause and effect graphic organizer
2.5.4. 18. Mind map
2.6. Graphic Organizers for Compare and Contrast
2.6.1. 19. Double bubble map
2.6.2. 20. Venn diagram
2.6.2.1. Add to Our List of Graphic Organizers for Teachers and Students
What are Graphic Organizers
A graphic organizer is a teaching and learning tool that is used to organize information and ideas in a way that is easy to comprehend and internalize. By integrating text and visuals, graphic organizers show relationships and connections between concepts, terms, and facts.
Graphic organizers can be used in all grade levels, and have proven to be effective learning tools for gifted children and students with special needs. And with adult learners, graphic organizers can help enable the connection between what they already know and newly acquired knowledge.
Benefits of graphic organizers
Different types of graphic organizers can be used across the curriculum for teaching, learning, and note-taking. They are easy to create and impactful in simplifying information.
- Help visualize or present information in a way that is easier to comprehend, by breaking down larger or complex concepts or ideas into smaller and simpler parts.
- Provide students the opportunity to actively contribute and participate in the learning process through the creation of graphic organizers.
- Help develop cognitive skills such as brainstorming, critical and, categorizing and prioritizing content, reflection, etc.
- Help recall prior knowledge about a subject and quickly connect it to new information
- Promotes self-learning. By using graphic organizers for note-taking, analyzing, studying, etc. students can familiarize themselves with a lesson far more easily.
Types of Graphic Organizers
Here we have listed 19 types of graphic organizers for teaching and learning. Based on their varied purposes, you can utilize them in reading, writing, researching, brainstorming, and analyzing.
Graphic Organizers for Writing
1. persuasion map.
The persuasion map is an interactive graphic organizer that helps students familiarize themselves with the process of persuasive writing . It assists them with outlining and preparing arguments for their essays, speeches, debates, etc.
How to use it
Step 1: Choose a topic of interest for your essay/debate. Do proper research around it to collect enough information.
Step 2: Define the claim that you want to make with your essay. Persuasive writing by writing this down first.
Step 3: Next to it, write down the reasons for making that claim.
Step 4: Then write down facts, examples, and information to back up your reasoning.
Step 5: End your persuasion map with the conclusion of your essay.

2. Sequence Chart
A sequence graphic organizer is a tool that helps visualize the order of steps of a process or a timeline of events, etc. It can also be used for note-taking, lesson planning, and essay writing.
Step 1: Identify the steps in the process or event.
Step 2: Using a sequence chart arrange these steps in sequential order.

Graphic Organizers for Reading
3. story map.
A story map can be used to identify the different elements such as characters, character plots, themes, techniques, etc. in a book students are reading. It’s a useful tool that teachers can integrate into the lesson to improve students’ comprehension.
Step 1: Read the book and understand it well.
Step 2: Discuss the different significant elements that were involved in the story. These could be the characters, setting, problem and solution, etc. You can fill the story map during the discussion.
Step 3: Once the map is complete you can discuss each element individually.

4. Biography graphic organizer
This is a tool that assists with understanding a character from a novel, autobiography or movie or a historical figure more in-depth. It brings attention to various important factors about a person’s life.
How to create it
Step 1: Gather as much information you can about the character you are studying. You can also refer to online resources, or ask from teachers or experts.
Step 2: As you analyze the information you have gathered, isolate the facts that stand out or you think are important.
Step 3: Use your biography graphic organizer to lay out the information in a presentable way. You can add images to make it more comprehensible as well.

5. KWL chart
KWL chart is used for gathering information from student’s prior knowledge or experience. This 3 column chart captures the before (what the reader already knows), during (what the reader wants to learn) and after (what the reader learned) stages of reading.
Step 1: Get students to brainstorm around the selected topic and write down everything they know about it in the K column.
Step 2: Ask them to generate a list of questions about what they want to know in the W column of the chart.
Step 3: During or after reading the book/ lesson get them to answer these questions in the L column.

Graphic Organizers for Teaching
6. learning map.
Learning maps visually depict the key takeaways – skills, ideas, knowledge – students should get from a lesson. It usually provides a high-level view of the lesson/ unit/ course that is to be studied and the connection between its different components. Students can also use learning maps in the classroom for note-taking.
Step 1: At the center of the map, write down the topic (i.e. name of the lesson or unit)
Step 2: Brainstorm ideas and information related to it. Write these down on branches emerging from the center. Make sure that you place them in a way that makes sense to teach or in a logical sequence around the center.
Step 3: Add connectors between these elements and add labels to highlight the kind of relationship between them.

7. Analogy graphic organizer
The analogy graphic organizer uses analogy to help students identify similarities and differences between a new topic and a topic that they are already familiar with.
Step 1: Select a topic/ concept that the students already know and is analogous in certain aspects to the new topic
Step 2: Introduce the new concept and get the students to read and discuss it
Step 3: Using an analogy graphic organizer, ask the students to brainstorm and write similarities and differences between the two topics.
Step 4: Based on the completed graphic organizer, ask the students to write a brief description of the new topic

Analogy Graphic Organizer (Click on the template to edit it online)
8. Vocabulary graphic organizer
This tool can be used to assess the vocabulary knowledge of students. You can create graphic organizers including various elements to help students learn new words, and learn antonyms and synonyms.

9. Problem-solving organizer
Problem-solving graphic organizers can be used to improve the problem-solving skills of the students. It helps students identify and evaluate solutions to problems.
Step 1: Identify the problem and write it in the problem box
Step 2: Ask students to then write down why they think it is a problem in the first place
Step 3: Get them to brainstorm all possible solutions along with the pros and cons relates to them.
Step 4: Once they select the best possible solution, ask them to list down all its possible consequences
Step 5: Students can then make suggestions to improve the selected solution further

10. Math Graphic Organizer
Math graphic organizers are used to describe math concepts graphically to students. It helps with simplifying and solving complex math problems.
Step 1: Select the math problem you want to identify and a relevant graphic organizer that you can use to solve it.
Step 2: Invite your students or colleagues to collaborate as you wish.

Graphic Organizers for Learning
11. timeline graphic organizer.
Timeline diagrams are a type of graphic organizer that shows a sequence of events in chronological order.
They come in handy when studying history as you can use it to display major historical events that occurred during a period of time along with important details such as dates and locations in which they took place.
In addition, timeline charts can also be used to show the progress of something (i.e. growth of a business) or changes.
Step 1: Identify the different events and the sequence of order in which they took place.
Step 2: Use a research on your target audience to arrange them chronologically
Step 3: Include significant details such as dates, locations and other additional information as needed.

12. T chart
T charts allow students to study two facets of a topic. For example, disadvantages and advantages, pros and cons, differences and similarities, etc.
Step 1: Draw a T chart and write down the two areas you want to brainstorm around on each column head.
Step 2: Write down facts on each column as you carry out your brainstorming.

13. Hierarchy chart
Hierarchy charts visualize the elements of a system, organization or concept from its highest position to the lowest. Students can use this tool to understand the superordinate and subordinate categories of a topic and the relationship between them.
Step 1: Identify the most important element under the topic you are studying. Write this down at the top of the hierarchy chart.
Step 2: List down the second layer of sub-elements stemming from the first component you have identified. Add a third and fourth as necessary.
Step 3: Connect these with lines to show how they are connected to each other.

14. Star diagram
Star diagrams are used to organize the characteristics of a chosen topic. It can also be used to brainstorm around new topics.
Step 1: Select the topic you want to study and write it down in the center of the star diagram .
Step 2: Write down the characteristics or attributes related to the central topics on each point of the star. Adjust the points of the star depending on how many traits you write down.

Graphic Organizers for Brainstorming
15. cluster diagram.
Cluster diagrams can be used to facilitate a brainstorming session or structure idea generation and even to help with exploring new topics.
Step 1: Pick your topic of interest to explore. This should be placed in the middle of the diagram.
Step 2: Brainstorm around this main idea and come up with sub-topics related to it. Place them around the center.
Step 3: Brainstorm around each of the sub-topics and write down related ideas around them.
Step 4: Add as many layers as you want. However, use color-coding to emphasize each branch of thought. This will make it easier for you to read and understand the cluster diagram .

16. Lotus diagram
Lotus diagram is an analytical tool that can be used to breakdown broader and more complex topics into smaller components for easy understanding. It can be used for brainstorming and studying new topics.
Step 1: Draw a 3×3 grid in the center. On the square in the center, write down the main topic to be explored.
Step 2: Write down the related sub-topics around it as you brainstorm.
Step 3: Draw 8 more 3×3 grids around the one in the center. Each of these can be used to write down facts that you brainstorm around each subtopic.

17. Cause and effect graphic organizer
This type of graphic organizer shows the causes and effects of an event. The cause is the reason why something has happened, and effect is the result of what has happened. Visualization helps clearly understand the different cause and effect relationships.
Using a cause and effect graphic organizer , identify the causes and effects related to the problem you are studying or writing about. There could be several models of cause and effect events, such as one cause leading to one effect or multiple effects, or multiple causes leading to one effect or multiple effects.
- One cause leading to several effects
- Several causes leading to one effect (You can use a fishbone diagram here)
- Each cause having one related effect
- One cause triggering another cause that leads to another

18. Mind map
A mind map is a tool that helps capture the free flow of thought and is widely used for brainstorming around topics. Additionally, it can also be used to organize and group information about a topic.
Step 1: Write down the topic you are brainstorming around in the center.
Step 2: On branches emerging from the middle, write down brainstormed ideas/ thoughts.
Step 3: Expand each sub idea with more facts. You can keep on adding more information to your mind map until you have enough.

Graphic Organizers for Compare and Contrast
Here we have listed 19 types of graphic organizers for teaching and learning. Based on their varied purposes, you can utilize them in reading, writing, researching, brainstorming, and analyzing. Best of all you can use our Compare and Contrast Chart Maker to draw them.
19. Double bubble map
The double bubble map is one of the popular thinking maps. It is much like a Venn diagram and is used to identify similar and different qualities between two things.
How to use it?
Step 1: Write down the two ideas/ topics you are comparing in the two bubbles in the center.
Step 2: As you brainstorm and analyze the topic, write down the differences in the bubbles radiating from the center.
Step 3: Write down the similarities in the bubbles that are common to both topics.

20. Venn diagram
Another graphic organizer that helps you visually represent a comparison of differences and similarities between two subjects, is the Venn diagram. What makes it different from the is that it can include more than two topics and one common area.
It works similar to the double bubble map.
Step 1: Write down the topics being compared on the top of each circle.
Step 2: Writ down the differences or unique characteristics inside its own sector avoiding the overlapping area.
Step 3: List the similarities in the common area.

Add to Our List of Graphic Organizers for Teachers and Students
Although we have covered 19 types of graphic organizers in this post, there are plenty more that can be useful to our users. Know more? Mention in the comments section below to keep expanding the list of ultimate graphic organizers.
FAQs About list of Graphic Organizer
When selecting a graphic organizer for a specific project, you should consider the type of information you need to organize and the purpose of the project. Here are some tips on how to select the right graphic organizer:
Identify the type of information: Before selecting a graphic organizer, consider the type of information you need to organize.
Determine the purpose of the project: Consider the purpose of the project and what you want to achieve.
Consider the audience: Think about who the audience is for the project. If the audience is young children, a simpler graphic organizer like a picture web might be more appropriate. If the audience is adults, a more complex graphic organizer like a timeline or a chart could be suitable.
Evaluate the effectiveness of different graphic organizers: Try out different graphic organizers and see which ones work best for you. Creately has different graphic organizer editable templates that you could use to create your graphic organizer based on the purpose.
Be creative: Don’t be afraid to create your own graphic organizer or adapt an existing one to meet your needs. Graphic organizers are flexible tools that can be customized to fit different projects and purposes.
Avoid these common mistakes that you make to ensure that your organizer is effective in conveying information.
Avoid overcomplicating the design of your graphic organizer: It should be easy to read and understand, therefore avoid using too many colors, fonts, or shapes which make the organizer confusing and difficult to read.
Consistency is important in creating a graphic organizer. Use the same formatting, color scheme, and font throughout the organizer to ensure that it is easy to follow and understand.
The purpose of a graphic organizer is to simplify and organize information. Including too much information can defeat the purpose and make the organizer overwhelming. Stick to the most important information and use the organizer to highlight key concepts and relationships.
Use clear and appropriate labels for each section of the organizer. Avoid using labels that are too vague or unclear, as this can cause confusion and make it difficult to understand the relationships between the different elements.
Consider who the audience is for the graphic organizer and use appropriate language and images. Avoid using jargon or technical terms that may not be familiar to the audience.
Test your graphic organizer to ensure that it effectively conveys the intended information. Ask for feedback from others and make revisions as needed.
Join over thousands of organizations that use Creately to brainstorm, plan, analyze, and execute their projects successfully.
More Related Articles

Amanda Athuraliya is the communication specialist/content writer at Creately, online diagramming and collaboration tool. She is an avid reader, a budding writer and a passionate researcher who loves to write about all kinds of topics.
- WordPress.org
- Documentation
- Learn WordPress
- Members Newsfeed
Graphic Organizers 101: Why and How To Use Them
- EdTech & Innovation
Introduction:
Visual learning has gained significant attention over the past few years, especially in the education sector. One such visual learning tool is a “graphic organizer.” This article will explore what graphic organizers are, why they are an essential learning tool, and how to use them effectively.
What are Graphic Organizers?
Simply put, graphic organizers are visual aids that help learners organize and present information visibly. They make use of diagrams, charts, mind maps, or other graphical elements to represent concepts and ideas in a structured manner. By doing so, graphic organizers enable learners to gain a deeper understanding of the subject matter by uncovering connections and relationships between various pieces of information.
Why Use Graphic Organizers?
1. Enhance Understanding: The human brain can process visual content more efficiently than textual data. Graphic organizers capitalize on this by visually representing complex ideas or concepts that might be difficult to understand through text alone.
2. Foster Critical Thinking: By breaking down complex ideas into smaller components, graphic organizers encourage learners to analyze each aspect individually and identify connections between them.
3. Improve Memory Retention: Studies show that information presented visually is retained better than verbal-only material. Thus, using graphic organizers can significantly improve memory retention and recall.
4. Aid in Organization and Planning: Graphic organizers offer an excellent way for students to structure their thoughts and ideas as they plan out essays, projects, or presentations.
5. Facilitate Differentiated Instruction: Since students learn at different paces and with varied styles, graphic organizers serve as a versatile learning tool that can be adapted to suit individual needs.
How To Use Graphic Organizers:
1. Choose the Right Organizer: Begin by selecting a graphic organizer suitable for your specific learning objectives. Some common types include Venn diagrams for comparing/contrasting ideas, timelines for chronological events, or flowcharts for processes.
2. Gather Your Material: Collect the necessary information related to your topic. This might include relevant facts, figures, quotes, or other critical pieces of data.
3. Break Down the Information: Analyze the gathered material and divide it into smaller components or subtopics. These will correspond to individual sections or elements of your graphic organizer.
4. Organize and Represent: Start building your graphic organizer by placing key ideas within their designated sections or boxes. Next, create connections and relationships using arrows, lines, or other visual aids.
5. Simplify and Refine: Finally, review your graphic organizer and simplify or refine the content wherever possible. Ensure that your final result is visually appealing and easy to read.
Conclusion:
Graphic organizers are a powerful tool that can enhance both teaching and learning. By incorporating these aids into classrooms, students can efficiently process information, improve critical thinking skills, memory retention, organizational skills, and cater to different learning styles. Start harnessing the power of these versatile tools today, and witness the positive impact they can have on your educational journey.
Related Articles

Incorporating technology in the classroom is an effective way to engage students…

In the educational arena, Bump It Up walls have become a popular…

Decision making is a critical life skill that allows individuals to navigate…
Pedagogue is a social media network where educators can learn and grow. It's a safe space where they can share advice, strategies, tools, hacks, resources, etc., and work together to improve their teaching skills and the academic performance of the students in their charge.
If you want to collaborate with educators from around the globe, facilitate remote learning, etc., sign up for a free account today and start making connections.
Pedagogue is Free Now, and Free Forever!
- New? Start Here
- Frequently Asked Questions
- Privacy Policy
- Terms of Service
- Registration
Don't you have an account? Register Now! it's really simple and you can start enjoying all the benefits!
We just sent you an Email. Please Open it up to activate your account.
I allow this website to collect and store submitted data.
- How we help
- Individuals with ADHD
- Care Teams & Providers
- Our Coaches
- Join Our Team
- Blogs & Guides

How to Organize an Essay: 3 Graphic Organizers for Young Writers
By Pia Cisternino

As a parent, you may find yourself thinking, “My child is smart and articulate, so why are writing assignments so stressful?” Writing is a complex task that requires a student to access multiple executive function skills. To be able to write an essay, a student must be able to 1) attend to and comprehend the teacher’s instructions, 2) create a plan for the form and content of an essay, and 3) follow through with that plan. When you think about the processing and planning skills that a student must integrate in order to compose an essay, it makes sense that even a small writing assignment can cause frustration.
Many people, including students diagnosed with ADHD , students with high-functioning ASD , and students who are twice exceptional (intellectually gifted students with special education needs) find that executive function skills are far from second nature. But when equipped with the proper tools and support, the same students can become effective writers. A graphic organizer is one of the tools that executive function coaches use to enable students to organize and plan their writing.
We all use templates in our daily lives. Whether you’re balancing your checkbook or composing an email, a template helps you to keep your information organized. Similarly, a graphic organizer functions as a template, formatted to keep a student’s writing organized. For students who feel overwhelmed by a writing task, graphic organizers provide a way to break up the task into clear and manageable parts. It’s like a road map to show them where to go. Many students find that once they learn how to organize an essay with a graphic organizer, writing becomes easier and much less stressful .
There are many different types of graphic organizers. So, one may ask, which are most effective? Just as your calendar template serves a different purpose from your resume template, the type of template a student needs depends upon the type of writing that has been assigned.
According to the Common Core , students are expected to become proficient with the following types of writing: 1) opinion/argumentative/persuasive writing, 2) informative/ explanatory writing, and 3) narrative writing.
The organizers listed below, the deliciously named OREO, BLT, and Ice Cream graphic organizers, are formatted to help students in elementary school organize their opinion writing, informative writing, and narrative writing, respectively.
Opinion Writing
The OREO Graphic Organizer lays out the basic structure for an opinion essay. OREO stands for Opinion, Reason, Example, and Opinion restated.
Informative Writing
The BLT Graphic Organizer helps a student to plan a single, informative paragraph. The paragraph must include an introduction, a thesis statement, supporting sentences, and a conclusion.
Narrative Writing
The Ice Cream Graphic Organizer is a template for narrative writing. It includes the basic components of a narrative essay: characters, setting, problem/event, and resolution.
Whether or not a student has a formal diagnosis of a learning difference , the truth is that everyone has strengths and weaknesses. Any approach to supporting executive function skills should capitalize on a student’s areas of strength, in order to improve their areas of weakness. For instance, if a student demonstrates high abilities in the visual spatial domain, then it makes sense to use a strategy that visualizes the writing process. These organizers allow young writers to visualize a framework for the kinds of information they will need to include in a given paragraph or essay. As students get older and writing demands become more complex , the structure of graphic organizers expands as well. As executive function coaches , we see that even the most gifted student can benefit from a structured approach to the art of writing.
Please see this page for comprehensive information about Executive Function in Elementary students.
Pia Cisternino, M.A., M.S. is an executive function coach at Beyond BookSmart and a speech-language pathologist, with over a decade of experience working with students diagnosed with ADHD, autism, Asperger’s, and learning disabilities. She received her B.A. from Tufts University, where she majored in English and Italian, and continued to study literature at Johns Hopkins University, where she received an Master’s degree in Creative Writing and Poetry. She went on to receive a Master’s degree in Speech and Language Pathology from Teacher’s College at Columbia University. A strong advocate for students with special education needs, Pia founded and facilitated a support group for parents of 2e (twice exceptional) children, and served for two years as co-chair of the Parent Advisory Council on Special Education (C-PAC) within her local school district.. Pia’s approach to coaching centers around enabling students to build skills by utilizing their own individual strengths.
About the Author
Pia cisternino.
Pia Cisternino, M.A., M.S. is an executive function coach at Beyond BookSmart and a speech-language pathologist, with over a decade of experience working with students diagnosed with ADHD, autism, Asperger’s, and learning disabilities. She received her B.A. from Tufts University, where she majored in English and Italian, and continued to study literature at Johns Hopkins University, where she received an Master’s degree in Creative Writing and Poetry. She went on to receive a Master’s degree in Speech and Language Pathology from Teacher’s College at Columbia University. A strong advocate for students with special education needs, Pia founded and facilitated a support group for parents of 2e (twice exceptional) children, and served for two years as co-chair of the Parent Advisory Council on Special Education (C-PAC) within her local school district.. Pia’s approach to coaching centers around enabling students to build skills by utilizing their own individual strengths. She lives in Cambridge, Massachusetts with her husband and children.
Previous Post
Executive Function Skills: A Foundation for Success at School & Beyond
The Adolescent Brain: Executive Functioning in Adolescence
Latest Post
How much screen time is too much 4 expert screen use tips for parents, how to improve working memory for kids: 5 expert tips, 22 adhd coping skills that you need to learn, related post, why your child won't use a graphic organizer.
It’s Monday night, and your child is agonizing over starting the essay that is due first thing on...
How to Help Your Child Get Organized
At this point in the school year , students and parents have often (mostly) overcome the initial...
Getting Organized: Minimizing Clutter In 4 Easy Steps
Clutter, now that school is underway, has had a chance to take hold and start growing at a rapid...
Use Outlines, Notetaking, Graphic Organizers, Lists (English I Writing)
Introduction

Getting ready to write a paper is like building the steel frame for a building. First, you need to choose your materials by generating ideas and questions as you did in the previous lesson. Next, you need to integrate your materials to build a structure. Whether writing an essay or a short story, nonfiction or fiction, you need a plan. Before you get started, however, let's take some time to review what you accomplished in the previous lesson. So far, you (1) determined your purpose and audience and (2) developed a topic by brainstorming ideas.
In this lesson, you will use the prewriting strategies of note-taking, graphic organizers, outlines, and lists to help you evaluate and organize your ideas for either an expository essay or a short story . There are two main reasons to use prewriting strategies.
First, they make a paper easier to write because prewriting strategies allow you to plan the organization and flow. Being organized allows you to focus on separate, shorter sections one at a time and feel confident that what you are writing will fit into the story or essay as a whole. This means that you will be less likely to wander off topic. You will also be able to evaluate what works and what doesn't and revise accordingly.
Second, your writing will be more reader friendly. As a writer, your ultimate goal should be to produce clear, informative, and interesting writing that engages your target audience.
Images used in this section: Source: Easi-edge safety barriers-geograph.org.uk-540015, Steve F, Wikimedia
Taking Good Notes

Let’s begin by finding out what you know and what you don’t know about the expository essay topic “The Great Texas Drought of 2011.” Several strategies can help you to figure out this information. The first strategy you will learn about is note-taking, something you have probably done in your classes. However, the Cornell system of note-taking, which you will learn, is a popular and effective note-taking method that may be new or different from your past experiences. This strategy isn’t the only way to take notes, but in this lesson, it’s the one we will use.
No matter what method you use to take notes, you need evidence from magazine or newspaper articles, reference books, websites, or other reliable sources. You might also choose to include personal anecdotes or conversations and interviews that you conducted with weather experts or people who experienced “The Great Texas Drought of 2011” firsthand.
Cornell Notes
To use the Cornell method of taking notes, you need to set up your notebook. You can use individual sheets of paper, but when possible, use a notebook. It will keep your notes together and in order. To begin setting up your notebook, follow these steps:
- If your notebook paper doesn’t include a line at the top, draw one as shown in the example below.
- Draw a dark horizontal line about six lines or two inches from the bottom of the page.
- Draw a dark vertical line about three inches from the left side of your notebook paper. Start at the top and stop at the bottom horizontal line you drew in the previous step.
- Write the name of the course, the title of the assignment, and the date on the top line of the page.
Note: We have created space for three main ideas in the example below, but you may have more or fewer for different topics.
It will also be helpful to keep these guidelines in mind:
- Use the column on the left to write main ideas.
- Use the column on the right to write notes.
- Skip a line between ideas and topics so they don’t get mixed up.
- Try not to use complete sentences; they take up a lot of space.
- Write a brief summary of the main ideas in the bottom section.
- Once you’re finished taking notes about the source material, check that what you have written makes sense to you.
Let’s look at an example of how to use Cornell note-taking for writing an expository essay with the topic “The Great Texas Drought of 2011.” Click the link to download the Cornell Notes template . Keep it open to take notes on the three sources you are about to read. Pretend that you found these sources while conducting preliminary research on your topic: a news video, a photographic slide show, and a newspaper article.
Watch this video segment about the drought from the previous lesson called “Generate Ideas and Questions.” For this first source, we listed the main ideas for you, but feel free to use the Cornell Notes handout to take notes about supporting details or other ideas that interest you in this video.

The main ideas from the video segment are as follows:
- 2011 drought may become long-term
- History-making drought that people will remember for a long time
- Every major Texas heat record was broken (including hottest summer ever, hottest month ever, hottest August temperature, most 90- and 100-degree days).
- Cause of heat: Dry soil leads to higher temperatures
- Cause of drought: Two years of La Niña
- In 150 years of record-keeping, Austin has never had a drier year.
- Texas Agriculture: worst losses in history, totaling five billion
- Climatologist: drought could last until 2020, similar to 1950s drought.
- Other scientists suggest that we can’t accurately predict a long-term drought and can expect rainy periods within a long drought.
Take a look at the photographic montage about the drought. When you’re finished, use the Cornell Notes handout to write down the main ideas, supporting details, and anything else you found interesting.
Source: Texas Parks and Wildlife, Texas Parks and Wildlife’s Photostream, Flickr.
Finally, read this newspaper article about the drought. When you’re finished, use the Cornell Notes handout to write down the main ideas, supporting details, and anything else you found interesting.
AUSTIN, Tex. SOMETHING odd happened here last week. It rained. But the relief, an answer to desperate prayers, is likely to be short-lived. The drought that has gripped much of Texas since the fall of 2010 shows few signs of abating soon. The latest forecasts say that parched West and South Texas will remain dry, and that the state is likely to see above-average temperatures this spring, increasing evaporation from already strained reservoirs. The conditions could lead to severe water restrictions in some parts of the state. The implications have finally sunk in among lawmakers and business leaders here, who like to boast about the economic appeal of Texas’s low taxes and relaxed regulatory environment: no water equals no business. In a state fabled for its everything-is-bigger mentality, the idea of conserving resources is beginning to take hold. They are even turning sewage into drinking water. —New York Times
Now that you have read and created notes for all three sources using the Cornell Notes handout, examine the image below to see how another student used Cornell Notes to collect information from the three sources.

When you find sources you plan to use in your essay, don’t forget to write down the authors, titles, locations, website addresses, journal names, dates published and any other important bibliographic information.This documentation will be important for locating the sources later and for listing them in the bibliography or references section of your essay.
For example, we wrote the information about the three sources above on the back of our notes so that this documentation wasn’t lost. To see the kinds of information we collected, review the sources below:

Images used in this section: Source: Cracked Lake, crowt59, Flickr Dust Bowl 1935, MyEyeSees, Flickr Source: Texas Parks and Wildlife, Texas Parks and Wildlife’s Photostream, Flickr Source: Handwritten notes, IPSI Source: Resources list, IPSI
Using Graphic Organizers
In addition to Cornell Notes, graphic organizers are another effective method for arranging your ideas. Graphic organizers are also called visual maps, mind maps, and visual organizers. The information that you include in them can be identical to the information you gather when taking notes, except that the information is organized visually.
Notice the way the vegetables are arranged in the photograph below. Each type of vegetable is grouped—carrots one place, lettuces another, and so on. This picture is a visual organizer in a sense because it visually arranges the vegetables. In this section, you will learn how to visually arrange information for the topic “The Great Texas Drought of 2011.”

One way to organize ideas for an essay is to use grouping—also known as mind mapping and concept webbing . These terms refer to ways of relating ideas to each other. Study the example below.

Do you see how the categories are organized? The subject, “The Great Texas Drought of 2011,” appears in the largest oval. We know this text is the subject or topic because every other oval connects to it either directly or indirectly. The main ideas appear in the blue ovals: “One of the worst in Texas history” and “May be the start of a longer drought.” These ovals connect directly to the subject. The supporting details appear in the red ovals: “5 billion agricultural dollars,” “All major heat records broken,” and “Could last until 2020.” These details connect to the two main ideas.

Study the relationships in the graphic organizer below. Decide whether each idea should be the subject, a main idea, or a supporting detail. When you have an answer in mind, drag and drop the idea into the correct oval.
After organizing our notes in a graphic organizer, let’s create a working outline. Did you notice that the structure of the two graphic organizers in this section created a visual outline? For example, the information from the first graphic organizer could be used to create a working, text-only outline that looks like this:
The Great Texas Drought of 2011 One of the worst in Texas history All major heat records broken Five billion agricultural dollars lost in Texas May be the start of a longer drought Could last until 2020
You could have created the same outline using the topic, main ideas, and supporting details from your Cornell Notes page. It doesn’t matter whether you use notes or a graphic organizer to create an outline as long as the working outline helps you write the first draft of your paper. While you are writing the first draft, you may want to revise, change how ideas are arranged, or add new information. You can change your working outline in each and every instance. Who knows? Even your thesis may change!
That’s why this outline is called a “working” outline and not a “formal” or “final” outline; it can be revised over and over again. In fact, it’s important not to commit to a detailed plan that will discourage changes during the drafting process. You can develop a formal outline to serve as a checklist for logic, coherence, and unity in your paper after you finish writing the first draft.
Images used in this section: Source: Veggies, Calliope, Wikimedia Source: Blowing Sand on Lakeshore, TexasEagle, Flickr
Making Lists

In this lesson, you have learned how to use note-taking, graphic organizers, and working outlines to plan an expository essay about “The Great Texas Drought of 2011.” Suppose your teacher asks you to write a short story about your experiences during the drought. In the second and third sections of this lesson, you collected factual information about the drought, but let’s think about what you will need to write a short story. For starters, your story can be set in the past, the present, or the future. Since it’s fictional, you can include colorful characters and dialogue. You can also paint your own picture of the drought by using personal details in the writing. One way to develop ideas for your story is to make lists.
People organize their daily lives using to-do lists, grocery lists, and schedules. For this lesson, we will focus on listing as a prewriting strategy. Listing is an important part of the writing process because it can help you generate and organize ideas. One list-making method that some writers find helpful is to answer the Who , What , Where , When , Why , and How of your short story. Answering these questions can guide your thinking and note-taking.
Because you are writing a short story, remember to follow the guidelines used in the short story writing process. These guidelines were covered in the previous lesson, “Generate Ideas and Questions,” but let’s review them. Typically, a short story includes these elements: a beginning , middle , and an ending . If this sounds simple—almost too simple—you are right; there is more to it. Other lessons in the Writing Strand cover literary devices that authors use to vary this structure. For this lesson, however, you will use these basic parts of a short story:
- The beginning, or introduction, is where the characters and the setting are presented; the explanation of the plot or exposition occurs in the beginning.
- The middle includes actions or events in which the conflict of the story is exposed; rising action and the climax —or the turning point of the story—both occur in the middle. The falling action —where the conflict begins to be resolved—also occurs in the middle.
- The ending can also be referred to as the denouement ; the conflict is resolved and the action comes to a close in the ending.
This diagram illustrates the three parts of a short story.

You should be ready to write your story! In the future, when your teacher assigns an essay or short story, you will have strategies to organize your ideas. Using your notes, make a list of the strategies mentioned in this lesson. When you are finished, check your understanding. Check Your Understanding Sample response: Cornell notes, outlines, graphic organizers, and lists -->
Images used in this section: Source: Drought & MD Farming - Hurlock, MD, Step It Up 2000, Flickr
“ Drought of 2011 was one for the books .” KXAN. YouTube, 3:22. Posted October 17, 2011. //www.youtube.com/watch?v=UsIan4b5f_c.
Galbraith, Kate. “ Getting Serious About a Texas-Size Drought .” The New York Times , April 6, 2013. //www.nytimes.com/2013/04/07/sunday-review/getting-serious-about-a-texas-size-drought.html?_r=0
Texas Parks and Wildlife. Texas Parks and Wildlife’s Photostream, Flickr. Accessed January 5, 2012. //www.flickr.com/photos/texasparkswildlife/sets/ .
Copy and paste the link code above.
Related Items
EL Education Curriculum
You are here.
- ELA 2019 G8:M3:U2:L3
Write an Informative Essay: Plan Introduction and Body Paragraphs
In this lesson, daily learning targets, ongoing assessment.
- Technology and Multimedia
Supporting English Language Learners
Materials from previous lessons, new materials, closing & assessments, you are here:.
- ELA 2019 Grade 8
- ELA 2019 G8:M3
- ELA 2019 G8:M3:U2
Like what you see?
Order printed materials, teacher guides and more.
How to order
Help us improve!
Tell us how the curriculum is working in your classroom and send us corrections or suggestions for improving it.
Leave feedback
Focus Standards: These are the standards the instruction addresses.
- RL.8.1, RL.8.2, W.8.2a, W.8.2b, W.8.4, W.8.5, L.8.1a
Supporting Standards: These are the standards that are incidental—no direct instruction in this lesson, but practice of these standards occurs as a result of addressing the focus standards.
- RL.8.10, W.8.10
- I can identify the purpose of each part of the introduction of a model literary analysis and use this understanding to plan the introduction of my own literary analysis. ( W.8.2 )
- I can identify the structure and purpose of each part of a Proof Paragraph and use this understanding to plan the Proof Paragraphs of my own literary analysis. ( W.8.2 )
- Opening A: Entrance Ticket
- Work Times B and C: Informative Writing Plan graphic organizer ( W.8.2 )
- Work Time C: Analyze a Model: Proof Paragraphs 1a and 1b ( W.8.2 )
- Closing and Assessment A: Informative Writing Checklist ( W.8.2 )
- Entrance Ticket: Unit 2, Lesson 3
- Literary Analysis Informative Essay directions
- Proof Paragraphs 1a and 1b handout
- Informative Writing Plan graphic organizer
- Ensure there is a copy of Entrance Ticket: Unit 2, Lesson 3 at each student's workspace.
- Strategically pair students for the peer critique in Closing and Assessment A with at least one strong reader per pair.
- Review the Informative Writing Plan graphic organizer (example for teacher reference) to become familiar with an example of the planning students will be doing today and in the next lesson.
- Post the learning targets and applicable anchor charts (see Materials list).
Tech and Multimedia
- Work Times A and B: Convert Informative Writing Plan graphic organizers and invite students to complete them in an online format—for example, http://eled.org/0158 .
- Continue to use the technology tools recommended throughout previous modules to create anchor charts to share with families; to record students as they participate in discussions and protocols to review with students later and to share with families; and for students to listen to and annotate text, record ideas on note-catchers, and word-process writing.
Supports guided in part by CA ELD Standards 8.I.B.6 and 8.I.B.8.
Important Points in the Lesson Itself
- To support ELLs, this lesson includes time spent analyzing a model informative essay that compares a familiar text, Summer of the Mariposas , with a poem before then writing an essay that focuses on analyzing the similarities and differences in theme and structure in Maus I and "Often a Minute" and the way in which these contribute to meaning. The lesson also includes time for peer feedback and collaborative discussion to help students improve their writing while also practicing oral skills.
- ELLs may find it challenging to understand portions of the model essay. While Summer of the Mariposas will be quite familiar to students, the poem that this text is compared to in the model is not something students will have a deep understanding of. Encourage students to focus on the structure of the essay and the way in which the author crafts points about similarities and differences. Remind students that for their own essays, they will be working with texts that they know well.
- Homework: Language, Structure, and Theme (example for teacher reference) (from Module 3, Unit 2, Lesson 2, Homework A)
- Characteristics of a Literary Analysis Essay anchor chart (one for display; from Module 3, Unit 2, Lesson 1, Work Time A)
- Model Literary Analysis Essay: Relationship of Structure to Meaning (example for teacher reference) (from Module 3, Unit 2, Lesson 1, Work Time A)
- Informative Writing checklist (for teacher reference) (from Module 3, Unit 2, Lesson 1, Work Time B)
- Homework: Language, Structure, and Theme (one per student; from Module 3, Unit 2, Lesson 2, Homework A)
- Model Literary Analysis Essay: Relationship of Structure to Meaning (one per student; from Module 3, Unit 2, Lesson 1, Work Time A)
- Informative Writing checklist (one per student; from Module 3, Unit 2, Lesson 1, Work Time B)
- Entrance Ticket: Unit 2, Lesson 3 (answer for teacher reference)
- Literary Analysis Informative Essay: Sample Student Response (example for teacher reference)
- Informative Writing Plan graphic organizer (example for teacher reference)
- Analyze a Model: Proof Paragraphs 1a and 1b (example for teacher reference)
- Homework: Structure and Meaning: "The Owl" (answers for teacher reference) (see Homework Resources)
- Entrance Ticket: Unit 2, Lesson 3 (one per student)
- Literary Analysis Informative Essay directions (one per student and one for display)
- Informative Writing Plan graphic organizer (one per student and one for display)
- Analyze a Model: Proof Paragraphs 1a and 1b (one per student and one for display)
- Homework: Structure and Meaning: "The Owl" (one per student; see Homework Resources)
Each unit in the 6-8 Language Arts Curriculum has two standards-based assessments built in, one mid-unit assessment and one end of unit assessment. The module concludes with a performance task at the end of Unit 3 to synthesize students' understanding of what they accomplished through supported, standards-based writing.
Copyright © 2013-2024 by EL Education, New York, NY.
Get updates about our new K-5 curriculum as new materials and tools debut.
Help us improve our curriculum..
Tell us what’s going well, share your concerns and feedback.
Terms of use . To learn more about EL Education, visit eleducation.org
Essay Structure: Anchor Chart / Graphic Organizer
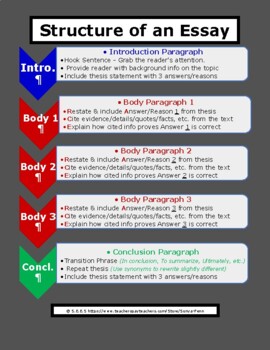
Description
Use this handy FREE resource to review the structure of an essay with students prior to teaching them how to write one.
It simultaneously gives students an overview of the writing steps to "build" the essay while also serving as a quick reference sheet so students can self-monitor as they write their essay.
This resource connects to the R.A.C.E. writing strategy and allows teachers to demonstrate how excelling at RACE writing strategy will help students writing the largest part of an essay - the body paragraphs.
Essay Structure - PDF
Questions & Answers
- We're hiring
- Help & FAQ
- Privacy policy
- Student privacy
- Terms of service
- Tell us what you think
Essay Papers Writing Online
Effective essay writing graphic organizers to enhance your academic writing skills.

Are you looking for ways to enhance your essay writing skills? Do you struggle to organize your thoughts and ideas effectively? Utilizing graphic organizers can be the key to improving your writing process and producing more cohesive and structured essays.
Graphic organizers are visual tools that help writers brainstorm, plan, and organize their writing. They provide a visual representation of the relationships between ideas, making it easier to see the big picture and the flow of your essay. By using graphic organizers, you can break down complex topics into manageable chunks and create a roadmap for your writing.
Whether you’re a student working on academic essays or a professional writer crafting articles, utilizing graphic organizers can make a significant difference in the clarity and coherence of your writing. In this article, we will explore the benefits of using graphic organizers, discuss different types of organizers, and provide tips on how to effectively incorporate them into your writing process.
Master the Basics
Before delving into the complexities of essay writing, it is crucial to master the basics. Understanding the fundamental elements of an essay, such as the introduction, body paragraphs, and conclusion, is essential for crafting a coherent and compelling piece of writing.
- Start with a strong introduction that grabs the reader’s attention and clearly states your main argument.
- Develop your ideas in the body paragraphs with supporting evidence and analysis.
- Conclude your essay by summarizing your key points and reinforcing your main thesis.
By mastering these basic components of essay writing, you can better structure your ideas and effectively communicate your thoughts to your audience.
Understanding the Essay Structure
When it comes to writing an effective essay, understanding the structure is crucial. An essay typically consists of three main parts: an introduction, body paragraphs, and a conclusion.
Introduction: This is where you grab the reader’s attention and provide a brief overview of what your essay will be about. The introduction should also include a thesis statement, which is the main point or argument of your essay.
Body paragraphs: The body of your essay is where you develop your argument and provide supporting evidence. Each paragraph should focus on a single point and include detailed explanations and examples to support your thesis.
Conclusion: The conclusion is where you wrap up your essay by summarizing your main points and restating your thesis. It’s also a good place to leave the reader with a thought-provoking idea or call to action.
By understanding and utilizing this basic essay structure, you can ensure that your writing is clear, organized, and effective.
Choose the Right Organizer
When it comes to effective essay writing, choosing the right graphic organizer can make a significant difference in organizing your thoughts and boosting your writing skills. There are various types of organizers to choose from, such as the outline, Venn diagram, flowchart, concept map, and more. It’s essential to select an organizer that best fits the structure of your essay and helps you clearly outline your ideas.
Outlining: If you prefer a straightforward approach, an outline organizer can help you create a clear and organized structure for your essay. Use headings and subheadings to categorize your main points and supporting details.
Venn Diagram: A Venn diagram can be useful when comparing and contrasting ideas or topics. It allows you to visually represent the similarities and differences between two or more concepts.
Flowchart: For essays with a sequential flow of ideas, a flowchart organizer is ideal. Create a visual representation of the sequence of events or steps in your essay to ensure a logical progression of ideas.
Concept Map: If you want to explore the relationships between different concepts in your essay, a concept map can help you visualize the connections between ideas and brainstorm new insights.
Choosing the right organizer is crucial to effectively structure your essay and enhance your writing skills. Experiment with different types of organizers to find the one that best suits your writing style and helps you convey your ideas clearly and cohesively.
Selecting the Best Graphic Tool
When choosing a graphic organizer tool for your essay writing process, it is essential to consider various factors to ensure its effectiveness. Here are some key points to keep in mind:
- Type of Essay: Consider the type of essay you are writing and choose a graphic organizer that best fits the structure and organization needed for that particular essay type.
- Complexity: Evaluate the complexity of your ideas and arguments to determine the level of detail and hierarchy required in the graphic organizer.
- Visual Appeal: Look for a tool that is visually appealing and easy to comprehend, as this will help you better visualize and organize your thoughts.
- Flexibility: Opt for a tool that offers flexibility in terms of customization, allowing you to adjust the layout and structure based on your specific needs.
- Accessibility: Ensure that the graphic organizer tool you choose is accessible and easy to use on your preferred devices and platforms.
By carefully considering these factors, you can select the best graphic tool that will enhance your essay writing process and improve the clarity and coherence of your ideas.
Organize Your Ideas

Before diving into writing your essay, it’s crucial to organize your ideas to ensure a clear and coherent flow of information. Using graphic organizers can help you visually map out your thoughts and easily see how they connect. Here are some effective ways to organize your ideas:
- Outline: Create a detailed outline with main points, subpoints, and supporting evidence to structure your essay.
- Brainstorming: Brainstorm ideas and jot them down on a mind map to see relationships between different concepts.
- Cluster/Spider Diagrams: Use cluster or spider diagrams to group related ideas together and visualize the structure of your essay.
- Storyboard: Create a storyboard with key events or arguments to plan out the sequence of your essay.
By organizing your ideas using graphic organizers, you can enhance the clarity and coherence of your essay, making it easier for readers to follow your argument.
Mapping Out Your Thoughts

One of the most effective tools for organizing your thoughts and ideas before starting to write an essay is a graphic organizer. By using a graphic organizer, you can visually map out your thoughts, main points, and supporting details. This helps you clarify your ideas and ensure that your essay has a logical structure.
There are various types of graphic organizers you can use, such as mind maps, concept maps, Venn diagrams, and flowcharts. Choose the one that best suits your writing style and the topic of your essay. Once you have selected a graphic organizer, start by jotting down your main idea in the center and then branch out to include your supporting points and details.
Mapping out your thoughts using a graphic organizer will not only help you stay focused and organized but also make the writing process smoother and more efficient. It can serve as a roadmap for your essay, guiding you through each section and ensuring that your ideas flow cohesively.
Develop Strong Arguments
Effective essay writing requires the development of strong arguments to persuade the reader of your perspective. To create compelling arguments, follow these key strategies:
- Research: Conduct thorough research to gather credible evidence and support for your arguments. Use reliable sources to strengthen your points.
- Structure: Organize your arguments logically and coherently. Start with a clear thesis statement and build each argument in a structured manner.
- Counterarguments: Anticipate counterarguments and address them in your essay. This shows that you have considered different viewpoints and strengthens your own position.
- Evidence: Support your arguments with relevant evidence, such as examples, statistics, and expert opinions. This adds credibility and persuasiveness to your essay.
- Clarity: Clearly articulate your arguments and provide explanations to ensure that your points are easily understood by the reader.
- Consistency: Ensure that your arguments are consistent throughout the essay. Avoid contradictions or inconsistencies that may weaken your overall argument.
By developing strong arguments with these key strategies, you can enhance the effectiveness of your essay writing and convey your ideas convincingly to your audience.
Building a Persuasive Case
When writing a persuasive essay, it is crucial to build a compelling case to persuade your audience to agree with your viewpoint. Here are some key steps to help you construct a persuasive case:
- Clear Thesis Statement: Start by clearly stating your position or argument in a concise thesis statement. This statement should clearly convey what you are trying to persuade your readers to believe or do.
- Supporting Evidence: Back up your thesis statement with strong evidence, facts, statistics, examples, and expert opinions. Providing solid evidence can make your case more convincing and credible.
- Logical Organization: Structure your essay in a logical and coherent manner. Develop your arguments in a clear sequence, with each point building upon the previous one to strengthen your case.
- Address Counterarguments: Anticipate potential counterarguments and address them in your essay. Acknowledging opposing viewpoints and refuting them can make your argument more persuasive.
- Emotional Appeal: Use emotional appeals, anecdotes, and narratives to connect with your audience on a personal level. Appeal to the emotions of your readers to make them more likely to empathize with your argument.
- Call to Action: End your essay with a strong call to action that urges your audience to take a specific course of action or consider your perspective. Encouraging your readers to act can motivate them to support your cause.
By following these steps and building a persuasive case in your essay, you can effectively convince your audience to embrace your ideas and opinions.
Enhance Your Writing Flow
One of the key elements in effective essay writing is maintaining a smooth and consistent flow throughout your piece. A well-structured essay should lead the reader from one point to the next seamlessly, with each paragraph naturally transitioning into the next.
To enhance your writing flow, consider using transitional words and phrases such as “furthermore,” “however,” “in addition,” and “conversely” to connect your ideas and guide the reader through your argument. These transitions help establish logical connections between your thoughts and make your writing more coherent.
Additionally, vary your sentence structure and length to create a dynamic rhythm in your writing. Mixing short, punchy sentences with longer, more elaborate ones can keep your reader engaged and prevent your writing from feeling monotonous.
Finally, don’t be afraid to revise and reorganize your essay to ensure a smooth and consistent flow. Take the time to read your work aloud or have someone else review it to identify any awkward or disjointed sections that may disrupt the flow of your writing.
By paying attention to these techniques and practicing them regularly, you can enhance your writing flow and take your essay writing skills to the next level.
Related Post
How to master the art of writing expository essays and captivate your audience, convenient and reliable source to purchase college essays online, step-by-step guide to crafting a powerful literary analysis essay, tips and techniques for crafting compelling narrative essays.
IMAGES
VIDEO
COMMENTS
Use this graphic organizer to plan your analytical/persuasive essay. The introduction should start with a broad statement and end with your thesis statement, which "zooms in" on the points you will explore in more depth. The body paragraphs must contain evidence to support your thesis. (The number of body paragraphs coincides with the ...
Many students don't take the time to outline their essay structure before writing, and that always means a lower score on a test and a lower grade on the essay in class. ... 5-paragraph essay graphic organizer. When it comes to writing the five-paragraph essay, writing diagrams are key. By using graphic organizers for writing, you're no ...
Cause and Effect Graphic Organizer 1 Compare/Contrast Graphic Organizer 2 Concept Definition Map Graphic Organizer 3 Drawing Conclusions Graphic Organizer 4 Identifying Author's Purpose Graphic Organizer 5 Main Idea and Supporting Details Graphic Organizer 6 Making Inferences Graphic Organizer 7 Summarizing Graphic Organizer 8
The phrase "graphic organizer" is just a fancy way of saying "diagram" or "visual aid.". Basically, they are a visual representation of the information you've acquired in the research process. There are quite a few reasons why you should use them when writing essays or summaries. Helps you visualize your research and how elements ...
Example 1: 5 Paragraph Essay Graphic Organzier. The most common type of essay writing format is a 5-paragraph essay. Essay graphic organizer for writing helps organize all those 5 paragraphs and insert valuable information inside them. It includes the first paragraph section in which the writer inserts the topic sentence and at least three thesis statements.
A hierarchy chart, also known as an organizational chart, is a graphic organizer that illustrates the structure of an organization or a system. It is structured in a top-down manner, with the highest level at the top (like a CEO or the main concept) and subsequent levels representing different ranks or sub-categories.
The structure and format of the graphic organizers explained below will work wonders for student confidence and abilities in the expository writing arena. ... visual aspect of a cause and effect graphic organizer works extremely well for setting up an expository paragraph or essay. ... The graphic organizer should assist students in identifying ...
The Persuasion Map is an interactive graphic organizer that enables students to map out their arguments for a persuasive essay or debate. Students begin by determining their goal or thesis. They then identify three reasons to support their argument, and three facts or examples to validate each reason. The map graphic in the upper right-hand ...
Writing an Essay: A Graphic Organizer. Flyer. Use this graphic organizer to plan your analytical/persuasive essay. Download.
How to Use Graphic Organizing to Write Better Essays. 5-paragraph essay graphic organizer. When computer comes to writing the five-paragraph essay, writing diagrams are key. By employing graphic organizers for writing, you're no longer staring at a giant blank piece away paper with no idea as oder where to begin. Your graphic organizer is ...
Grades. Launch the tool! Expository writing is an increasingly important skill for elementary, middle, and high school students to master. This interactive graphic organizer helps students develop an outline that includes an introductory statement, main ideas they want to discuss or describe, supporting details, and a conclusion that summarizes ...
Brainstorm Chart. Concept Map. 5-Paragraph Essay Outline. 4 Square Writing Chart. Story Map. KWL Chart. 1. Flowchart. The Flowchart is one of the most versatile and recognizable forms of graphic organizer out there, ideal for project planning and science experiments.
Here we have listed 19 types of graphic organizers for teaching and learning. Based on their varied purposes, you can utilize them in reading, writing, researching, brainstorming, and analyzing. Best of all you can use our Compare and Contrast Chart Maker to draw them. 19. Double bubble map.
Aid in Organization and Planning: Graphic organizers offer an excellent way for students to structure their thoughts and ideas as they plan out essays, projects, or presentations. 5. Facilitate Differentiated Instruction: Since students learn at different paces and with varied styles, graphic organizers serve as a versatile learning tool that ...
The OREO Graphic Organizer lays out the basic structure for an opinion essay. OREO stands for Opinion, Reason, Example, and Opinion restated. Informative Writing. The BLT Graphic Organizer helps a student to plan a single, informative paragraph. The paragraph must include an introduction, a thesis statement, supporting sentences, and a conclusion.
In this lesson, you will use the prewriting strategies of note-taking, graphic organizers, outlines, and lists to help you evaluate and organize your ideas for either an expository essay or a short story. There are two main reasons to use prewriting strategies. First, they make a paper easier to write because prewriting strategies allow you to ...
To see how the Narrative Essay structure works, check out the essay below, which was written for the Common App "Topic of your choice" prompt. You might try reading it here first before reading the paragraph-by-paragraph breakdown below. They covered the precious mahogany coffin with a brown amalgam of rocks, decomposed organisms, and weeds.
WRITING ORGANIZER - Expository Essay Body Paragraphs: Each of the body paragraphs deals with one idea, or piece of information. Conclusion: Summarize key information & restate main ideas. • Usually consists of a general statement on the subject. • Provides an overview of the essay. • Topics may be grouped under common headings.
During Work Times B and C, have students use the Informative Writing Plan graphic organizer to analyze the Model Literary Analysis Essay: Relationship of Structure to Meaning. By working backwards to connect the elements of the model essay to this planner, students will better understand each element of the essay before they begin planning ...
Description. Use this handy FREE resource to review the structure of an essay with students prior to teaching them how to write one. It simultaneously gives students an overview of the writing steps to "build" the essay while also serving as a quick reference sheet so students can self-monitor as they write their essay.
Students can use a graphic organizer for writing an essay, creating a story map, or studying a scientific concept. Teachers can also create a graphic organizer to discuss the main topic or guide students through a lab procedure. In the workplace, graphic organizers help teams identify the beginning, middle, and end of a sequence or brainstorm ...
1,139 templates. Create a blank Graphic Organizer. Concept Map Graphic Organizer. Graphic Organizer by Innovation Station. Orange Pastel Feminine Essay Writing Graphic Organizer. Graphic Organizer by meliorastudio. Pastel Minimalist KWL Chart. Graphic Organizer by Cardio Studio.
By understanding and utilizing this basic essay structure, you can ensure that your writing is clear, organized, and effective. Choose the Right Organizer. When it comes to effective essay writing, choosing the right graphic organizer can make a significant difference in organizing your thoughts and boosting your writing skills.