- Undergraduate
- High School
- Architecture
- American History
- Asian History
- Antique Literature
- American Literature
- Asian Literature
- Classic English Literature
- World Literature
- Creative Writing
- Linguistics
- Criminal Justice
- Legal Issues
- Anthropology
- Archaeology
- Political Science
- World Affairs
- African-American Studies
- East European Studies
- Latin-American Studies
- Native-American Studies
- West European Studies
- Family and Consumer Science
- Social Issues
- Women and Gender Studies
- Social Work
- Natural Sciences
- Pharmacology
- Earth science
- Agriculture
- Agricultural Studies
- Computer Science
- IT Management
- Mathematics
- Investments
- Engineering and Technology
- Engineering
- Aeronautics
- Medicine and Health
- Alternative Medicine
- Communications and Media
- Advertising
- Communication Strategies
- Public Relations
- Educational Theories
- Teacher's Career
- Chicago/Turabian
- Company Analysis
- Education Theories
- Shakespeare
- Canadian Studies
- Food Safety
- Relation of Global Warming and Extreme Weather Condition
- Movie Review
- Admission Essay
- Annotated Bibliography
- Application Essay
- Article Critique
- Article Review
- Article Writing
- Book Review
- Business Plan
- Business Proposal
- Capstone Project
- Cover Letter
- Creative Essay
- Dissertation
- Dissertation - Abstract
- Dissertation - Conclusion
- Dissertation - Discussion
- Dissertation - Hypothesis
- Dissertation - Introduction
- Dissertation - Literature
- Dissertation - Methodology
- Dissertation - Results
- GCSE Coursework
- Grant Proposal
- Marketing Plan
- Multiple Choice Quiz
- Personal Statement
- Power Point Presentation
- Power Point Presentation With Speaker Notes
- Questionnaire
- Reaction Paper
Research Paper
- Research Proposal
- SWOT analysis
- Thesis Paper
- Online Quiz
- Literature Review
- Movie Analysis
- Statistics problem
- Math Problem
- All papers examples
- How It Works
- Money Back Policy
- Terms of Use
- Privacy Policy
- We Are Hiring

Income Inequality in America, Essay Example
Pages: 5
Words: 1442
Hire a Writer for Custom Essay
Use 10% Off Discount: "custom10" in 1 Click 👇
You are free to use it as an inspiration or a source for your own work.
Income Inequality in America. Is it a problem and how can it be fixed?
The fact that income inequality is a problem in the United States is undeniable. Claims of the widened income gap between rich Americans and poor Americans, in addition to the diminishing middle class, is a cause for concern (Yates 1). The income inequality is one of the worse political and economic problems the United States faces (Piketty and Saez 1-3). It causes significant problems to social and political stability. It is also an indicator of national decline. Indeed, it is based on this premise that, this essay examines whether income inequality in America is a problem, as well as how it can be fixed.
Income inequality leads to political change. As Saez and Zucman (1-6) explain, loss of income by the middle class compared to the top-earners leads to political change. During the 2000s, many businesses emerged seeking political offices, as they catered for nearly 30 times more employees than the trade unions. Between the year 2000 and 2010, business interest groups spent $492 million on labor, and nearly $28.6 billion on sponsoring activism. This led to the rise of political setting the business groups dominated (Smith 3-5).
Income inequality has adverse effects on democracy. Some scholars have considered that income inequality is not compatible with real democracy (Milanovic 1). This is since creating a disparity between wealthy and poor is historically the main cause of most revolution. Indeed, it is commented that the political system in the United States faces serious threats of drifting towards a kind of oligarchy by influencing the affluent, corporations, and special interest groups. Even though, income inequality may not have impact on economic growth, the action by the government may reduce the current levels. This raises tax rates on the wealthy. It may also cause political dispute or friction – between the poor and the rich.
Income inequality contributes to national poverty. Greater income inequality is likely to encourage greater rates of poverty, as under such situations, income shifts from those in the lower income bracket to those in the upper-income bracket. Saez and Zucman (1-6) argue that when wealth remains in upper income bracket, it may lead to political revolutions and policy reforms to offset the impacts that induce poverty. This has been the trend over the decade (Economist 1). The gap in earnings has also increased over the past five years. Current statistics from the U.S. Census shows that in 2010, the wealthiest 20 percent of entire households was allocated 50.2 percent of the sum household-income, compared to the poorest 20 percent, which received 3.3 percent. In the 1980s, the income shares of the richest households received 44.1 percent. The poorest got 4.2 percent. This shows rising inequality and poverty. Further statistics indicates that individuals in the least-affluent households lost nearly 21.4 percent of their income share. On the other hand, the most-affluent households witnessed an income rise of nearly 13.8 percent. Conversely, the remaining two poorest quintiles lost income (Economist 1).
Income inequality leads to political polarization. As Political Research Quarterly establishes, income inequality is connected to the current political polarization in the United States. In its 2013 study, Political Research Quarterly established that officials who were elected tended respond to the whims of the officials within the upper-income bracket, as a result ignoring the needs of people within the lower income group. The analysis provided by Martin and Harris (1) show that, income inequality is connected to the extent to which the House of Representatives polarization has always voted.
Income inequality also leads to social stratification. Martin and Harris (1) show that class divisions have mainly resulted due to income inequality. This has led to class warfare where the rich rally around the rich and the poor rally around the poor to gain political emancipation. Hence, the rich tend to create an own virtual country, which in their perception should be a self-contained world that is complete with first-rate social services, separate economy, and infrastructure. Indeed, the gap between poor and the rich is widening more in the United States than most advanced country. A growing consensus, for that reason, is that Americans have placed emphasis on pursuing economic growth instead of income redistribution. This argument is supported by current economists, such as Corak (2013) in his analysis of theorist Alan Krueger’s “Great Gatsby Curve.” In his review, Corak (2013) indicates that nations with greater income inequalities also tend to have a greater proportion of economic advantages and disadvantages. The trend is passed on from parents to their offspring.
On the other hand, some political theorists have argued that income inequality is not a problem, and that the problems have been overstated.
Indeed, Saez and Zucman (1-6) perceive that despite the existence of income inequality, economic growth and equality in terms of getting opportunities should be what matters. Some commentators have also expressed that despite being an American problem, it is also a global problem. As a result, it should not trigger significant policy reforms. Others have also expressed that income inequality has some underlying advantages, leading to a well-functioning and competition-driven economy. Additionally, significant policy reforms to cut out income inequality may lead to policies that lessen the welfare of the more affluent individuals.
A section of researchers also argues that there is no basis in the argument that income inequality slows economic and socio-political growth. Responding to claims that income inequality slows economic and socio-political growth, Petryni (1) argues that inequality is healthy within a free market economy, as it promotes greater competition for economic and political opportunities.
At the same time, wealth inequalities tend to compensate for themselves where an extensive increase in wealth occurs. This also implies that since the income inequalities do not pose significant political or economic problems, forced wealth transfers through taxation may obliterate the income pools needed to create new ventures, leading to further political discord between the poor and the wealthy in the society. Indeed, some recent studies have established a link between high marginal tax rates on high-income earners and greater growth in employment (Petryni 1).
Some political and social theorists also perceived income inequality as valuable and natural characteristic of US economy. The American Enterprise Institute sees the growth of income inequality gap as linked to the growth of opportunities—including the motivation and desire to seek political and social emancipation.
Smith (1) further contends that inequality emanates from the growth of economic prosperity and leads to an improved standard of living of the entire US population. Such incomes, Milanovic (1) argues, are a way of rewarding certain actors in the economy for their maximal investment efforts in the future. Towards this end, therefore, suppressing inequality discourages output and pursuit of political emancipation.
Conclusion and recommendations
Largely, income inequality is a problem in the United States. Income inequality contributes to national poverty. It also has adverse effects on democracy. Further, it leads to political change. Income inequality also leads to political polarization and stratification.
Hence, there is a need for more advanced tax and transfer policies that can align the United States with the other developed nations. This requires tax reforms, such as enacting tax incidence adjustments, subsidizing healthcare and increasing the social security, heavy investment in infrastructure, fortifying labor influence and providing higher education at low costs.
Making education available to more Americans through policies that subsidize cost of education will mean that more Americans have an opportunity for better income. This is since individuals with high education qualification report lower unemployment rate. However, equal job opportunities are also crucial. Public expenditure on welfare should be increased to ensure social and economic security, where the government provides subsidized healthcare. The more affluent members of the society should also be taxed higher than, the poor Americans.
Works Cited
Corak, Miles. “Income Inequality, Equality of Opportunity, and Intergenerational Mobility.” Journal of Economic Perspectives 27.3(2013): 79–102
Economist, The. “The rich, the poor and the growing gap between them,” 2006. 11 April 2015, <http://www.economist.com/node/7055911>
Kenworthy, Lane. “Does More Equality Mean Less Economic Growth?” 2007, <http://lanekenworthy.net/2007/12/03/does-more-equality-mean-less-economic-growth/>
Martin, Jonathan and Harris, John. “President Obama, Republicans fight the class war.” Politico, 2012. <http://www.politico.com/story/2013/04/barack-obama-class-warrior-90052.html>
Milanovic, Branko. “More or Less.” International Monetary Fund, 2011.
Petryni, Matt. “Advantages & Disadvantages to Income Inequality.” n.d. 11 April 2015, <http://www.ehow.com/info_11415987_advantages-disadvantages-income-inequality.html>
Piketty, Thomas and Saez, Emmanuel. “Income Inequality In The United States, 1913–1998.” The Quarterly Journal Of Economics 28.1 (2003): 1-39
Saez, Emmanuel and Zucman, Gabriel. “Wealth and Inequality in the United States Since 1913: Evidence from Capitalised Income Tax Data.” National Bureau of Economic Research: Cambridge: 2013
Smith, Hedrick. “Who Stole the American Dream.” Random House: New York, 2012. < http://newshare.com/ruleschange/book-notes.pdf>
Todd, Michael. “The Benefits of Wealth Inequality (and Why We Should Not Fear It).” Pacific Standard , 2013. <http://www.psmag.com/business-economics/benefits-wealth-inequality-now-fear-67567>
Yates, Michael. “The Great Inequality.” Monthly Review 63.10 (2012)
Stuck with your Essay?
Get in touch with one of our experts for instant help!
American Airlines Demographic Information, Research Paper Example
Comparing and Contrasting Poems, Poem Example
Time is precious
don’t waste it!
Plagiarism-free guarantee
Privacy guarantee
Secure checkout
Money back guarantee

Related Essay Samples & Examples
Voting as a civic responsibility, essay example.
Pages: 1
Words: 287
Utilitarianism and Its Applications, Essay Example
Words: 356
The Age-Related Changes of the Older Person, Essay Example
Pages: 2
Words: 448
The Problems ESOL Teachers Face, Essay Example
Pages: 8
Words: 2293
Should English Be the Primary Language? Essay Example
Pages: 4
Words: 999
The Term “Social Construction of Reality”, Essay Example
Words: 371
Income Inequality Issue in the United States Essay
Introduction, works cited.
It has been boldly predicted that the rise of income inequality in the United States of America will become one of the most complicated issues to resolve over the next ten to twenty years. According to the article by Sean McElwee, “the income share accruing to the top one percent increased from 9 percent in 1976 to 20 percent in 2011” (par. 2).
While in 1979 the top richest 0.1 of US citizens controlled seven percent of the wealth in the country; in 2012 the same percentage of wealthy citizens controlled 22 percent of the wealth. These figures speak for themselves when it comes to answering the question of whether income inequality is increasing in the United States. Wealth and income inequality are directly connected, which means that as the highest incomes are preserved in their positions, pushing up the concentration of wealth without accounting for the lowest income, the gap between the two extremes increases.
While many may argue that the increase in inequality was caused by the skill-biased change in the global economy as well as the ‘winner takes all’ mentality, this opinion is far from being true. The real answer was associated with the public policies that encouraged the rise of finance, the decline of unions, and most importantly, favored the richest layers of the population (Gross). This means that the decline in income inequality can be achieved through imposing taxes on wealth and high income.
Despite the fact that the conservatives claimed that imposing taxes on wealth would negatively affect the country’s economic growth, the research conducted by Piketty, Saez, and Stantcheva contradicted this opinion by stating that there was no connection between tax cuts and the economic growth. This means that the highest tax rates can be increased up to eighty percent of income, although the wealthy will never allow for this to occur.
When discussing wages in the US (taking into account inflation), it is important to mention that they have remained stagnant since the 1980s. Workers that are paid the lowest wage in the country did not experience any significant growth in their income, as shown in the diagram below (Figure 1):

While the annual minimum wage remained the same, the worker’s productivity was consistently increasing since the 1590s. Therefore, there has been no balance between the performance of the workers and the compensation for their work. This answers the question of whether income inequality is an issue. Income, as well as wealth inequality, will continue to grow if the public and economic policies remain the same as they have been previously.
While the solutions to the problem are varied, the key advice given by many specialists is reducing the turnout gap that exists between the richest and the poorest layers of the population. Studies have presented evidence for states with increased low-income turnout having higher minimum wages as well as good welfare benefits (McElwee), which are indicative of a high standard of living in the region. Therefore, the battle against inequality will be a long and tedious process that requires drastic measures from the government, which, in turn, should not aim to please those already at the top but try to bring those at the bottom to the appropriate level income and high standards of living.
Gross, Neil. The Decline of Unions and the Rise of Trump . 2016. Web.
McElwee, Sean. Why Income Inequality is America’s Biggest (and Most Difficult) Problem . 2014. Web.
Piketty, Thomas, Emmanuel Saez, and Stephanie Stantcheva. Taxing the 1%: Why the Top Tax Rate Could Be Over 80% . 2011. Web.
“U.S. Annual Wages, 1979-2014” 2015. Web.
- Chicago (A-D)
- Chicago (N-B)
IvyPanda. (2020, October 15). Income Inequality Issue in the United States. https://ivypanda.com/essays/income-inequality-issue-in-the-united-states/
"Income Inequality Issue in the United States." IvyPanda , 15 Oct. 2020, ivypanda.com/essays/income-inequality-issue-in-the-united-states/.
IvyPanda . (2020) 'Income Inequality Issue in the United States'. 15 October.
IvyPanda . 2020. "Income Inequality Issue in the United States." October 15, 2020. https://ivypanda.com/essays/income-inequality-issue-in-the-united-states/.
1. IvyPanda . "Income Inequality Issue in the United States." October 15, 2020. https://ivypanda.com/essays/income-inequality-issue-in-the-united-states/.
Bibliography
IvyPanda . "Income Inequality Issue in the United States." October 15, 2020. https://ivypanda.com/essays/income-inequality-issue-in-the-united-states/.
- Voter Turnout Problem in America
- Voter Turnout: An Analysis of Three Election Years
- Social Media Impact on Voter Turnout
- "Survival of the Richest": Survivalism Concept
- Political Issues: Voter Turnout in Texas
- Irish General Elections: Low Voter Turnout Reasons
- Voter Turnout and Mobilization
- Food Insecurity in the US: Feeding the Richest Country
- Jeff Bezos: The Richest Man in Modern History
- Food Riots in Haiti: From Richest Colony to Food Crisis
- The Central African Republic Economy
- International Money Laundering
- Fraud in Nonprofit Organizations
- The Global Financial Crisis and Its Effect
- Cuban Economy: Country Risk Analysis
This website uses cookies.
By clicking the "Accept" button or continuing to browse our site, you agree to first-party and session-only cookies being stored on your device to enhance site navigation and analyze site performance and traffic. For more information on our use of cookies, please see our Privacy Policy .
- Journal of Economic Perspectives
Growing Income Inequality in the United States and Other Advanced Economies
- Florian Hoffmann
- David S. Lee
- Thomas Lemieux
- Article Information
- Comments ( 1 )
Additional Materials
- Replication Package
- Online Appendix (745.42 KB)
- Author Disclosure Statement(s) (267.68 KB)
JEL Classification
- E25 Aggregate Factor Income Distribution
The Causes of Income Inequality
- Posted by Jeff Christie
- Posted on 12/4/2020 1:05:11 PM
Read our research on: Abortion | Podcasts | Election 2024
Regions & Countries
Key findings on the rise in income inequality within america’s racial and ethnic groups.
Income inequality – the gap in incomes between the rich and poor – has increased steadily in the United States since the 1970s. By one measure, the gap between Americans at the top and the bottom of the income ladder increased 27% from 1970 to 2016. However, the rise in inequality within America’s racial and ethnic communities varies strikingly from one group to another, according to a new Pew Research Center analysis of government data.
In this analysis, which draws on data from the American Community Survey and U.S. decennial censuses, income inequality is measured using the 90/10 ratio – the income of those at the high end (90th percentile) of the income distribution relative to the income of those at the low end (10th percentile). “Income” refers to the resources available to a person based on the income of their household, whether the person had personal earnings or not. Thus, people’s incomes are represented by their household’s income adjusted for household size. (See the report methodology for details.)
Here are five key findings from the report:

2 Income inequality among Asians in the U.S. nearly doubled from 1970 to 2016. The top-to-bottom income ratio among Asians increased 77% from 1970 to 2016, a far greater increase than among whites (24%), Hispanics (15%) or blacks (7%). As a result, Asians displaced blacks as the most economically divided racial or ethnic group in the U.S. In 1970, income inequality among Asians was roughly on par with whites and Hispanics and significantly less pronounced than it was among blacks. The Asian experience with inequality reflects the fact that the incomes of Asians near the top increased about nine times faster than the incomes of Asians near the bottom from 1970 to 2016, 96% compared with 11%. These were the greatest and the smallest increases in incomes at the two rungs of the ladder among the racial and ethnic groups analyzed.

4 Income gaps across racial and ethnic groups persist and, in some cases, are wider than in 1970. Large gaps between the incomes of blacks and whites have narrowed only modestly in recent decades. In 2016, blacks at the 90th percentile of their distribution earned 68% as much as whites at their 90th percentile, the same as in 1970. At the median, blacks earned 65% as much as whites in 2016, up from 59% in 1970. Similarly, lower-income blacks narrowed the gap slightly from 47% in 1970 to 54% in 2016.
While the income gap between blacks and whites closed somewhat from 1970 to 2016, Hispanics fell even further behind at all income levels. For example, at the high end of the income distribution, Hispanics earned 65% as much as whites in 2016 compared with 74% in 1970. Higher-income Asians moved further out in front of higher-income whites, but lower-income Asians did not keep pace. Asians at the 10th percentile earned 8% more than whites in 1970, but in 2016 they earned 17% less.
5 The Asian and Hispanic experiences with inequality are partly driven by immigration patterns. Immigrants accounted for 81% of the growth in the Asian adult population in our sample from 1970 to 2016. This surge followed the Immigration and Nationality Act in 1965, drawing migrants from many countries for family reunification or as refugees , and later through skill-based programs such as the H-1B visa program . The result is a wide variation in education levels and incomes among Asians in the U.S. In 2015, the share with at least a bachelor’s degree among adults ages 25 and older ranged from 9% among Bhutanese to 72% among Indians, median household income varied from $36,000 among Burmese to $100,000 among Indians, and poverty rates were as high as 35% among Burmese and 33% among Bhutanese (incomes not adjusted for household size).
Hispanic immigrants, many of whom were unauthorized, accounted for 50% of the growth in the Hispanic adult population in our sample from 1970 to 2016. The Hispanic immigrant population tilts to the lower end of the education and income distributions. In 2015, 47% of foreign-born Hispanics ages 25 and older had not graduated from high school , compared with 13% of Americans overall. And only 11% of Hispanic immigrants had attained at least a bachelor’s degree, compared with 31% of Americans overall. The influx of lower-skill, lower-income immigrants likely exerted a drag on the measured growth in income for Hispanics.
Overall, the contrasting experiences of America’s racial and ethnic groups with income inequality – as well as the persistence of gaps in income across them – could reflect differences in the characteristics of workers, such as educational attainment (greater among Asians and whites) and the share foreign born (greater among Asians and Hispanics). In addition, the historical legacy and current impact of discrimination are considered to be an important source of gaps in income across groups.

Sign up for our weekly newsletter
Fresh data delivered Saturday mornings
Trust in America: How do Americans view economic inequality?
Americans’ views about billionaires have grown somewhat more negative since 2020, first-generation college graduates lag behind their peers on key economic outcomes, racial and ethnic gaps in the u.s. persist on key demographic indicators, in the pandemic, the share of unpartnered moms at work fell more sharply than among other parents, most popular.
About Pew Research Center Pew Research Center is a nonpartisan fact tank that informs the public about the issues, attitudes and trends shaping the world. It conducts public opinion polling, demographic research, media content analysis and other empirical social science research. Pew Research Center does not take policy positions. It is a subsidiary of The Pew Charitable Trusts .
- Latest Stories
- Watch Video
- Career Timeline
- BILLMOYERS.COM is taking a break. Explore the archive.
BILL MOYERS : Welcome. Inequality matters. You will hear people say it doesn’t, but they are usually so high up the ladder they can’t even see those at the bottom. The distance between the first and the least in America is vast and growing.
The Washington Post recently took a look at two counties in Florida and found that people who live in the more affluent St. Johns County live longer than those who live next door in less rich Putnam County. The Post concluded: “The widening gap in life expectancy between these two adjacent Florida counties reflects perhaps the starkest outcome of the nation’s growing economic inequality: Even as the nation’s life expectancy has marched steadily upward…a growing body of research shows that those gains are going mostly to those at the upper end of the income ladder.”
That’s true across America. In California’s Silicon Valley, Apple, Facebook and Google, among others, have reinvented the Gold Rush. But down the road in San Jose it’s not so pretty a picture. Do the math: in an area where one fourth of the population earn an average of about $19,000 dollars a year, rent alone can average more than $20,000 dollars a year, and that difference adds up to homelessness. We talked to Associated Press reporter Martha Mendoza, who brought this story to our attention.
MARTHA MENDOZA : I’ve been a journalist in this area for 25 years, and during that time it has gone from having a pretty robust middleclass to being an area where you see this great divide of wealthy and poor, and nowhere do you see that more than in the Silicon Valley, where 25 years ago this was a place of orchards and farms and ranching and small businesses, and it has completely changed now so that you have incredibly wealthy people and incredibly poor people and a growing gap. Homelessness has increased dramatically. In the shadow of Google, in the shadow of Oracle, in the shadow of Apple Computer, you have people who are hungry.
CINDY CHAVEZ : People had this believe that somehow Silicon Valley was paved with gold—and I would even say my parents, coming from New Mexico, all those years ago when I was very small, I mean they came here looking for opportunity. They wanted to be in a place that it didn’t matter what their ethnicity or culture was, it didn’t matter what their class was, that they really could put their stake in the ground, buy a home and grow a family. I think that’s a dream that a lot of people come to Silicon Valley with, and one of the problems is that it’s not like that for everybody. We have really been a tale of two cities for really a long time.
RUSSELL HANCOCK : Our economic expansion is pretty staggering, people have referred to it as the longest, most sustained, largest, legal wealth creation in the history of the planet. We have very high-income, highest in the nation. We also have very low. We’ve got both. And what’s actually happening right now is a hollowing out in the middle. Now, this is a national phenomenon, but it seems to be particularly acute in Silicon Valley. We’re still generating on the high end—engineers and scientists and coders. But the support positions, manufacturing, you’re not going to see that in Silicon Valley anymore.
MARTHA MENDOZA : They would manufacture silicon chips here in the early days. And I was just the other day looking for anybody making wafers anymore, and there’s not.
THERESA FRIGGE : I used to work with National Semiconductor. I worked in masking. I made that silicon chip. I’m the one who put the programs on that chip, I’m the one who inspected them. I’ve cleaned houses, I have taken care of disabled people. I’m 54 years old, I’ve got nothing.
MARTHA MENDOZA : What happened was, in the Silicon Valley 15 years ago, during the first boom, for every five jobs they were adding, they were building two units of housing. So that jacked up the housing prices to what fights for the most expensive housing in the country. Sometimes it’s first place. Sometimes it’s second place. People who had blue-collar jobs were getting paid 10, 15, 20 bucks an hour, and when their jobs went away they were largely unskilled and could take jobs that paid $8 an hour. That would be the minimum wage in San Jose for the past 15 years. As of last week, they raised it to $10 an hour. Now, on that type of wages, you can’t rent an apartment, you can’t buy food, and you can’t handle the transportation expenses, which can be very high. And so you end up—in some cases you find people living three or four families to an apartment, or people move into homeless shelters or people leave the area.
DANIEL GARCIA : This is my tent. This is where I live. I’ve got my transportation, my bike. I have electricity that I run by car battery. I worked at a restaurant at Google. They have, I don’t know, I guess sixteen or eighteen full-blown restaurants you can go eat at when you work there, for free. I never heard of that in my life. They started doing background checks and they did a background check on me. I’m a convicted felon, so they couldn’t keep me there anymore. Right now, I do yard work for people, stuff like that. I find bikes I fix them up and resell them.
MARTHA MENDOZA : In many communities you see the homeless people, you see them living in the streets, you see them begging downtown, or busking. In the Silicon Valley, this is a lot of freeway living and the homeless people they live along the creeks, or in parks, but where people aren’t going to see them, so it’s more of a hidden problem.
CINDY CHAVEZ : We had a family visit us, mother, father and three children, and they are homeless, and they’re homeless because the father is a gardener, he works three days a week, he makes $75 dollars every day he works. The mother lost her job in manufacturing. It took one paycheck to move them from their apartment onto the street. And that’s true for a lot of families in our community. At some point and I do worry about this, like I think is it all sudden that the country splits in half are we creating literally two Americas?
MARTHA MENDOZA : Silicon Valley has the brainpower and has the risky personality to do some really innovative things when it comes to poverty. And I even think there’s a will to do this, but I think there is a lack of awareness, and hopefully a growing awareness because I do think there’s been brilliance out of that region that has changed the world. So wouldn’t it be something if that area could also be the one that sparks the brilliance that starts to solve this really major problem?
BILL MOYERS : Let’s hope so, because inequality in America is now at the greatest level in modern history and shows no signs of abating. And paradoxically, this week it got worse. The stock market reached new levels, making the rich richer and the press euphoric.
NEWS ANCHOR 1 : And the gavel goes down on an historic day on Wall Street.
NEWS ANCHOR 2 : Roaring stock markets.
NEWS ANCHOR 3 : The S&P just hit another record intraday high.
NEWS ANCHOR 4 : Dow’s above 14.8.
NEWS ANCHOR 5 : The NASDAQ rose about 60 points.
BILL MOYERS : No one stopped to point out that when the market goes up, it can mean companies have fired workers in order to increase investor profits. Sure enough, the latest figures show employment has barely risen and more rank-and-file Americans have gone missing from the job market altogether. The Commerce Department reports that personal income fell 3.6 percent in January – that’s the sharpest one-month dive in twenty years. It sure seems like the Roaring 20s all over again -- people at the top living it up while those down below lose their livelihood.
Which brings us to our nation’s capital -- rich in alabaster symbols of representative government yet shamelessly cynical in writing laws and bending rules to favor the one percent. And that includes the tax code.
So on Monday, when you send in your tax returns, think about this. Corporate profits are at record highs. But have those companies invested that in new jobs? No. Did they at least give their workers a bump in pay? Hardly. Surely they shelled out a little more in taxes to help refurbish the social structure – highways, bridges, schools, libraries, parks – where they do business! Guess again. Corporations are sitting on $1.7 trillion of cash. Look at this report just published by PIRG -- the Public Interest Research Group -- on how average citizens and small businesses have to make up the $90 billion giant companies save by shifting profits to offshore tax havens. Among the 83 publicly traded corporations named: Pfizer, which for the past five years reported no taxable income in the US, even as it made 40 percent of its sales here.
Microsoft, which avoided $4.5 billion in taxes over three years by shifting its income to Puerto Rico. Citigroup, which maintains 20 subsidiaries in tax havens and has over 42 and a half billion dollars sitting off-shore. Taxes collected here at home? Zero.
It’s not only corporations stashing their swag abroad. The Center for Public Integrity in Washington and its International Consortium of Investigative Journalists recently got their hands on two and a half million files from offshore bank accounts and shell companies set up around the world by the wealthy. Among those documents are the names of 4,000 Americans who hid their money in secret tax havens. Here’s how they do it:
FEMALE VOICE : You can easily set up a secret company using one of hundreds of off-shore agents. Let’s look at the British Virgin Islands, home to half a million offshore companies. That’s about 40 percent of the offshore companies on the planet. You can buy a ready-made shell company or create your own secret company from scratch in about three days, for just over $1,000. You may be asked to produce documents to establish your identity and they might check your name in a database, to see if you’re a terrorist. But don’t worry, while the system may catch the big fish, it still lets scores of fraudsters and criminals slip through the net.
BILL MOYERS : So it shouldn’t surprise us to learn that the United States collects less in taxes as a share of its economy than all but two other industrialized countries. Only Chile and Mexico collect less. Chile and Mexico. Right now a powerful group of CEO's, multi-millionaires and billionaires are calling on Congress to fix the debt. And their enablers in both parties are glad to oblige. Okay. But why not fix the debt by raising more taxes from those who can afford to pay? Close the loopholes. Shut down the tax havens. Cancel the Mitt Romney Clause Congress enacted, allowing big winners to pay a tax rate far less than their chauffeurs, nannies, and gardeners.
Instead, as we speak, our political class in Washington is attempting to fix the debt by sequestration – Washington doublespeak for bleeding services for veterans and the elderly, the sick and poor, for kids in Head Start.
Marching in lockstep beneath a banner that now stands for “Guardians of Privilege” -- GOP -- Republicans refuse to raise revenues, while Democrats have a president whose new budget contains gimmicks that could lead to cuts in Social Security. Social Security! The one universal safety net -- and a modest one at that – and yet the main source of purchasing power for millions of aging Americans. This, from a Democrat – the heir of Franklin Delano Roosevelt who pulled us to our feet when the Great Depression had America on its knees.
FRANKLIN DELANO ROOSEVELT : This Social Security measure gives at least some protection to thirty millions of our citizens who will reap direct benefits through unemployment compensation, through old-age pensions and through increased services for the protection of children and the prevention of ill health.
BILL MOYERS : But those were the days when our political system rallied to the defense of everyday Americans. Now a petty, narcissistic, pridefully ignorant politics has come to dominate and paralyze our government, while millions of people keep falling through the gaping hole that has turned us into the United States of Inequality.
Warren Buffett, the savviest capitalist of them all, may have written this era’s epitaph: “If there was a class war, my class won.”
- CLOSED CAPTIONING AVAILABLE

- Why the Rich Live Longer
- Dr. King’s “Two Americas” Truer Now than Ever
- Inequality in Silicon Valley, in Five Charts
Full Episode
- Encore: Living Outside Tribal Lines
Bill Moyers Essay: The United States of Inequality
- Sherman Alexie on Living Outside Cultural Borders
Related Features
- The Disease of American Democracy
- Encore: How Tax Reform Can Save the Middle Class
- Capitalism’s Deeper Problem
- How Tax Reform Can Save the Middle Class
- Et Tu , JetBlue? The Airlines’ War on the 99%
- An Interview With Bill Moyers
- Wealthiest Americans Take Home Biggest Share of Income Ever Recorded
- Bill Moyers Essay: The End Game for Democracy
- How Inequality Was Created
- A Tax Day Plan for Righting the Republic
- The Rich Are Different from You and Me — They Pay Lower Taxes
- Why Republicans Should Take on Inequality
- Income Inequality Goes Viral
From the Web
- US PIRG Report: The Hidden Cost of Offshore Tax Havens
- US PIRG Report: Pick Up the Tab 2013
- Secrecy for Sale: Inside the Global Offshore Money Maze
The unprecedented level of economic inequality in America is undeniable. In an extended essay, Bill shares examples of the striking extremes of wealth and poverty across the country, including a video report on California’s Silicon Valley. There, Facebook, Google, and Apple are minting millionaires, while the area’s homeless — who’ve grown 20 percent in the last two years — are living in tent cities at their virtual doorsteps.
“A petty, narcissistic, pridefully ignorant politics has come to dominate and paralyze our government,” says Bill, “while millions of people keep falling through the gaping hole that has turned us into the United States of Inequality.”
Producer : Julia Conley. Editor : Sikay Tang. “Homeless in High Tech’s Shadow” Producer/Editor : Lauren Feeney. Field Producer/Camera : Cameron Hickey.
Subscribe to Our Newsletters

Page One Economics ®
Education, income, and wealth.

"By some estimates, income and wealth are near their highest levels in the past hundred years, much higher than the average during that time span and probably higher than for much of American history before then." —Janet Yellen, Federal Reserve Chair 1
Americans have among the highest living standards in the world and have enjoyed rising living standards for decades. Median household income in the United States in 2015 was $56,516, up from $49,276 in 2010. 2 However, gains in household income have not been evenly distributed across all income groups. Income inequality has been increasing in the United States since the 1970s, peaking in 2013 3 (Figure 1). A 2015 Gallup poll found that 63 percent of Americans feel that the distribution of U.S. money and wealth is unfair. 4 While many factors contribute to income and wealth inequality, the role of education is a key piece of the puzzle.
Figure 1: U.S. Income Inequality a Rising Trend
NOTE: The Gini coefficient (also known as the Gini ratio or index) is a common measure of income inequality within a nation. It gauges income inequality on a scale from 0 to 1: The higher the number, the higher the level of inequality. The lowest U.S. value was 0.386 in 1968, and the highest value was 0.482 in 2013. In 2015 the, Gini coefficient was 0.479. SOURCE: FRED ® , Federal Reserve Bank of St. Louis. Accessed November 22, 2016; https://fred.stlouisfed.org/graph/?g=7yKu .
When people earn income, they use that income to do three things: pay taxes, buy goods and services (consume), and save. Saving is not spending on current consumption or taxes and involves giving up some current consumption for future consumption. The accumulation of money set aside for future spending and consumption is known as savings. Americans don't save as much as those in other industrialized nations. The U.S. personal saving rate has dropped substantially over the past 50 years (Figure 2). As of September 2016, the U.S. personal saving rate was 5.7 percent, whereas it has historically averaged 8.4 percent (since 1959). 5 By comparison, German households saved 16.7 percent, on average, in 2015. 6
Figure 2: U.S. Personal Saving Rate Over 50 Years
NOTE: The horizontal line indicates the average saving rate over the period. SOURCE: FRED ® , Federal Reserve Bank of St. Louis. Accessed November 22, 2016; https://fred.stlouisfed.org/graph/?g=bQZk .
Saving is an essential component of building wealth. Wealth, also called net worth, is the total value of a person's assets , such as liquid assets (cash or something you can easily turn into cash), real estate, businesses, and cars, minus any liabilities (money owed; debt). Saving to build wealth is an important part of financial planning. And debt is not necessarily a bad thing. Because income tends to start low at younger ages, borrowing (taking on debt) allows people to have things now and pay for them over time. In economic terms, this is called smoothing consumption. Income then tends to increase in middle age and decrease when people retire. Economists often use the life cycle theory of consumption and saving to explain this phenomenon. As shown in the model (Figure 3), people tend to borrow to purchase homes, cars, or an education when they are young, pay down debt and save a portion of their income during their peak working and earning years, and finally spend their saved money during retirement. Within this pattern of planned borrowing and saving, the hump-shaped pattern of income (the curved line) allows for smooth consumption (the horizontal line) across the lifecycle. Thus, saving—to build wealth—is essential for a higher quality of life during retirement.
Figure 3: A Model of Saving and Spending: The Life Cycle Theory of Consumption and Saving

Two similar terms must be differentiated here: Income is the payment people receive for providing resources in the marketplace. For example, people often receive paychecks twice a month. You may have heard people discuss the flow of income. Saving involves setting some of the flow of income aside to increase wealth . Wealth is the accumulation—or stock—of saved money. Notice that turning the flow of income into a stock of wealth requires saving money. There are several options for saving, including saving in a savings accounts or saving through the purchase of financial assets , which is called financial investment . People invest in financial assets with the aim of "making money"—they hope to earn interest, dividends, profits, and/or capital gains in the future.
Education and Income
The relationship between education and income is strong. Education is often referred to as an investment in human capital . People invest in human capital for similar reasons people invest in financial assets, including to make money. In general, those with more education earn higher incomes (see the table). The higher income that results from a college degree is sometimes referred to as the "college wage premium." Research shows that this premium has grown over time. 7 In addition, in general, the more skills people have, the more employable they are. As a result, workers with more education have a lower average unemployment rate than those with less education (Figure 4).

Figure 4: Unemployment Declines as Education Increases
NOTE: In November 2016, the overall U.S. unemployment rate was 4.6 percent, but level of education matters. The unemployment rate for college graduates was 2.3 percent, while that for those with less than a high school diploma was 7.9 percent.
SOURCE: FRED ® , Federal Reserve Bank of St. Louis. Accessed December 21, 2016; https://fred.stlouisfed.org/graph/?g=8ds7 .
Education and Wealth
The relationship between education and wealth is also strong. Of course, earning a higher income makes saving easier, and saving is necessary to build wealth. Those with lower incomes have a flatter (non-humped) income pattern, which makes saving and paying down debt more difficult. But those with more education also tend to make financial decisions that contribute to building wealth. 8 It is important to realize, however, that anyone can follow the financial behaviors that well-educated families tend to practice, such as these:
- Have some liquid assets. Liquid assets can help relieve financial distress during a difficult time without having to sell assets or accumulate debt. Liquid assets include savings accounts, stocks, and bonds.
- Diversify. To diversify means to invest in various financial instruments to reduce risk. In addition to tangible assets such as houses and cars, those with higher levels of education also tend to hold a greater share of their savings in stocks, bonds, and businesses, which tend to provide higher returns (but also more risk of loss).
- Keep debt low relative to assets. Those with low debt relative to assets pay lower interest rates. Those with high debt relative to assets pay higher interest rates, which can make it difficult to save. And, over longer periods, both savings and debt are susceptible to the effects of compound interest —which means that savings (or debt) can grow at exponential rates over time. 9
It is important to realize, however, that the relationship among education, income, and wealth is more complicated than simply more education yielding a higher income and more wealth. Factors such as natural ability and family background also impact both income and wealth and are not caused by having more education (see the boxed insert).

The Role of Financial Literacy
Research shows that up to half of wealth inequality may be caused by differences in financial literacy. 10 That is, many people do not have the skills or ability to manage their money effectively. As a result, they are more likely to use costly home loan (mortgage) products, 11 pay higher transaction costs and fees, and use high-cost borrowing options. 12 High-cost borrowing includes the use of payday loans and businesses such as pawn shops and rent-to-own stores. 13 Currently only 20 states require high school students to take a course in economics and only 17 states require a course in personal finance. 14 Research has shown, however, that such education makes a difference: Students in states with financial education requirements have lower loan delinquency rates and higher credit scores relative to students in states without financial education requirements. 15
Income and wealth inequality have been on the rise in the United States for decades. Research indicates that the level of education is strongly related to both income and wealth. Households with higher levels of education tend to have more liquid assets to withstand financial storms, diversify their savings (investments), and maintain low levels of debt relative to assets. These financial behaviors are effective strategies for building income into wealth. Because much of wealth building can be tied to financial decisionmaking, it is likely that financial literacy can play a key role in reducing wealth inequality over time.
1 Yellen, Janet L. "Perspectives on Inequality and Opportunity from the Survey of Consumer Finances." Board of Governors of the Federal Reserve System, 2014; http://www.federalreserve.gov/newsevents/speech/ye... .
2 U.S. Bureau of the Census. Median Household Income in the United States [MEHOINUSA646N], retrieved from FRED, Federal Reserve Bank of St. Louis, November 22, 2016; https://fred.stlouisfed.org/graph/?g=580N .
3 Federal Reserve Bank of St. Louis. "How Has Income Changed over the Years?" On The Economy (blog); June 30, 2016; https://www.stlouisfed.org/on-the-economy/2016/june/how-has-income-inequality-changed-years .
4 Newport, Frank. "Americans Continue to Say U.S. Wealth Distribution Is Unfair." May 4, 2015; Gallup ; http://www.gallup.com/poll/182987/americans-continue-say-wealth-distribution-unfair.aspx .
5 U.S. Bureau of Economic Analysis, Personal Saving Rate [PSAVERT], retrieved from FRED ® , Federal Reserve Bank of St. Louis, November 22, 2016; https://fred.stlouisfed.org/graph/?g=580A .
6 Beisemann, Leonie. "A Dash of Data: Spotlight on German Households." OECD Insights , February 11, 2016; http://oecdinsights.org/2016/02/11/a-dash-of-data-spotlight-on-german-households/ .
7 Valletta, Rob. "Higher Education, Wages, and Polarization." Federal Reserve Bank of San Francisco Economic Letter . January 12, 2015; http://www.frbsf.org/economic-research/publications/economic-letter/2015/january/wages-education-college-labor-earnings-income/ .
8 Boshara, Ray; Emmons, William R. and Noeth, Bryan. "The Demographics of Wealth: How Age, Education and Race Separate Thrivers from Strugglers in Today's Economy." Essay No. 2: Education and Wealth, May 2015; https://www.stlouisfed.org/~/media/Files/PDFs/HFS/essays/HFS-Essay-2-2015-Education-and-Wealth.pdf .
9 Boshara, Ray; Emmons, William R. and Noeth, Bryan. "The Demographics of Wealth: How Age, Education and Race Separate Thrivers from Strugglers in Today's Economy." Essay No. 2: Education and Wealth, May 2015; https://www.stlouisfed.org/~/media/Files/PDFs/HFS/essays/HFS-Essay-2-2015-Education-and-Wealth.pdf .
10 Lusardi, Annamaria; Michaud, Pierre-Carl and Mitchell, Olivia S. "Optimal Financial Knowledge and Wealth Inequality." NBER Working Paper 18669, January 2013; http://www.nber.org/papers/w18669.pdf .
11 Moore, Danna. "Survey of Financial Literacy in Washington State: Knowledge, Behavior, Attitudes, and Experiences." Technical Report 03-39, Washington State University Social and Economic Sciences Research Center, December 2003.
12 Lusardi, Annamaria and Tufano, Peter. "Debt Literacy, Financial Experiences, and Overindebtedness." NBER Working Paper 14808, March 2009.
13 Lusardi, Annamaria and de Bassa Scheresberg, Carlo. "Financial Literacy and High-Cost Borrowing in the United States." NBER Working Paper 18969, April 2013.
14 Council for Economic Education. Survey of the United States: Economic and Personal Finance Education in Our Nation's Schools, 2016 ; http://councilforeconed.org/wp/wp-content/uploads/2016/02/sos-16-final.pdf .
15 Brown, Alexandra; Collins, J. Michael; Schmeiser, Maximilian and Urban, Carly. "State Mandates Financial Education and the Credit Behavior of Young Adults." Finance and Economic Discussion Series 2014-68, Federal Reserve Board, 2014; https://www.federalrese.gov/pubs/feds/2014/201468/201468pap.pdf .
© 2017, Federal Reserve Bank of St. Louis. The views expressed are those of the author(s) and do not necessarily reflect official positions of the Federal Reserve Bank of St. Louis or the Federal Reserve System.
Asset: A resource with economic value that an individual, corporation, or country owns with the expectation that it will provide future benefits.
Capital gains: A profit from the sale of financial investments.
Compound interest: Interest computed on the sum of the original principal and accrued interest.
Credit score: A number based on information in a credit report used to indicate a person's credit risk.
Delinquency rate: The number of loans that have delinquent payments relative to the total number of loans.
Financial asset: A contract that states the conditions under which one party (a person or institution) promises to pay another party cash at some point in the future.
Financial investment: Placing money in a savings account or in any number of financial assets, such as stocks, bonds, or mutual funds, with the intention of making a financial gain.
Financial literacy: Having knowledge of financial matters and applying that knowledge to one's life.
Human capital: The knowledge and skills that people obtain through education, experience, and training.
Income: The payment people receive for providing resources in the marketplace.
Payday loan: A small, short-term loan that is intended to cover a borrower's expenses until his or her next payday. May also be called a paycheck advance or a payday advance.
Transaction costs: The costs associated with buying or selling a good, service, or financial asset.
Cite this article
Subscribe to Our Newsletter
Stay current with brief essays, scholarly articles, data news, and other information about the economy from the Research Division of the St. Louis Fed.
SUBSCRIBE TO THE RESEARCH DIVISION NEWSLETTER
Research division.
- Legal and Privacy
One Federal Reserve Bank Plaza St. Louis, MO 63102
Information for Visitors
CUNY Academic Works
- < Previous
Home > CUNY Graduate Center > Dissertations, Theses, and Capstone Projects > 2038

Dissertations, Theses, and Capstone Projects
Three essays on inequality in the united states.
Gowun Park , The Graduate Center, City University of New York Follow
Date of Degree
Document type.
Dissertation
Degree Name
Wim Vijverberg
Committee Members
Timothy Goodspeed
Chu-Ping Vijverberg
Subject Categories
Economics | Income Distribution | Labor Economics
Income inequality, Wage inequality, Inequality of opportunity, Financial crisis, Decomposition
This dissertation is about inequality of income in the United States. The first essay examines how inequality in total personal income relates to the inequality in each income component, such as wage income, interest income, transfer income, and so forth. The second essay analyzes the percentile shares of wages to find the factors that contribute to U.S. wage inequality. Furthermore, wage inequality is decomposed into the parts that are explained and unexplained by these contributing factors. The third essay distinguishes the proportion of the overall inequality that is due to pre-determined conditions of an individual.
Chapter 1: The Source of Income Inequality in the United States
The measurement of income inequality has been a focus of considerable study. However, the determinants of income inequality are still unclear. This study explores which income sources are primarily responsible for the observed U.S. income inequality using a decomposition method. Moreover, by estimating the marginal effect of a specific source income, I analyze its impact on overall income inequality. By doing so, this study identifies which source income has been alleviating overall inequality the most – or has been increasing it the most – before and after the financial crisis.
Among eight different sources, wage income has the largest as share in total income, yet it is most equally distributed income source. However, the increase in the Gini of wage income after the financial crisis suggests that the intensifying unequal distribution of this source income contributed to rising inequality.
The role of government transfers is important in reducing inequality, especially after the financial crisis. The equalizing effects of a ten percent increase in these transfers is a 0.84 percent reduction in the Gini of total income after the financial crisis. Among different government transfers, Social Security is the greatest equalizer. Besides the government transfers, retirement income reduces total inequality.
Interest and self-employment income show unequalizing effects on total inequality. The importance of interest income rose during the financial crisis and increased again more recently. The shares of self-employment income decreased since the financial crisis, and thus its contribution to overall inequality became smaller.
Chapter 2: Unpacking Wage Inequality in the United States
Wage earnings are the single most important income source in the U.S. They account for over 70 percent of total personal income. Therefore, wage may be the key determinant of income inequality. Since the 1980s, slower economic growth, higher unemployment and reduced wage shares have been observed in the U.S. Along with these economic trends, the U.S. income inequality has been rising and many believe that these dispersions are due to the widening of the U.S. wage structure since 1980 (Karoly and Burtless 1995). Severe wage stagnation caused by the deep recession from the most recent financial crisis (2007-2009) makes an analysis of wage inequality a challenging task. This study attempts to untangle the trend of the U.S. wage inequality before and after the financial crisis and identify the source of the differences in wage distributions.
The Gini coefficient is the most popular inequality measure but is not sufficiently practical for our purposes. While it does provide a global level of inequality, it does not reveal the detailed process underlying the changes of this measures. Furthermore, this inequality measure has an inherent disadvantage: it varies whenever the distribution of wage income changes without regard to the location of the changes, such as whether they happen at the top or at the bottom of the distribution (Litchfield 1999). Therefore, this essay analyzes the percentile shares of wages, as in the well-known work of Piketty (2014). By means of this measure, this study investigates potential contributors to U.S. wage inequality during 2000-2014, including gender, race, ethnicity, age, concentration of the top earners, occupation, economic sector, location, difference in the level of educational attainment, and other conditions such as employment status and a worker’s English language proficiency. Utilizing two leading decomposition methods, I differentiate between components that can be explained by individuals’ core characteristics and components that cannot be explained by these potential contributors and thus, account for wage structural differences within our society. In addition, by further dividing the decomposition results, this study examines which factors are most likely to contribute to the difference in the wage distribution.
During 2000-2014, while wage income is more unevenly distributed among men, there exist the glass ceiling for women in the form of a significant wage gap at the top decile. Among five racial groups, within-group wage inequality among Asians is highest, while it is lowest among the Other Races category. At every quintile, White workers are paid more than non-White workers, and their relative gains tend to increase at higher quintile of the distribution. This result suggests the existence of sticky floors for non-Whites that prevents them from achieving an equivalent wage due to the higher returns to characteristics in favor to Whites, in particular for men. The estimated wage gaps between non-Hispanic White and others – either Hispanics or non-White non-Hispanics – is evidence of the presence of the U.S. labor market polarization.
The college wage premium increases non-monotonically and the recent increase in wage inequality is not only due to the higher returns to higher education but also due to larger within-group wage dispersion among more educated workers. Pre-determined conditions to workers such as working status or English language proficiency widen wage gaps, particularly at the top-end, up to 33.59 dollars per hour.
From a regional point of view, most of the wage dispersion in the U.S. is attributed to the within-state wage inequality. The between-state inequality accounts only for less than 20 percent during the sample period.
The wage shares held by top one or top ten percent highest earners are stable even during the financial crisis. They preserve about ten percent and thirty two percent of total annual wages, respectively. The within-age cohort wage inequalities tend to increase with age except for the teens as their potential experience increases.
The between-occupation inequality is smaller than the within-occupation inequality. There exists large relative gain of top one percent in managerial occupation relative to those in other occupations, which is 149.37 dollars per hour. Workers are in the financial sector are paid up to 116.97 dollars per hour more, depending on their relative ranks in the wage distribution.
The U.S. wage dispersion increases after the financial crisis and it is mostly due to the widening difference in the upper tail. In terms of composition or wage structure effects, wage structure effects account more for wage inequality. The composition effects linked to the industry has shown as increasing overall inequality. The most important contributor to overall inequality is different at the top and at the bottom of the wage distribution. Wage structure effects linked to education are contributed to increasing wage inequality in the upper tail, but these are attributed to reducing wage inequality in the lower tail of the wage distribution.
Chapter 3: Inequality and Unequal Opportunity in the United Sates
Although many studies focus on inequality of outcomes (e.g., household income or personal income or educational attainment), the outcome inequality does not adequately reflect the inequality in society since this inequality is also the result of different levels of efforts. Thus, inequality itself can be neither all good nor all bad (Ferreira and Gignoux 2011). The primary concern for inequality of opportunity (IOP, see Roemer, 2000) emphasizes the aspects of pre-determined factors that are beyond an individual’s control such as family background or individual core characteristics. Measuring IOP starts by sorting the determinants of outcomes into two exclusive classes: the factors that are beyond individual responsibility ( circumstances ) and factors are under the control of the individual ( efforts ). Utilizing an ex-ante approach, this study measures how much of the observed U.S. income inequality is attributable to IOP. In addition, the relative importance of each circumstance is examined using the Shapley decomposition.
During 2000-2014, about 35 percent of U.S. inequality should not be considered due to the differences in the individual efforts but rather as due to circumstances. This share of inequality that is considered as due to circumstances increases after the financial crisis. These results may imply that the effort characteristics, which are under the individual’s control, became less important in the U.S. labor market due to the shrinkage of the middle quality jobs after the financial crisis. Among five racial groups, IOP among Blacks is the highest while that of Asians is the lowest. After the financial crisis, the IOP increased for Blacks and Other Races but decreased for Whites, Asians, and Mixed-Race members of society. IOP of non-Hispanics is higher than that of Hispanics.
As for the decomposition results, while own circumstance contributes more to total IOP in the group of Whites and Mixed-Race individuals, family background was more responsible for total IOP among of Blacks, Asians and members of the Other Races group. For non-Hispanics, the larger contribution of the own circumstance was especially evident after the financial crisis. Meanwhile, for Hispanics, family background became increasingly more important after the financial crisis.
Recommended Citation
Park, Gowun, "Three Essays on Inequality in the United States" (2017). CUNY Academic Works. https://academicworks.cuny.edu/gc_etds/2038
Included in
Income Distribution Commons , Labor Economics Commons
- Colleges, Schools, Centers
- Disciplines
Advanced Search
- Notify me via email or RSS
Author Corner
- Submission Policies
- Submit Work
- CUNY Graduate Center
Home | About | FAQ | My Account | Accessibility Statement
Privacy Copyright
Untangled: Income inequality and generational wealth

There has always been a divide in this country between those with money and those without it. Yet this divide has seemingly expanded in recent years.
In the year 2010, there were 404 billionaires in the United States. By 2024, that number had nearly doubled to 756.
This expansion of income inequality has reached every level of society, and as inflation drives up prices, many people are struggling to afford housing.
On this episode of Untangled , we examine generational wealth and income inequality, and how it can hurt people seeking to buy a house.
- Leah Evans, President and CEO, Homeport
- Chuck Collins, Director of the Program on Inequality and the Common Good at the Institute for Policy Studies
- Gene Slater, national housing expert
If you have a disability and would like a transcript or other accommodation you can request an alternative format .

Opinion: Income inequality is gutting the middle class
I care about economic inequality. I teach a class on it. I wrote a book about it. Yet, recently, two different arguments have popped up with a seemingly similar conclusion: economic inequality hasn’t risen as much as conventional wisdom would suggest.
While these two arguments have the same implication, they look at vastly different ends of the income distribution.
The first focuses on the bottom 20 percent of households by income and suggests an actual reduction in inequality. The point is that through increased government transfers, the bottom has actually caught up to the middle over the last 40 years. The second argument focuses on the top 1 percent of the income distribution. It argues that estimates of the top 1 percent’s share of income make assumptions that may overstate that share’s growth and thus the growth of inequality.
I don’t necessarily disagree with either of these arguments. Over the last 50 years, the social safety net has expanded in ways that reduce poverty and benefit the bottom 20 percent relative to the middle. And, because most surveys of household finances miss out on the top 1 percent, calculating their share of income is hard. It requires assumptions , and those assumptions will yield different estimates of growth. While I don’t profess to know which group is right — the one saying lots of growth or the one saying less — I know enough to admit that I don’t know.
So, if I don’t disagree with these arguments, then why am I writing this? Because I think a focus on the poles of income distribution distracts from the real story: the stagnation of the middle over the last 50 years. Sure, the bottom has caught up to the middle partially because of government programs. But the other part of the story is that the bottom has also caught up because the middle hasn’t seen much income growth at all.
The figure below illustrates this point. It shows how GDP per capita, the median earnings of female versus male full-time workers and the median income of Black versus white households have grown since 1975. While per capita income in the U.S. nearly doubled over this period, the same can’t be said for anyone in the middle.
The median working man saw his real income decline . And, while the median working women saw increases, this is largely because their education and work experience expanded rapidly. In any case, despite these gains, they still couldn’t keep up with the economy’s growth nor catch up completely to men — the gender wage gap today sits around 83 percent .
At the household level, things aren’t great either. Median income for white households grew about 25 percent. Black households saw even less growth. That’s right, since 1975, the Black-white household income gap has grown . And while those making the first argument above could fairly point out that my numbers do not account for non-cash safety net programs like food stamps or Medicaid, the median household isn’t getting these programs anyway.
These data contain questions about the economy that demand answers. Why aren’t labor markets providing any economic growth for middle-earning men? Why haven’t middle-earning women — despite massive increases in human capital — been able to outpace the economy? Why are households not seeing much growth despite large increases in women’s earnings and labor force participation? And why did Black households actually lose ground?
Economists know the answers to some of these questions. Technology , trade and the increased power of large businesses all likely play some role in holding down median wages. Women have to trade pay for flexibility due to caregiving responsibilities. The decline of marriage in the middle — at least partially fueled by the economic performance of men — means fewer two-income households than would have occurred otherwise. And Black households still face discrimination , a damaging human capital gap and economic conditions that can make marriage tougher than it is for white households.
These issues demand some consideration. Should we plan for the impact of AI to prevent another four decades lost for middle earners? Would universal pre-K help kids do better and help moms work and earn more if they want? Do we want to change housing policy to improve opportunities for Black households to unstick the racial income gap?
These conversations are worth having, but they won’t be had if people think incorrectly that the issue is settled.
Geoffrey Sanzenbache r is an associate professor of the practice at Boston College, where he teaches a class called The Economics of Inequality. He is also a research fellow at The Center for Retirement Research at Boston College.
For the latest news, weather, sports, and streaming video, head to The Hill.


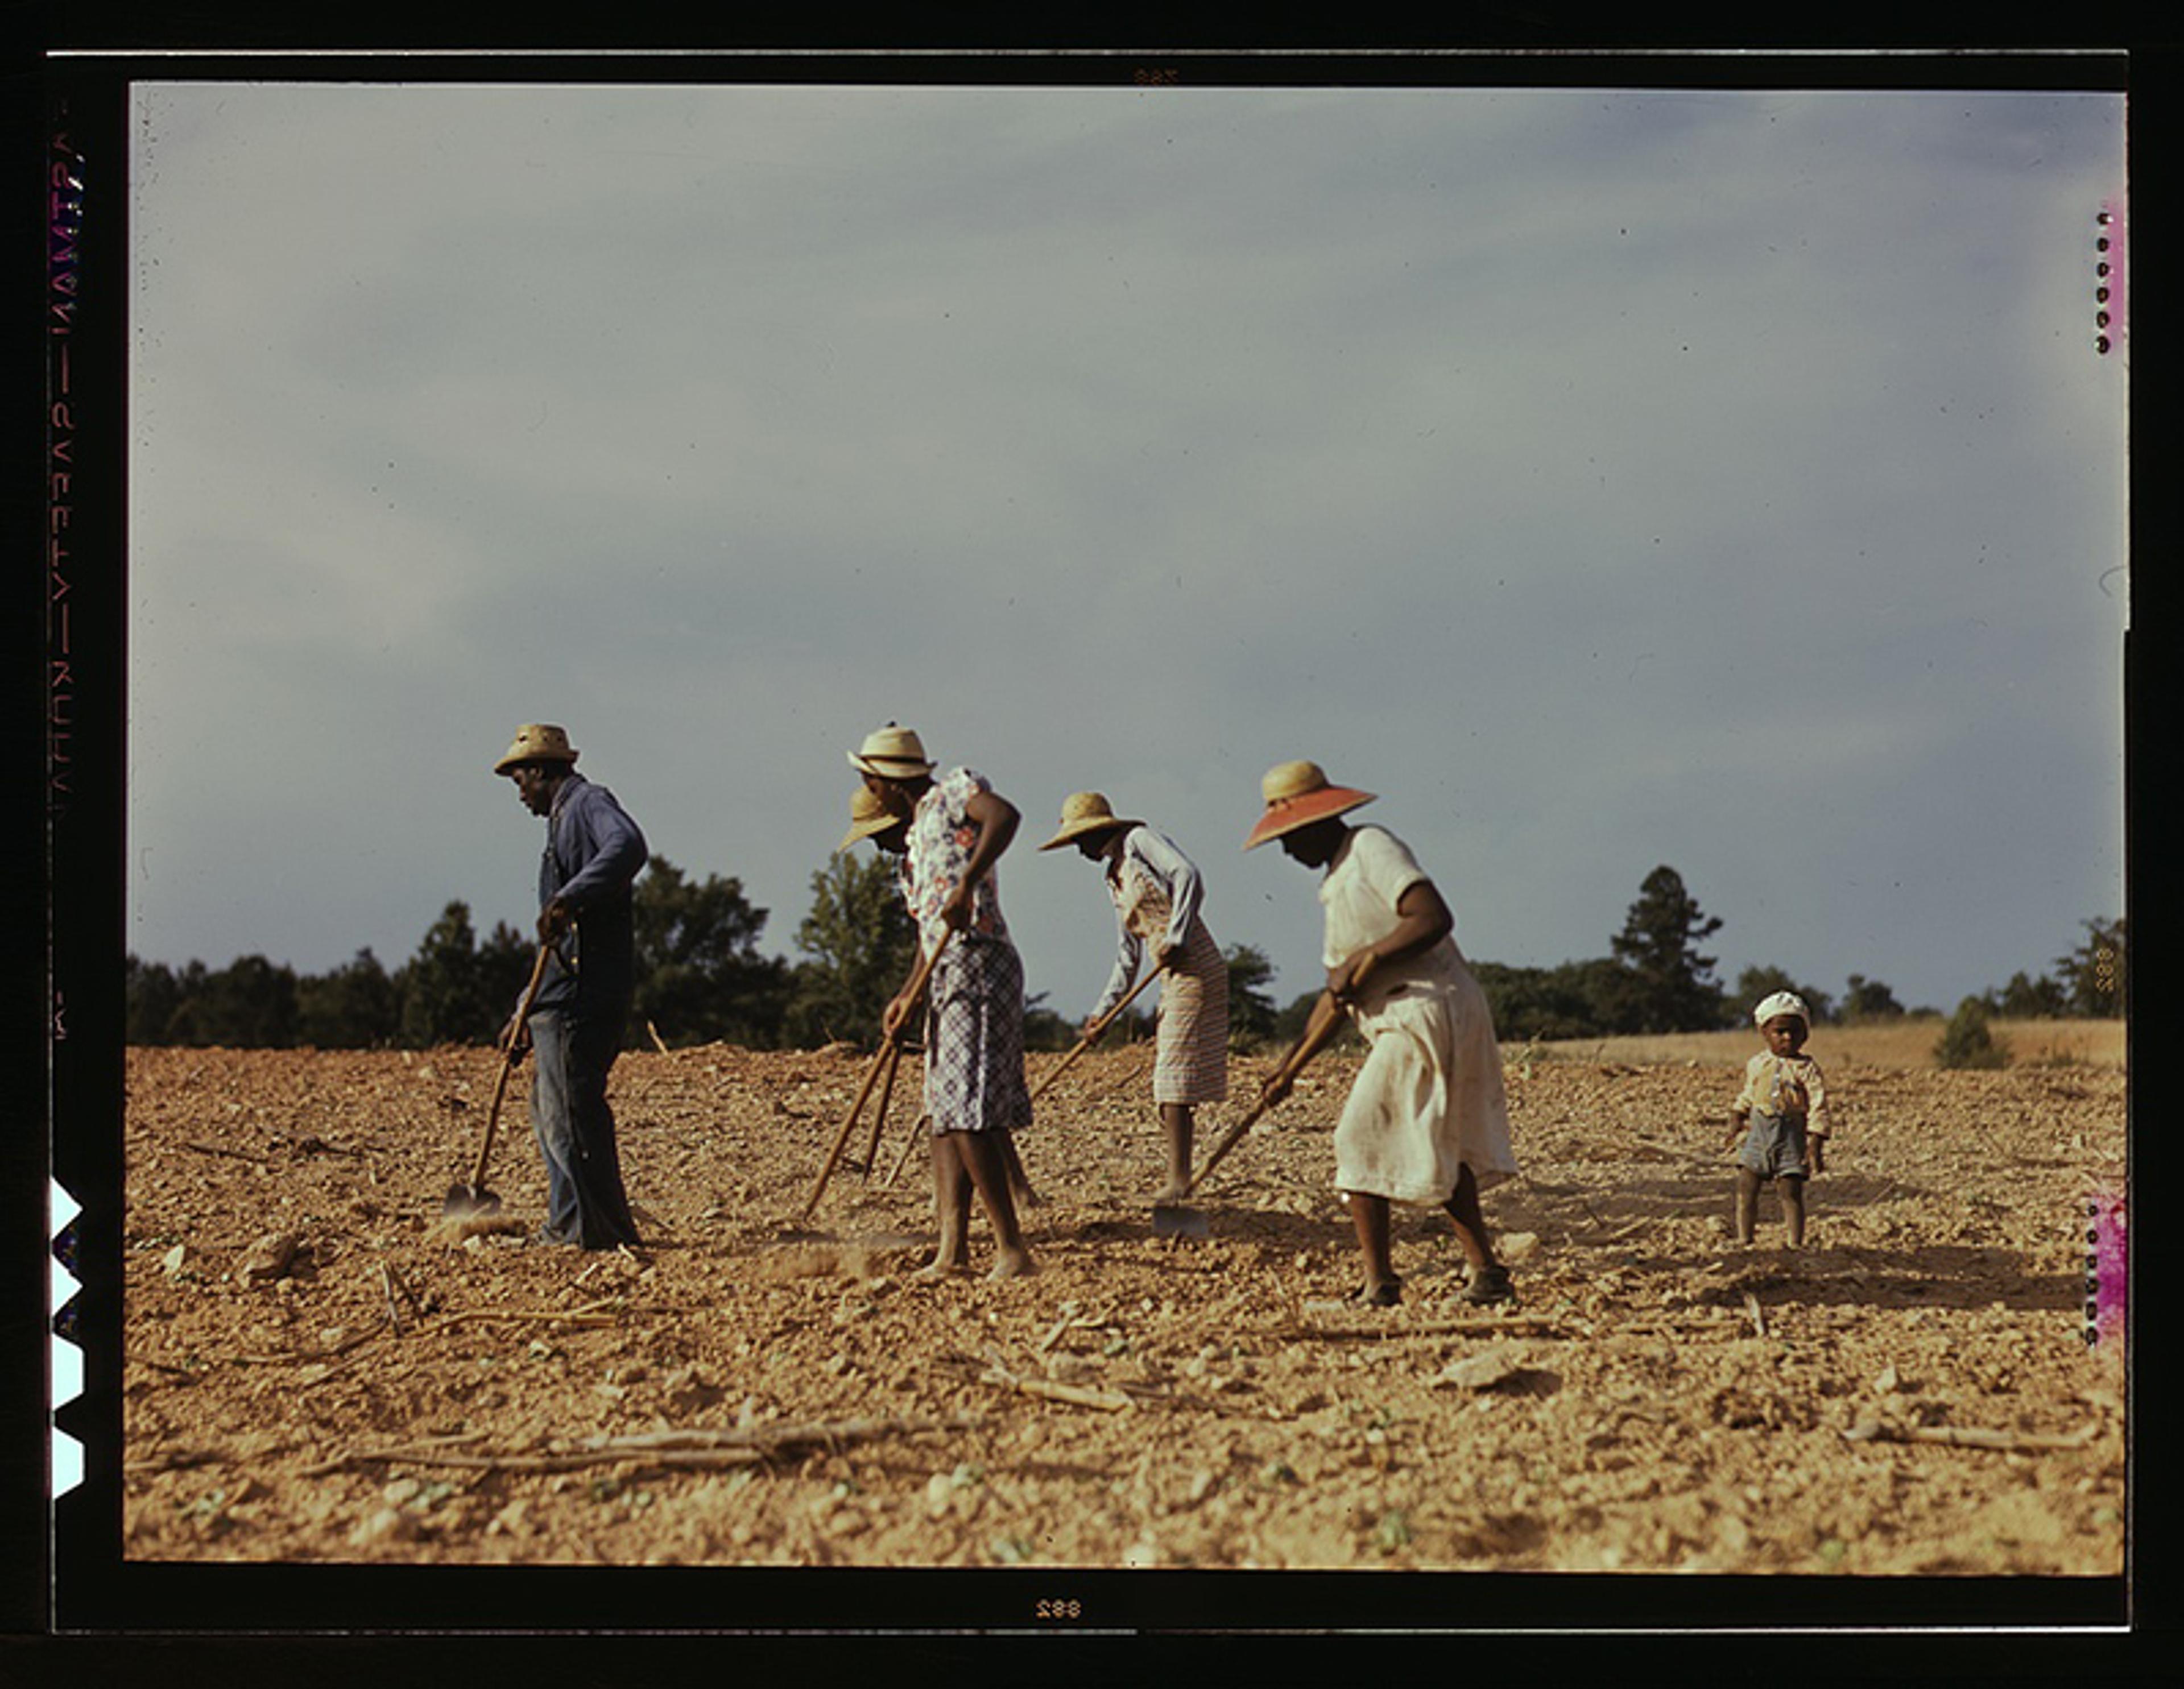
Photo by Pascal Maitre/Panos Pictures
The southern gap
In the american south, an oligarchy of planters enriched itself through slavery. pervasive underdevelopment is their legacy.
by Keri Leigh Merritt + BIO
In 1938, near the end of the Great Depression, the US president Franklin Delano Roosevelt commissioned a ‘Report on the Economic Conditions of the South’, examining the ‘economic unbalance in the nation’ due to the region’s dire poverty. In a speech following the report , Roosevelt deemed the South ‘the nation’s No 1 economic problem’, declaring that its vast levels of inequality had led to persistent underdevelopment.
Although controversial, Roosevelt’s comments were historically accurate. The president’s well-read and highly educated young southern advisors had convinced him that the South’s political problems were partially a result of ‘economic colonialism’ – namely, that the South was used as an extractive economy for the rest of the nation, leaving the region both impoverished and underdeveloped. Plantation slavery had made the planters rich, but it left the South poor.
Unlike the industrialising North and, eventually, the developing and urbanising West, the high stratification and concentrated wealth of the 19th-century South laid the foundations for its 20th-century problems. The region’s richest white people profited wildly from various forms of unfree labour, from slavery and penal servitude to child indenture and debt peonage; they also invested very little in roads, schools, utilities and other forms of infrastructure and development. The combination of great wealth and extreme maldistribution has left people in the South impoverished, underpaid, underserved and undereducated, with the shortest lifespans in all of the United States. Southerners, both Black and white, are less educated and less healthy than other Americans. They are more violent and more likely to die young.
N ow, 86 years after Roosevelt’s report, the South has returned to historically high levels of economic inequality, lagging behind the rest of the US by every measurable standard. The plight of the South is a direct result of its long history of brutal labour exploitation and its elites’ refusal to invest in their communities. They have kept the South in dire poverty, stifled creativity and innovation, and have all but prevented workers from attaining any kind of real power.
With the rapid industrialisation spurred by the Second World War, the South made great economic strides, but never quite caught up with the prosperity of the rest of the US. While the South’s gross domestic product has remained around 90 per cent of the US rate for dozens of years, deindustrialisation of the 1990s devastated rural areas. Since then, hospitals and medical clinics have closed in record numbers, and deaths of despair (those from alcohol, drugs or suicide) have skyrocketed, as has substance abuse. Southerners in general are isolated and lonely, and wealth and power are heavily concentrated: there are a few thousand incredibly wealthy families – almost all of them the direct descendants of the Confederacy’s wealthiest slaveholders – a smaller-than-average middle class, and masses of poor people, working class or not. The South, with few worker protections, prevents its working classes from earning a living wage. It’s virtually impossible to exist on the meagre income of a single, low-wage, 40-hour-a-week job, especially since the US has no social healthcare benefits.
The American South is typically defined as the states of the former Confederacy, stretching north to the Mason-Dixon line separating Maryland from Pennsylvania, and west to Texas and Oklahoma. Today, one-fifth of the South’s counties are marred with the ‘persistent poverty’ designation , meaning they have had poverty rates above 20 per cent for more than 30 years. Four-fifths of all persistently poor counties in the nation are in the states of the former Confederacy. The data is clear that most Southern states continue to be impoverished and politically backwards. Whether measured in terms of development, health or happiness, the region is bad at everything good, and good at everything bad.
The South was portrayed as anti-capitalist: enslavers had to be dragged into modernity against their wills
The recent popularity in liberal circles of the New History of Capitalism (NHC) to explain the region’s exceptionalism has slowed in recent years. The NHC emerged in the 2000s and 2010s, as one historian wrote , by claiming ‘slavery as integral, rather than oppositional, to capitalism.’ It seems likely that during the post-Cold War triumph of capitalism, a subset of historians began trying to tie much of the past to the term – with the most extreme instance being the insistence that slavery was the key to American capitalism. While the NHC scholars rarely define terms like ‘capitalism’, the problems with their theories are more than academic. Unfortunately, presenting enslavers as cunning, profit-driven businessmen not only obscures important features about the past, it also downplays immense regional differences in economic development.
Thinking back over the NHC trends, it is important to note how other scholars, both past and present, have presented the problems of the region, and discuss issues that may have been obscured by a heavy emphasis on business and ‘slavery’s capitalism’. As the economic historian Gavin Wright has pointed out , the NHC’s central claim, echoed in The New York Times ’ Pulitzer Prize-winning ‘1619 Project’ – that slavery was essential for American economic growth – ignored decades of accepted historiographical work on capitalism and slavery. It also contradicted nearly everything economists have argued regarding slavery’s impact on the South’s (under)development.
Beginning in the 1960s, many historians classified the South, from the days of slavery until the Second World War, as distinctively precapitalist in significant ways. They saw the region as having a type of ‘merchant’ or ‘agrarian’ capitalism, and never considered the states of the Old Confederacy as shrewdly ‘capitalist’ (the term itself without any modifiers). Primarily due to the absence of a free labour society, but also because of the lack of infrastructure and development within the region – a place with few cities, little industrialisation, and few social services – the South was often portrayed as distinctly anti-capitalist: enslavers had to be dragged into modernity against their wills.
After the Second World War industrialisation boom ushered the South into a more fully capitalist society, it essentially became a colonial economy to the North, as it courted investment and corporations from the capital-rich Northeastern US. Existing in a dependency-type of relationship, it was never really the South – or southern labour, no matter how unfree or brutalised – driving the US economy.
Finally, contrary to the position that American slavery represents the key or essence of capitalism, the most recent scholarship regarding economic analysis of slavery argues that the institution was not economically efficient. All these points highlight the need for studies on growth, and more importantly, on underdevelopment. Slavery made the planters very rich, but it made the South very poor. In the 19th century, capitalism, even industrial capitalism, did not bring the South to the developmental standards of the rest of the nation. The question remains: why is that so?
I f we turn from looking at planters to studying labour, we see that elite capture of the state is bad for democracy and worse for development. It also helps us distinguish between growth and development, highlighting the unevenness of both in different areas of the US. The US is a large country and awareness of the difference between growth and development can help us see that perhaps it makes more sense to compare the American South with places in the Global South rather than the American North or West.
To begin with, southern militias proved an effective imperial military tool during the brutal process of Indian Removal, which lasted into the 20th century. The white colonialist push westward robbed Native Americans of the greatest wealth the region has: land. That land eventually became the richest white people’s main source of power, owned by the few and guarded like a religion. Elite white southerners were obsessed with intermarriage and have kept their fortunes intact for generations. While they hoarded riches and resources for themselves, they neglected to invest in the communities in which they lived. With few improvements in technology and development, the South’s dependence on slavery enriched enslavers and their descendants, but it left the rest of the region, both people and resources, deeply and cyclically impoverished.
Americans think of the US as having been at a crossroads in 1860, between slavery and freedom, but that impasse was more than just political and ideological: it was also economic. While the North had made fantastic gains over the previous decades by investing in its people, from education to infrastructure, the South lagged far behind. The wealthy enslavers refused to invest in the poor and middling-class whites surrounding them, finding no compelling reason to put money into communities they would move away from as soon as the western spread of slavery beckoned. In terms of development, whether infrastructure, education, healthcare or wealth distribution, the South remained woefully underdeveloped in comparison with the rest of the country.
The Deep South instead functioned more like an oligarchy or aristocracy
With one-third of the nation’s population in 1860, the South was responsible for only 10 per cent of US manufacturing output, and possessed only 10 per cent of the nation’s manufacturing labour force and 11 per cent of its manufacturing capital. Its transportation system, best described as like a ‘conveyor-belt’, transported goods effectively but did little for people. The northern and even western US had been investing in building schools and providing free public education, but the cotton South left its people to fend for themselves: education was reserved for the rich. The North built hospitals, asylums and places for the invalid and indigent; the South built jails and prisons.
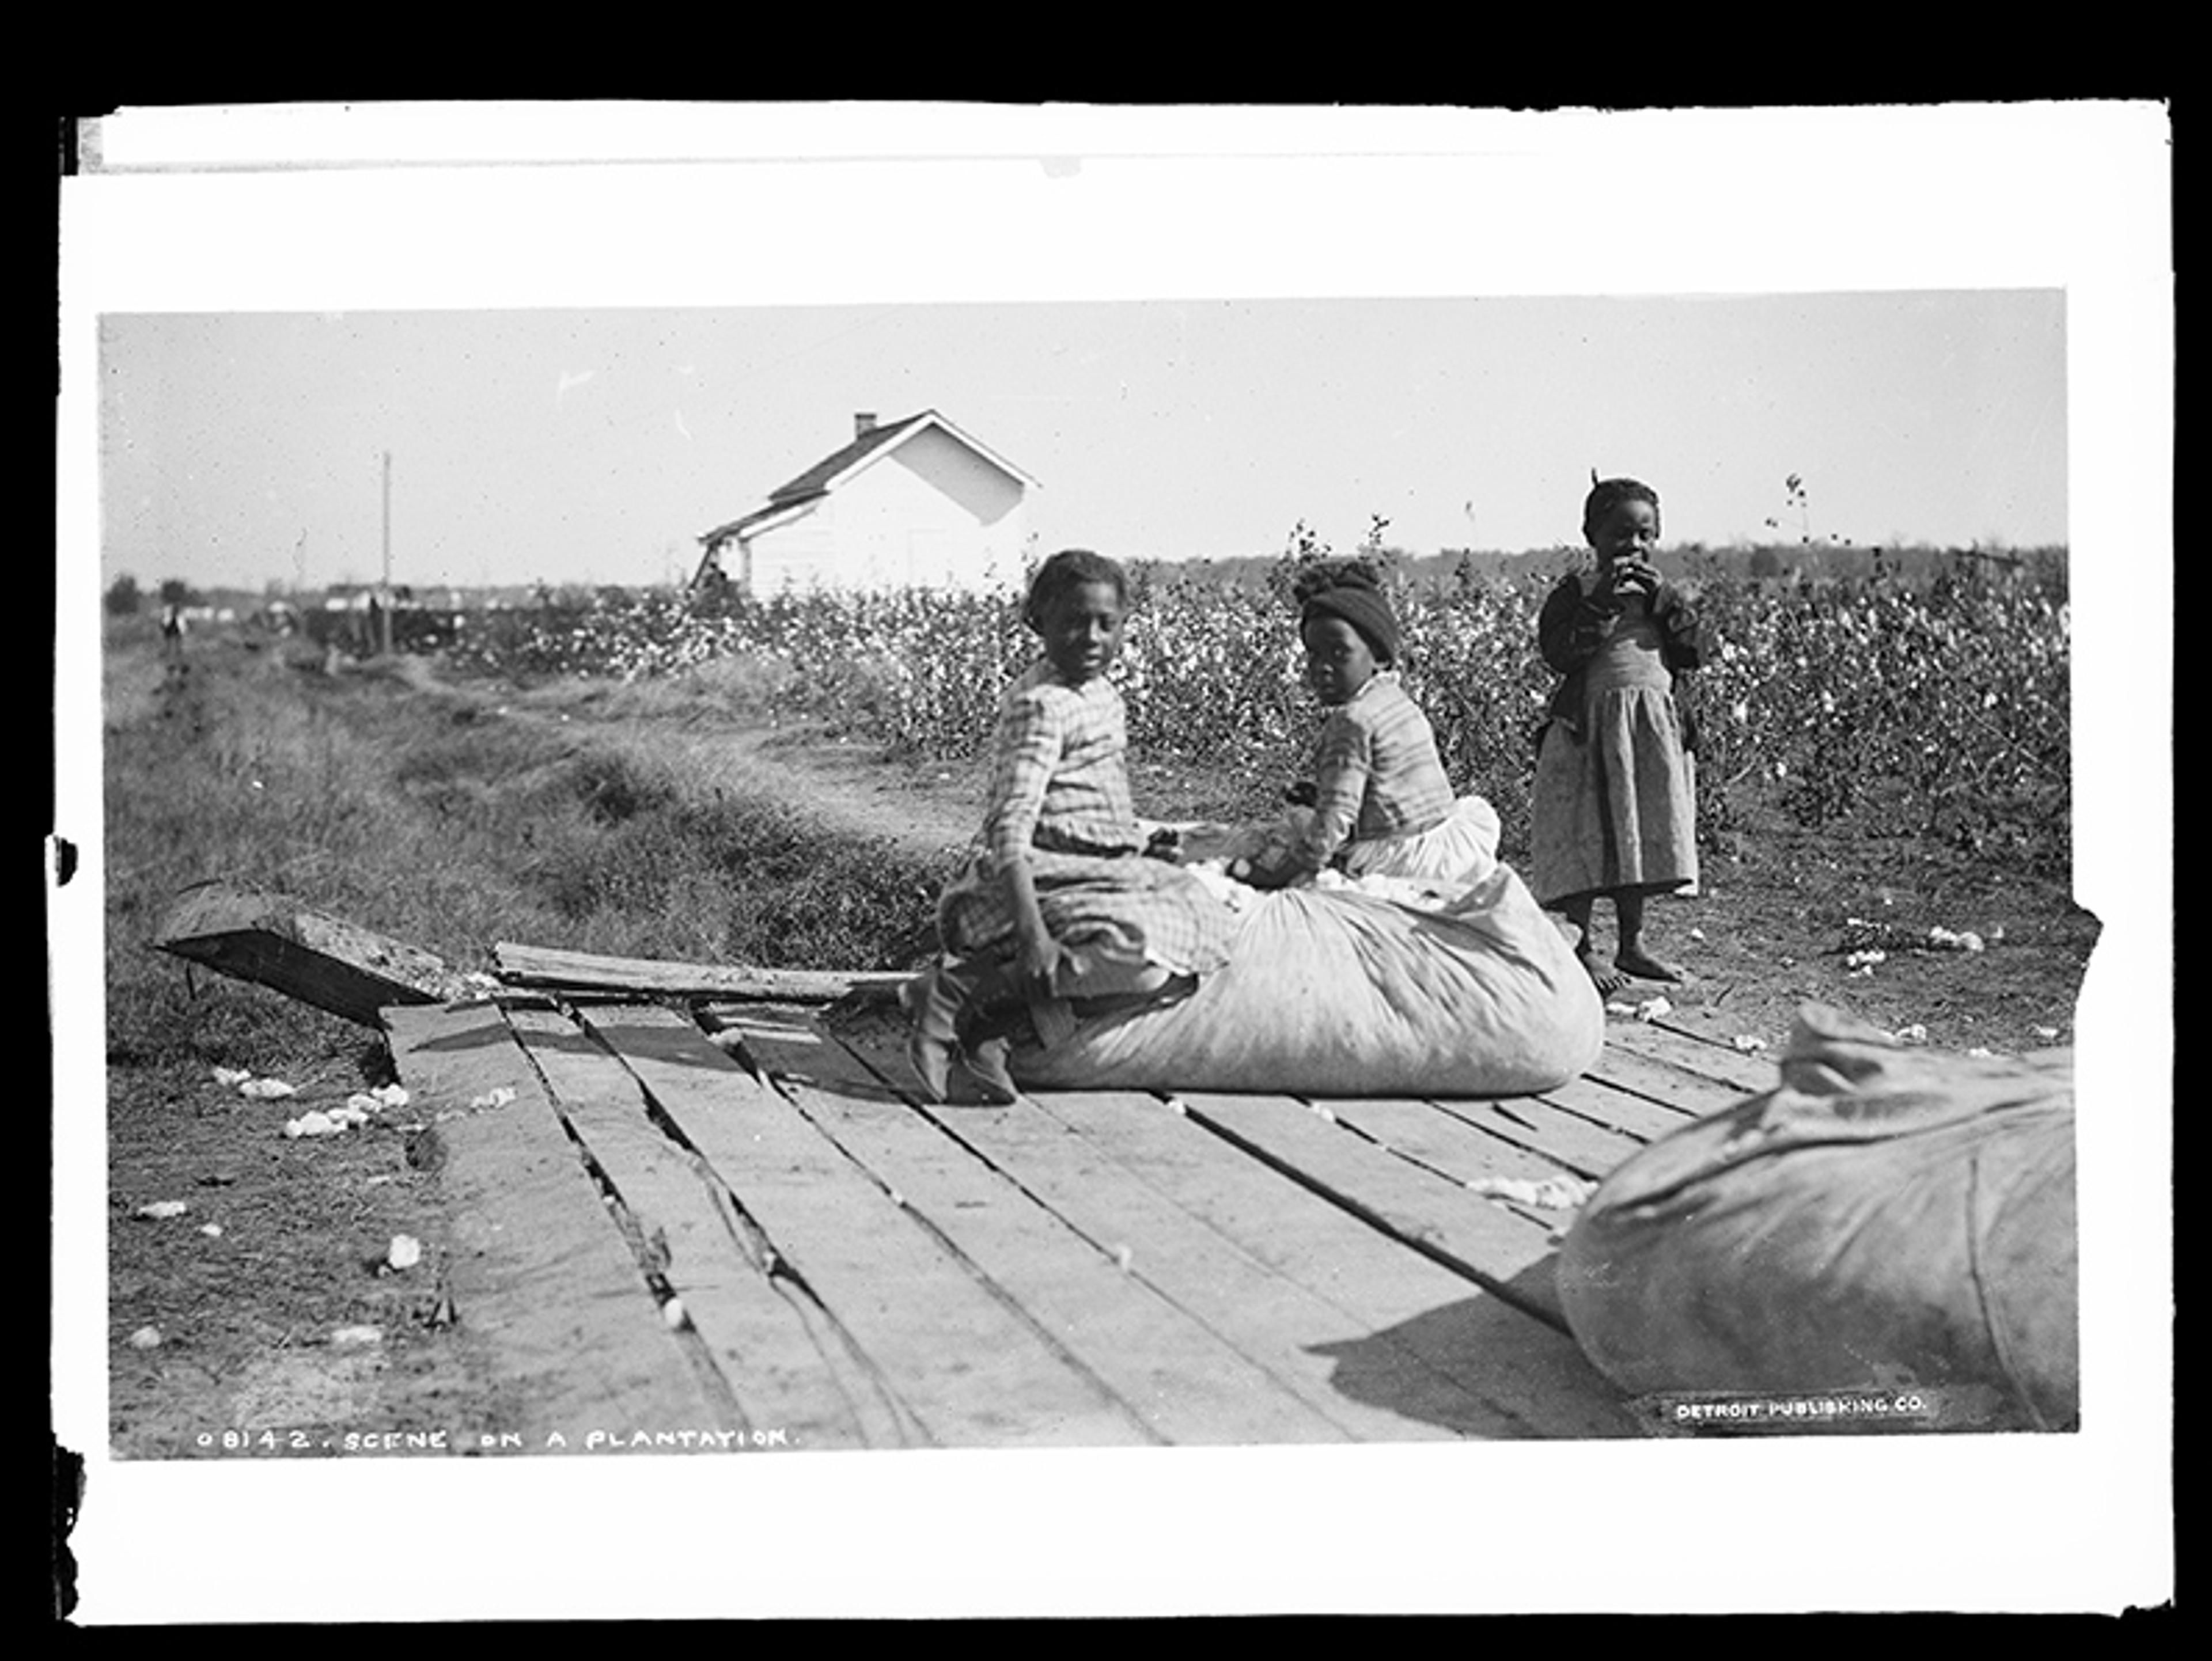
Far from a democratic region, the Deep South instead functioned more like an oligarchy or aristocracy. As W E B Du Bois wrote in 1935: ‘Even among the 2 million slaveholders, an oligarchy of 8,000 really ruled the South.’ The wealthiest slaveholders wielded immense and pervasive power as lawmakers, law-enforcers, judges and even jury members. They dominated the region’s politics and devised multiple ways to disenfranchise their poorer fellow countrymen. The oligarchic structure of the 19th-century South meant that the men who controlled government also controlled everything else in society, from rental properties and bank loans to arrest warrants and vigilante violence.
In fact, the enormous cost of the South’s implementation of its various forms of unfree labour still haven’t been adequately calculated. The ubiquitous, police-state-like criminal justice system, complete with slave patrols and night riders, the overseers and slave-drivers and catchers and other middlemen who had to be hired to keep people working – none of that has truly been accounted for yet. Recently, the economists Richard Hornbeck and Trevon Logan challenged decades of accepted scholarship concerning the cost-effectiveness of slavery, arguing that slavery was inefficient when ‘including costs incurred by enslaved people themselves’. Under this view, emancipation produced major economic gains.
The first years of Reconstruction brought immense changes to the South: a free labour economy threatened to change the entire social order as Black politicians courted poor white voters for a cross-racial, class-based coalition. For the first time, the region experienced democratic elections, open to all men, Black and white. The new state legislators established a system of public education. They began funding public works and infrastructure. They started developing the region.
Despite these transformations, former slaveholding families remained rich – and powerful – because they held a near-monopoly of the only real capital left in the war-torn South: land. The leaders of the Confederate insurrection were never held accountable for treason, and the same few wealthy white families who ruled the slave South remained entrenched in power even after the war. Their enduring place at the top of Southern society helped give rise to the ‘continuity thesis’, in which some scholars argue that, despite the Civil War and Reconstruction, little changed in the US South. In many rural areas, even today, their heirs still lord over their little locales. The South’s ruling elite eventually regained complete control of the region, disenfranchising the masses, terrorising the leaders and the intellectuals and the brave, and undergirding this shadow world of unfreedoms with the ever-present threat of violence.
T he Southern elite may have, eventually, emerged from Reconstruction back on top of the South, but the region no longer dominated US politics. The US South remained overwhelmingly agricultural well into the 20th century and long after the rest of the country had become more urban. From the vital perspective of social and labour relations, the South’s transition to capitalism must be considered as late by US standards. In the 1940s and ’50s, historians began arguing that the type of capitalism in the South throughout the early 20th century was merchant capitalism (also known as mercantile, or agrarian capitalism), not industrial capitalism. Merchant capitalism is considered the earliest phase in the transition to capitalism; it is more about moving goods to market, and is characterised by the lack of industrialisation, wage labour and commercial finance. A modified version of the merchant capitalism model would be championed several decades later by Eugene Genovese whose southern ‘in but not of’ capitalism theory, replete with semi-feudalistic social relations, appeared in the 1960s and generated great interest and debate, and eventually, in the early 2000s, came under sustained attack by some US historians who emerged following the end of the Cold War.
These scholars, who eventually came to be grouped under the designation ‘the New History of Capitalism’, never truly engaged with the consequences of the fact that the slave South, in a strict sense, cannot be considered capitalist because the enslaved are unfree, forced labourers who cannot sell their labour power. Even if we sidestep the slavery-as-labour issue, vital to Marxist assessments of capitalist society, we must acknowledge that impoverished southern whites also had little to no control over their respective labour power. The power of enslaved labour consistently reduced the demand for workers, lowered their wages, and rendered their bargaining power weak to worthless. Labourers in the South, regardless of race, worked within a world ruled by degrees of freedom. Never a stark dichotomy, freedom emerged from a give-and-take process of political contestation and negotiation with the planter aristocracy. Slavery was simply one form – albeit the harshest – of a range of unfreedom, lasting well into the 20th century.
But these merchant capitalist labour market features were not simply rooted in the racism of southern white culture. Instead, elite white southerners ensured a calculated and well-codified social order, complete with exploitative labour practices, debt peonage, and continuing forms of unfree labour made possible by the burgeoning criminal justice system. To maintain power and thus control of the region, at times the elite chose to forgo higher profits in the short term so that they could keep their labour force under tighter control in the long term. This was certainly the case with industrialisation during slavery, when enslavers could have turned a much higher profit by industrialising but chose not to; they did not want to disturb the fragile hierarchy.
South Carolina – the birthplace of the Confederacy – has the lowest union membership, at 2 per cent
Compared with the rest of the US, with only a brief interruption during early Reconstruction, the South’s lack of labour power, infrastructure and internal development extended well into the 20th century. Between the violence the Ku Klux Klan and other white supremacists, and the lack of opportunities for poor and working-class southerners, by the mid-1870s former slaveholders and their descendants were back in complete control of the South. Due to the absence of land reform, reparations and the failure to punish Confederate leaders or confiscate Confederate property, the labour lords of the antebellum period merely became the landlords of the postbellum period. Their primary source of wealth changed, but they remained in power, controlling everything in the South and reverting to their old ways of undertaxing, underfunding and underdeveloping.
Given these facts, before the popularity of ‘the New History of Capitalism’ 20 years ago, many historians viewed the transition from slavery to capitalism as a long process because, even after emancipation, unfree labour continued to dominate a significant portion of the labour market. Some argued that forms of unfree labour persisted in the South as late as the 1920s and ’30s, and others claimed they lasted until the Second World War. Even when technically free, African American workers generally lacked the labour power necessary to be deemed a proletariat, able to effectively negotiate on a labour market. Due to predatory sharecropping contracts and debt peonage, an extremely punitive criminal justice system, and the added layer of domestic terrorism from white supremacists, the poorest people in the South, both Black and white, still worked in a society in which labour was not entirely free, that is, able to be brought to a labour market.
The South’s shadowland of unfree labour rested entirely on an undemocratic government, also meant to control labour. In the 1880s and ’90s, when Farmers’ Alliances and Populism began mounting a serious political challenge to planter domination, every southern state passed laws limiting the vote. While primarily aimed at disenfranchising Black people, the laws also disenfranchised poor white people, further concentrating each state’s political power in the hands of white elites in plantation districts. It was an effective strategy: in 1880 there were 160,000 union members in the US, and fewer than 6 per cent of them lived in the South. Today, while a record low of just 10 per cent of Americans are union members, the South’s numbers are roughly half of that, with states like South Carolina – the birthplace of the Confederacy – having the lowest union membership in the nation, just over a measly 2 per cent.
During the last third of the 19th century, the value of output rose and capital investment in the US increased tenfold. Meanwhile, most of the Deep South (outside of a few large cities like Atlanta and New Orleans) remained ‘capital starved’ and ‘technologically laggard’, as the region’s elite continued to baulk at infrastructure or other kinds of developmental investment. To secure funding, the states of the former Confederacy needed to court investment from outside the region – first the North and West, later Europe and Asia. Originally, southern politicians chased northern capital by offering them generous tax breaks and other financial incentives. Without a strong tax base or an effective bureaucracy, the region suffered further because most profits were routed out of the South back to northern owners and investors. Taken together, these things meant that, well into the 20th century, the South remained overwhelmingly rural, without a strong system of infrastructure and no good plan for development. In 1900, the country was 40 per cent urban versus the South’s 18 per cent, and 25 per cent of the US labour force was involved in manufacturing versus the South’s 10 per cent. Something had to drastically change.
F ollowing the Great Depression, which hit the rural, already-impoverished South harder than it did the rest of the nation, the New Deal influx of money, federal programmes, jobs and infrastructure helped bring the region fully into the 20th century. Perhaps most importantly, in the 1930s Roosevelt’s New Deal finally broke up the power stranglehold by the big land (plantation) owners. The South was finally able to evolve from an agricultural labour market that had pre-capitalist characteristics, shifting to a much larger industrial workforce during the Second World War. Some $4 billion in federal spending poured into the region, funding military facilities and forever ending the isolated labour market. Since 1940, the South has outperformed the rest of the US in income, job and construction growth, finally reaching about 90 per cent of national per-capita income norms. It has also remained critically behind in multiple important infrastructural and development measurements, from education and transit to poverty levels and healthcare.

Without question, the Second World War changed the South for the better. War industry jobs pulled workers from rural areas, forcing southern farms to finally mechanise. This mechanisation meant the destruction of sharecropping and tenant farming, as well as debt peonage. Workers in the South would finally be paid in wages – in cold, hard cash. And that fact was incredibly freeing.
Outside of extractive industries, the type of industry that came to dominate the South was reliant on intensive, low-wage labour, a striking difference with the rest of the US. ‘A low-wage region in a high-wage country,’ the South industrialised in a way that preserved and reinforced the class and racial status quo, even when corporations were owned by men from outside the region. Instead of being an agent of radical change, southern industrialisation preserved the region’s legacies of low taxes for the wealthy, heavy-handed labour control, and little in the way of governmental oversight or regulation.
Development is, quite simply, an essential part of restorative justice
Even as the South experienced a period of relative prosperity from the Second World War to the 1990s, with development at its peak, it never quite caught up to the rest of the nation. While there were myriad reasons for this remaining gap, historians have attempted to explain them with a type of regional dependency theory. Referring to the old Confederacy as a ‘colonial economy’, they argued that northern-owned corporations controlled southern money and power, extracting resources and exploiting cheap labour, siphoning both profits and tax dollars away from the impoverished region – all while maintaining racist practices. Adding insult to injury was that the southern economy became the domain of men from outside the South, men with no stake in the local communities their decisions ultimately affected (indeed, often devastated).
Whether or not the South was truly a colonial economy, framing it as such highlighted that the region remained impoverished, infrastructurally stunted, and underdeveloped. Even the golden era of the sunbelt South came to a bitter end by the close of the 20th century. Rural developmental problems began as far back as the 1980s, as local banks began shuttering and hospitals closed. Things worsened in the 1990s, as the economic growth the South enjoyed for decades came crashing to a halt when federal trade deals eviscerated manufacturing. The racial tolerance and progress made possible by labour unions and working-class solidarity began to erode; deindustrialisation profoundly changed the region. Never having invested much in public services, state governments continued to slash budgets through the 2000s. This not only stalled new development, it also let much of the states’ infrastructure, education and healthcare plans fall deeply into trouble, perhaps disrepair.
To address the continuing developmental gap in the poorest areas of the US, the country’s staggering levels of inequality must be addressed. Using policy to redistribute property, the South – and the nation – may finally be brought up to the standards of the rest of the developed world. From universal healthcare and a thriving public education sector to functional public transportation and reliable infrastructure, development is, quite simply, an essential part of restorative justice. With deeply progressive taxation coupled with democratic reforms, the right to organise and collectively bargain may be preserved; the right to retire fully funded; the historically racist criminal justice system switched to a Nordic model. Even the poorest rural Americans could lead lives with dignity due to governmental programmes such as a universal basic income (which would immediately lift more than 43 million people out of poverty) and a federal jobs guarantee – a concept derivative of the best aspects of the New Deal.
Today, more than a lifetime after Roosevelt’s declaration of the South as the ‘the nation’s No 1 economic problem’, nothing has changed. The South remains poor, underdeveloped, and lags behind the rest of the country by every measurable standard. It is a moral blight on the nation’s conscience, and far past time to truly lift the region out of poverty, and into the 21st century.

Thinkers and theories
Our tools shape our selves
For Bernard Stiegler, a visionary philosopher of our digital age, technics is the defining feature of human experience
Bryan Norton

Family life
A patchwork family
After my marriage failed, I strove to create a new family – one made beautiful by the loving way it’s stitched together
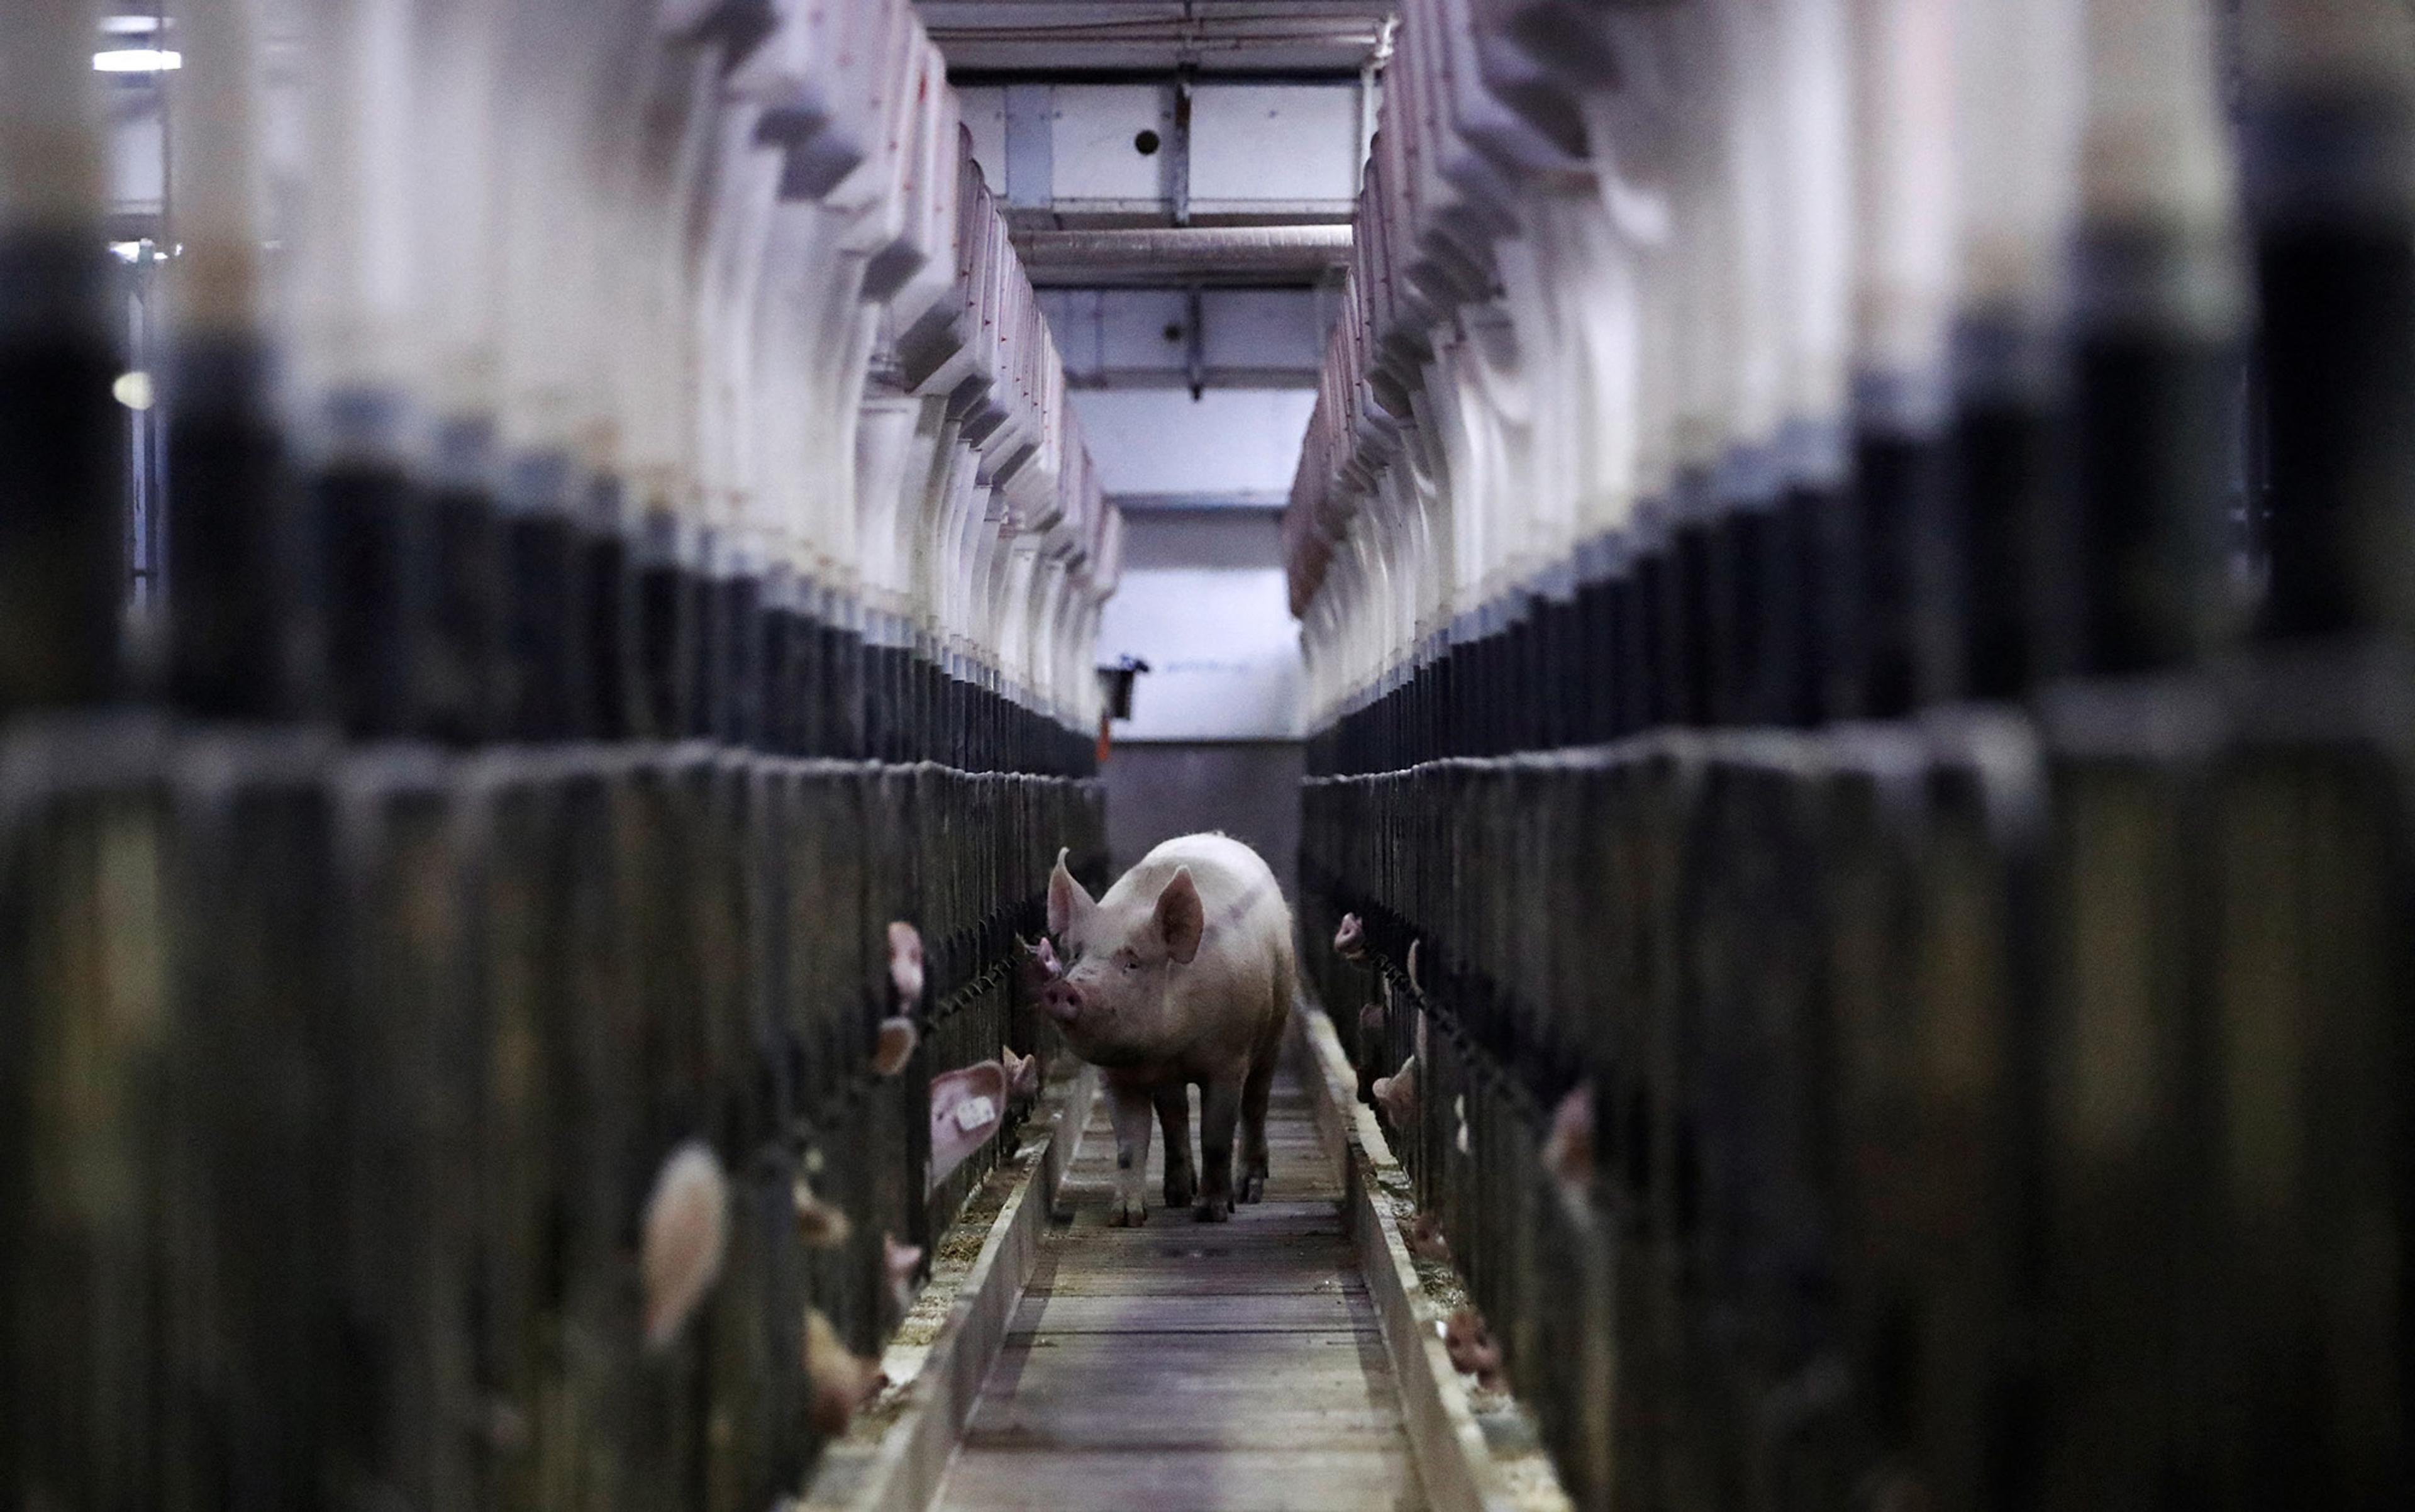
The dangers of AI farming
AI could lead to new ways for people to abuse animals for financial gain. That’s why we need strong ethical guidelines
Virginie Simoneau-Gilbert & Jonathan Birch

War and peace
Legacy of the Scythians
How the ancient warrior people of the steppes have found themselves on the cultural frontlines of Russia’s war against Ukraine
Peter Mumford

Public health
It’s dirty work
In caring for and bearing with human suffering, hospital staff perform extreme emotional labour. Is there a better way?
Susanna Crossman

Prehistory in the atomic age
To understand the terrifying futures unleashed by nuclear weapons, we urgently need to return to the deep past
Maria Stavrinaki
- How it works
Essay on Income Inequality in the United States
Income refers to the revenues that result from wages, salaries, saving interest, dividend, and profits that are accrued from commercial services (Ichiro & Subramanian, 76). On the other hand, income inequality refers to the uneven distribution of income among the population and therefore increasing the gap between the wealthiest individuals and everyone else in the country. The income disparities in the United States have been growing considerably as predicted by statistical measures in the last thirty years. This change can be attributed to various factors which also affect the nations economy. The comparison shows a significant disparity among the top earners and bottom earners (Cingano, 97). However, the uneven distribution can also be seen in the top 1 percent which indicates that they earn a disproportionate amount of income. The extreme shift in income occurred around the 1990s and which saw an explosion in the sizes of ultra-rich income (Cingano, 106).
Education and wealth can be attributed to the income disparities. Affordable education has been a critical element with bipartisan support. Financial assistance has made education more accessible, and this has increased income disparities. More training raises the skill premium, and the case of unskilled skills suffers a decreasing wage. When the ability is premium only the best, and high-quality personnel is employed leaving a pool of man educated people jobless (Kawachi, 86).
Higher education increases income mobility for the low-income students. When access is limited by low family income, then only the rich are likely to graduate, and hence this does not influence the low-income student life positively. It is clear that parents income is the predictor of the childrens future income. Possession of bachelors degree enhances higher incomes, job choice, satisfaction, and security (Kawachi, 96). This means some areas which have low graduates will critically need these graduates. This, in turn, increases their salaries and leads to disparities. This is also happening in cases where some degrees are classified as market relevant than others.
Job discrimination has also had enormous impacts on income disparities. In some cases, high competition in the market has resulted in prejudice. In some areas such as China and India, labor costs are low, and hence US companies have led to outsourcing human resources both high tech and manufacturing jobs. Immigrants filing more low paid positions create high supply, and therefore US workers have weak bargaining power. Hiring processes with racial discrimination have considerably widened the black-white income gap (Michael & Howard, 13). Despite the presence of the anti-discrimination policy, the income inequalities are still evident between these two groups. Housing discrimination limits blacks access to education resulting in differential skills. Living in high poverty neighborhoods does not expose the learned to jobs.
Skill and workers ability has a connection with income disparities. The best workers concerning skills and competency are more probable to find high paying jobs(Michael & Howard, 17). Thus those people of low skills may find jobs which are paying below the federal minimum wage. Monopoly in the workplace ensures most positions are available for such individuals. When this occurs, income from such engagement is usually negotiated leading to better pay.
The income inequalities in the US has grown tremendously over past thirty years. The gap is still widening, and this can be attributed to various factors. Education, discrimination and workers abilities and monopoly have been described to show they affect the income disparities (Kawachi, 83). The inequality is working with multiple groups such as the top achievers and bottom achievers. The shift is also evident among the very most exceptional 1 percent top earners. Other factors identified to influence this disparity are; low savings returns, little disposable income growth, technological changes, labor outsourcing, and income stagnation (Ichiro & Subramanian, 70). These issues are in turn affecting the US economy and resulting to slow growth.
Works Cited
Cingano, Federico. "Trends in Income Inequality and its Impact on Economic Growth."INTERNATIONAL ORGANISATIONS RESEARCH JOURNAL 10.3 (2015): 97-133.
Ichiro, and S. V. Subramanian. "Income inequality." Social epidemiology 126 (2014). Omi, Kawachi, Corak, Miles. "Income inequality, equality of opportunity, and intergenerationalmobility." The Journal of Economic Perspectives 27.3 (2013): 79-102.
Michael, and Howard Winant. Racial formation in the United States. Routledge, 2014.
Request Removal
If you are the original author of this essay and no longer wish to have it published on the collegeessaywriter.net website, please click below to request its removal:
- Course Work on Inflation Targeting
- Walt Disney's Theme Park and Resort in Australia - Course Work Example
- Essay on Raising Taxes on the Wealthy
- Essay Example: Electricity Supply in Australia
- History of Behavioural Economics - Essay Example
- Japanese Bubble Economy - Essay Example
- Questions and Answers on Global Poverty - Paper Example
Submit your request
Sorry, but it's not possible to copy the text due to security reasons.
Would you like to get this essay by email?
Sorry, you can’t copy this text :(
Enter your email to get this essay sample.
Don’t print this from here
Enter your email and we'll send you a properly formatted printable version of this essay right away.
How about making it original at only $7.00/page
Let us edit it for you at only $7.00 to make it 100% original!
- Search Search Please fill out this field.
What Does the Data Say?
- Why the Racial Gap Exists
- Why Financial Literacy Matters
Closing the Gap
The bottom line.
- Personal Finance
Financial Literacy
The racial gap in financial literacy.
National surveys reveal a driving factor in the wealth gap
Achieving financial literacy is essential to thriving or even functioning in today's world, but its fundamentals are clearly not being passed along equally to all Americans.
These are the basics of personal finance , budgeting, and investing. Once they're grasped, an individual can make ends meet, invest for the future, take care of a family, manage debt, and make good decisions.
Yet, according to national surveys, basic financial literacy is generally low in the U.S., and it is significantly lower for members of some racial and ethnic groups.
Key Takeaways
- Financial literacy is the possession of the basic skills needed to manage an income, keep debts in control, spend wisely, and invest for the future.
- The near-universal access to credit and debit cards, mortgages, and student loans has made financial literacy more difficult to achieve, and more important to have.
- There’s a disparity in the rates of financial literacy across racial and ethnic groups in the United States, with Black, Hispanic, and Native American populations tending to have lower rates of financial literacy than White and Asian populations.
- Financial literacy is bound up with the structural factors that drive the racial wealth gap in the United States.
The latest update of a study by the Financial Industry Regulatory Authority, released in mid-2021, found that financial literacy among American adults overall is actually declining. When it tested survey respondents with five basic questions about money, the average respondent could answer only 2.6 out of five questions correctly, compared with a score of three out of five in 2008.
In general, the decline in scores was most pronounced among adults aged 39 and under.
And, research found, there was a clear correlation between lower financial literacy and a greater likelihood that a person would suffer financial stress during the COVID-19 pandemic.
When categorized by racial or ethnic group, the data suggests that financial literacy rates are not evenly dispersed, with Asian-American and White test takers tending to score higher than Hispanic and Black test takers.
An earlier installment of the FINRA student, released in 2018, reported that Asian and White Americans were able to correctly answer 3.2 out of six questions meant to assess basic financial literacy, while Hispanic Americans were able to answer 2.6 and Black Americans 2.3. Both scores are below the national average.
The gap can be seen early in life. For instance, the latest PISA Financial Literacy Results data, also published in 2018, shows that White and Asian 15-year-olds have much higher financial literacy rates than Black and Hispanic populations of the same age.
Economic Well-Being
There are also racial differences in economic well-being. Survey data on unbanked and underbanked Americans from the Federal Deposit Insurance Corporation (FDIC) reveals that the portion of Americans who don’t use banking services, and thus are deemed “unbanked,” has declined to single digits.
However, it also revealed that American Indian and Alaska Native, Black, and Hispanic households are more prone to rely on bill payment services, money orders, and check cashing services, which are often related to financial insecurity and a lack of access to basic bank services.
Native American communities in particular suffer from higher levels of financial fragility and distress than most other racial and ethnic groups. They have roughly the same financial literacy rate as Black and Hispanic populations, which is lower than that of White and Asian American populations.
Some studies suggest that Native American young people are of particular concern, as there is a large gap between them and non-Native young people.
It's Never Too Early
Did you know the Federal Reserve publishes comic books for kids? They're just one of many resources available to parents who want to introduce their children to money matters at an early age.
Making Ends Meet
The overall picture, especially in this broader context, can be complicated. Between 2009 and 2018, there was a general increase in Americans’ ability to cover costs but also a decline in savings, which was tilted by race, as well as a disparity in the rates of unexpectedly lost income.
During that time, White Americans saw a 16% improvement in their ability to make ends meet, with Asian Americans at 15%, Hispanics at 14%, and Black Americans at 9%, according to national surveys.
At the same time, White Americans experienced an unexpected reduction in income of 21%, as did Hispanic Americans, while Asian Americans dropped 19% and Black Americans 12%.
Women were less likely to be able to make ends meet than men.
Why Does the Racial Financial Literacy Gap Exist?
For most Americans, basic financial literacy comes from as many as five sources: family, high school, college, employers, and the military.
Studies of the national survey data say that education and household income are the two biggest factors in predicting whether someone has a high level of financial literacy.
Socioeconomic and Political Barriers
Traditional accounts have laid some of the blame for financial illiteracy on a lack of parental guidance and poor decision-making. However, recent studies point to socioeconomic and political barriers. In other words, from their earliest years, members of minority groups are channeled into using predatory financial services and denied access to basic financial education.
The Gender Gap
Explanation of the gender gap in financial skills focuses, in part, on the tendency of men to have more financial experience and education than women. A similar dynamic may be at play in the racial gap, abetted by structural barriers, as minorities may have less access to wealth, higher rates of unemployment, and lower quality education.
Analysis of the reasons why Native American communities in the U.S. lag behind White Americans in financial literacy, for example, points toward historical injustices—the legacy of which are high rates of poverty and unemployment, as well as other barriers that impact the broad concept of economic well-being.
This specific blend of factors has left Native American populations with few opportunities to build financial skills, as well as few family sources of knowledge.
MyMoney.gov
The U.S. Treasury Department has developed a website, MyMoney.gov , with information, videos, and games that can help children, teenagers, and young adults learn about money.
Other Issues
Lack of financial literacy is not just a matter of insufficient parental guidance. A complex recent study of the persistence of the racial gap in financial literacy reported that the gap lingers even with equal access to financial literacy education and that the positive impacts of parental dissemination of financial knowledge depreciate faster for minority groups than for the White population.
On the other hand, members of minority groups in the study benefitted as much as White students from high school and employer education on finances.
Why Does Financial Literacy Matter?
Financial literacy has a clear impact on financial well-being. The U.S. Financial Literacy and Education Commission—the federal body that makes recommendations for increasing financial literacy and education—describes financial literacy as foundational for full participation in the market. The commission says that it is especially vital for “unlocking the foundations of economic opportunity” at the individual level and “powering a strong and resilient economy” at the national level.
As the use of credit cards, mortgages, and student loans has become more common, financial literacy has become more crucial because it correlates to a person’s ability to successfully navigate increasingly complex financial services. People without financial knowledge risk falling behind.
Among other benefits, financial literacy decreases vulnerability to fraud and increases the likelihood of acquiring wealth over time. High financial literacy scores are key to retirement planning , which is a key component of household wealth.
The financial literacy gap also influences other notable metrics, such as the racial wealth gap , which is the measure of wealth held by different races in the U.S.
There are a number of public and private proposals for narrowing the racial gap in financial literacy.
The U.S. Financial Literacy and Education Commission’s 2021 proposal highlighted a set of changes to improve financial literacy in the country. It recommended establishing clear guidelines for financial educators, opening access to one-on-one financial counseling, and consistently measuring the results.
The report emphasizes the importance of tailoring financial literacy to the people and communities in need of education, which it says helps in key areas such as building motivation to learn financial tools. The commission's mandate extends from advising on kindergarten education to helping elderly citizens avoid becoming prey to fraud.
In particular, the commission focused on the role of financial literacy in a robust economic recovery. The COVID-19 crisis highlighted both inequality and the vulnerability of some minority populations.
Of particular note was the vulnerability of at-risk populations to scams and their need for information about economic impact payments and unemployment insurance benefits, and about managing debt and surviving hardship.
Other federal reviews of the existing financial literacy programs have also concluded that one-on-one counseling programs are effective.
Government Resources
The federal government funds many of the available resources to improve financial literacy.
Digital literacy programs are sometimes connected to advocacy organizations positioned to target them to the communities most in need.
For example, the Native American Financial Services Association (NAFSA), a national, Native American–focused financial services association, sponsors a digital literacy program. Programs such as the Native Financial Education Initiative provide resources specifically to tribal leaders and promote best practices to increase financial literacy in these communities.
Why Is Financial Literacy Important?
Financial literacy refers to a person's ability to make sound financial decisions from day to day as well as to plan for the future. Without it, people struggle to make ends meet, to plan their finances, and to achieve economic well-being.
Moreover, those who are not financially savvy are most often targeted by scam artists and by marketers of money-making schemes that are just this side of illegal. Like computer literacy, financial literacy is increasingly needed to avoid bad actors.
Who Needs Financial Literacy?
Everyone. Increasingly, people are expected to understand and make decisions in a complex financial environment. That includes using credit cards, obtaining loans, investing money, and planning for retirement.
How Do I Acquire Financial Literacy?
A good place to start is by examining what's included in the National Financial Capability study . The study tests what's considered basic financial literacy. To test your knowledge, try FINRA's quiz . Then, focus on areas where your answers proved to be wrong.
If you look for the causes of the wealth gap, one major answer lies in unequal access to basic financial education. Financial literacy is obtained over time from one's family, high school, and employer. Studies show that minorities and women are more likely than others to lack the background they need to cope with an increasingly complex world.
Luckily, there are resources out there, many of them funded by the federal government and by non-profit groups. A good place to start might be an online financial literacy test such as the one developed by FINRA . Then follow up by exploring some of the online resources available to everyone who wants to make smarter financial decisions.
Milken Institute. " Financial Literacy in the United States ."
FINRA. " Insights: Financial Capability ."
Financial Industry Regulatory Authority. " 2021 Study Overview, The Financial Capability of U.S. Adults: Financial Knowledge Education ."
Financial Industry Regulatory Authority. " The State of U.S. Financial Capability: The 2018 National Financial Capability Study ." Page 35.
National Center for Education Statistics. " PISA 2018 Financial Literacy Results ." Select "How Does the Financial Literacy Performance of U.S. 15-Year-Olds Vary by Race/Ethnicity?"
Federal Deposit Insurance Corporation. " How America Banks: Household Use of Banking and Financial Services, 2019 Report ." Pages 12-13.
Federal Deposit Insurance Corporation. " How America Banks: Household Use of Banking and Financial Services, 2019 Report ." Page 6.
Financial Industry Regulatory Authority. " Race and Financial Capability in America: Understanding the Native American Experience ." Page 10.
University of Arizona Native Nations Institute. " The Financial Literacy of Native American Youth ," Page 4.
Federal Reserve Bank of New York. " Educational Comic Books ."
Financial Industry Regulatory Authority. " The State of U.S. Financial Capability: The 2018 National Financial Capability Study ." Pages 5-6.
Al-Bahrani, Abdullah and Weathers, Jamie. " Persistence of the Racial Financial Literacy Gap. Can Parental and Formal Financial Education Bridge the Gap? " American Economic Association , 2019, pp. 1.
Federal Reserve Bank of St. Louis. " How Do Americans Rate in Financial Literacy? "
Hamilton, Darrick and Darity, Jr., William A. " The Political Economy of Education, Financial Literacy, and the Racial Wealth Gap ." Federal Reserve Bank of St. Louis Review, vol. 99, no. 1, pp. 59-76.
Sholevar, Maryam and Harris, Laurence. " Women are Invisible?! A Literature Survey on Gender Gap and Financial Training ." Citizenship, Social and Economics Education , vol. 19, no. 2, July 2020, pp. 87-99.
American Communities Project. " On Financial Literacy, Slow Gains in Native American Lands ."
Al-Bahrani, Abdullah and Weathers, Jamie. " Persistence of the Racial Financial Literacy Gap. Can Parental and Formal Financial Education Bridge the Gap? " American Economic Association , 2019, pp. 1-31.
U.S. Department of the Treasury. " Financial Literacy and Education Commission ."
Burke, Jeremy and et al. " Can Educational Interventions Reduce Susceptibility to Financial Fraud? " Journal of Economic Behavior & Organization , vol. 198, June 2022, pp. 250-266.
TIAA Institute. " Financial Literacy, Longevity Literacy, and Retirement Readiness ."
U.S. Financial Literacy and Education Commission. " Annual Report to Congress Strategy for Assuring Financial Empowerment (SAFE) Report, FY 2022 ." Page 6.
U.S. Financial Literacy and Education Commission. " Annual Report to Congress Strategy for Assuring Financial Empowerment (SAFE) Report FY 2022 ."
U.S. Government Accountability Office. " A Federal Certification Process for Providers Would Pose Challenges ," Page 4.
Federal Deposit Insurance Corporation. " Resources: Money Smart ."
Native American Financial Services Association. " Welcome to NAFSA's Financial Literacy Program! "
National Congress of American Indians. " Native Financial Education Initiative ."
- The Ultimate Guide to Financial Literacy for Adults 1 of 30
- The Racial Gap in Financial Literacy 2 of 30
- How to Go From Unbanked or Underbanked to Banked 3 of 30
- How to Open a Checking Account Online 4 of 30
- Where Can You Cash Checks? 5 of 30
- Money Orders: When, Where, and How 6 of 30
- How to Read a Consumer Credit Report 7 of 30
- How To Build Credit When You Have None 8 of 30
- Debit Card vs. Credit Card: What's the Difference? 9 of 30
- Buy Now, Pay Later vs. Credit Cards 10 of 30
- How to Get Out of Debt in 8 Steps 11 of 30
- Student Debt: What It Means, How It Works, and Forgiveness 12 of 30
- Pros and Cons of Debt Management Plans 13 of 30
- How to File Back Taxes 14 of 30
- What You Should Know About Debt Relief 15 of 30
- Should You Save Your Money or Invest It? 16 of 30
- How to Save Money for Your Big Financial Goals 17 of 30
- Simple Interest vs. Compound Interest: What's the Difference? 18 of 30
- Generational Wealth: Overview, Examples and FAQs 19 of 30
- 10 Investing Concepts Beginners Need to Learn 20 of 30
- How to Invest on a Shoestring Budget 21 of 30
- What You Must Know Before Investing in Cryptocurrency 22 of 30
- What Is a Digital Wallet? 23 of 30
- Apple Pay vs. Google Wallet 24 of 30
- How Safe Is Venmo and Is It Free? 25 of 30
- What Can You Buy With Bitcoin? 26 of 30
- Best Resources for Improving Financial Literacy 27 of 30
- Personal Finance Influencer Red Flags 28 of 30
- Top 10 Personal Finance Podcasts 29 of 30
- Dial 211 for Help With Your Finances 30 of 30
:max_bytes(150000):strip_icc():format(webp)/RacialWealthGap-4b3536e8fe294279a6100161109d735f.jpeg "income inequality in the united states essay")
- Terms of Service
- Editorial Policy
- Privacy Policy
- Your Privacy Choices
The Changing Nature of Pollution, Income, and Environmental Inequality in the United States
This paper uses administrative tax records linked to Census demographic data and high-resolution measures of fine small particulate (PM2.5) exposure to study the evolution of the Black-White pollution exposure gap over the past 40 years. In doing so, we focus on the various ways in which income may have contributed to these changes using a statistical decomposition. We decompose the overall change in the Black-White PM2.5 exposure gap into (1) components that stem from rank-preserving compression in the overall pollution distribution and (2) changes that stem from a reordering of Black and White households within the pollution distribution. We find a significant narrowing of the Black-White PM2.5 exposure gap over this time period that is overwhelmingly driven by rank-preserving changes rather than positional changes. However, the relative positions of Black and White households at the upper end of the pollution distribution have meaningfully shifted in the most recent years.
Any opinions and conclusions expressed herein are those of the author(s) and do not reflect the views of the U.S. Census Bureau. The Census Bureau has reviewed this data product to ensure appropriate access, use, and disclosure avoidance protection of the confidential source data used to produce this product (Data Management System (DMS) number: P-7505723, Disclosure Review Board (DRB) approval numbers CBDRB-FY24-CES014-008, CBDRB-FY24-0075 and CBDRB-FY24-0116). We would like to thank Patrick Kline and Danae Hernandez-Cortes for helpful comments. The views expressed herein are those of the authors and do not necessarily reflect the views of the National Bureau of Economic Research.
MARC RIS BibTeΧ
Download Citation Data
Working Groups
More from nber.
In addition to working papers , the NBER disseminates affiliates’ latest findings through a range of free periodicals — the NBER Reporter , the NBER Digest , the Bulletin on Retirement and Disability , the Bulletin on Health , and the Bulletin on Entrepreneurship — as well as online conference reports , video lectures , and interviews .

Advertisement
Supported by
5 Things to Know to Understand India’s Economy Under Modi
As Prime Minister Narendra Modi seeks a third term, India’s growth has received the attention of the world’s investors but inequality has deepened.
- Share full article

By Alex Travelli
Reporting from New Delhi
Narendra Modi has big money behind him as he appears set to win a third term as India’s prime minister. His party has collected more political cash than the others combined, and the country’s richest business leaders support him.
The campaign is fueled partly by a winning story Mr. Modi tells about India’s economy, some of which can be traced to changes made during his decade in office. He has also benefited from geopolitical currents that have made India more attractive to global financiers. Here are five factors that are essential to understanding India’s economy. Elections will start on April 19 and conclude June 4.
India is big and getting bigger.
India, the world’s largest population , has been poor for centuries on a per person basis. But its economy has developed an undeniable momentum in the past three decades and is now worth $3.7 trillion. Size like that has its advantages: Even one percentage point of growth is monumental.
“Fastest-growing major economy” has become India’s signature in the past few years. In 2022 India became the fifth-largest economy — stepping over Britain. Even if it continues to grow at a relatively modest pace, it should overtake Germany and Japan to become the third-largest economy around 2030, behind only China and the United States.
The “India growth story,” as local businesspeople call it, is attracting a surge of excitement from investors, especially overseas. Under Mr. Modi, Indians are becoming more hopeful about their country’s economic future. As the economy gets bigger, even smaller rates of growth pile on huge sums of wealth.
Yet many facts of the Indian economy remain stubbornly in place. A large proportion of the work force toils on farms, for instance, and a relatively small part of it is employed in factories. Without better jobs , most Indians will be left waiting to taste this success.
There’s nothing like being in the right place at the right time.
Over the past 10 years, the rest of the world has given Mr. Modi opportunities to turn adversity into India’s advantage. He took office as oil prices were cut in half, a huge boost to the country because it relies heavily on imported crude .
The next few years were bumpier. Shocks caused by Mr. Modi’s boldest moves — an abrupt ban on bank notes and a big tax overhaul — were slow to be absorbed. By 2019 growth was slowing to less than 5 percent. Mr. Modi won re-election that year on the strength of a nationalistic campaign after brief border clashes with Pakistan.
When the Covid-19 pandemic came, it was cruel to India. During the first lockdowns, the economy shrank 23.9 percent. A 2021 wave pulled India’s health-care system into crisis.
India’s economic recovery then coincided with a supercharged enthusiasm by Western countries to tap India as an economic and strategic partner. The pandemic had exposed the world’s deep dependence on China as a supplier and manufacturer. And China’s heightened tensions with the United States, its own border clashes with India, and now its uncertain economic prospects inspired businesses and investors to look to India as a solution.
Build, baby, build: India shows off shiny new projects.
The most visible improvements to India’s economy are in infrastructure. Mr. Modi’s gift for implementation has helped build up capacity exactly where India has missed it most.
The building boom started with transportation: the railways, ports, bridges, roads, airports. India is remaking itself rapidly. Some of the developments are truly eye-catching and are laying the tracks for faster growth. The hope is that local businesses will start investing more where the government has lent its muscle.
Investment in India’s education and public health has been less meaningful. Instead, the government under Mr. Modi has aimed to make concrete improvements for ordinary Indians: bringing electricity to most remote villages, and drinking water and toilets to homes that lacked them.
Beneath the gleam, a digital powerhouse is built.
Less tangible but perhaps more significant has been India’s rapid adoption of what the government calls “digital public infrastructure.” This is a web of software that starts with Aadhaar, a biometric identification system established under Mr. Modi’s predecessor, Prime Minister Manmohan Singh. From unique digital identities, it has tied together access to bank accounts, welfare benefits and tax requirements.
This new organization of India’s data, combined with a dense and cost-effective mobile network, has brought efficiencies that grease the gears of commerce. India is proudly exporting the basic framework of its digital architecture to other countries.
Inequality deepens as old problems go unsolved.
Some of the Indian economy’s persistent ailments have been left to fester. Mr. Modi has tried and failed to fix things that plagued previous governments, like industrial policy, the broken agricultural markets and rules for land acquisition. What has become even worse under his government is the country’s vast inequality.
A study published last month by the World Inequality Database in Paris found that while the number of billionaires in India nearly tripled in the past 10 years, the incomes of most Indians were stagnant. The median income is still only $1,265 a year, and 90 percent of the country makes less than $3,900. When so many are left with so little, it is hard to see how domestic consumption will spur faster growth.
The Indian government is quick to reject most such reports; the underlying data is too thin, its economists say. But that’s partly because of the government’s own doing. For all of India’s digital innovation, deciphering what is going on in the country’s economic life has become harder. Under Mr. Modi’s government, fewer official statistics are published and some important data sets, such as those tracking household consumption, have been delayed and redesigned.
What’s more, institutions like think tanks and universities face legal and financial pressure to fall in line behind the government’s messaging.
Alex Travelli is a correspondent for The Times based in New Delhi, covering business and economic matters in India and the rest of South Asia. He previously worked as an editor and correspondent for The Economist. More about Alex Travelli
IMAGES
COMMENTS
The income inequality is one of the worse political and economic problems the United States faces (Piketty and Saez 1-3). It causes significant problems to social and political stability. It is also an indicator of national decline. Indeed, it is based on this premise that, this essay examines whether income inequality in America is a problem ...
This essay discusses economic inequality: its causes, measurement, and the potential impact of its growth in the U.S. economy. ... (BOG) allow us to measure how unequal the distributions of income and wealth are in the United States. Those data show that, since the 1970s, some individuals and families are earning much more income and ...
This report presents data on income, earnings, income inequality & poverty in the United States based on information collected in the 2021 and earlier CPS ASEC. Working Papers View More
The black-white income gap in the U.S. has persisted over time. The difference in median household incomes between white and black Americans has grown from about $23,800 in 1970 to roughly $33,000 in 2018 (as measured in 2018 dollars). Median black household income was 61% of median white household income in 2018, up modestly from 56% in 1970 ...
The United States has higher income and wealth inequality than almost all other developed countries. In the last 40 years, our inequality level has grown dramatically (Gottschalk & Danziger 2005; Piketty & Saez 2003, 2010; Western, Bloome, & Percheski 2008). Despite economic growth in the late twentieth
From 2015 to 2018, the median U.S. household income increased from $70,200 to $74,600, at an annual average rate of 2.1%. This is substantially greater than the average rate of growth from 1970 to 2000 and more in line with the economic expansion in the 1980s and the dot-com bubble era of the late 1990s.
The picture is much the same when looking at wealth—that is, total net worth rather than yearly income. In 2021, the top 10 percent of Americans held nearly 70 percent of U.S. wealth, up from ...
There has been a significant increase in income inequality in the United States since the 1980s following deliberate government policies to reduce tax rates and shrink social safety net programs. Today, 50% of all household income goes to the top 10% of earners, and only 13% goes to the bottom 50% of earners.
Introduction. It has been boldly predicted that the rise of income inequality in the United States of America will become one of the most complicated issues to resolve over the next ten to twenty years. According to the article by Sean McElwee, "the income share accruing to the top one percent increased from 9 percent in 1976 to 20 percent in ...
However, from 2016 to 2019 there was actually a small decline in inequality, with the top percentile share down by 1.4 percentage points, the Gini coefficient down by 0.008, and the mean wealth of the top 1 percent down by 1.9 percent. Another notable trend is the sharp increase in relative debt after 1983, with the debt-income and the debt-net ...
Against this background, this essay argues for lower income inequality following. ... Agarwal, V 2017, Income inequality in the United States of America, Crawford School . of Public Policy.
Capital income and education don't play as much as a role in these countries as in the United States. Citation Hoffmann, Florian, David S. Lee, and Thomas Lemieux. 2020. "Growing Income Inequality in the United States and Other Advanced Economies." Journal of Economic Perspectives, 34 (4): 52-78. DOI: 10.1257/jep.34.4.52
Key findings on the rise in income inequality within America's racial and ethnic groups. Income inequality - the gap in incomes between the rich and poor - has increased steadily in the United States since the 1970s. By one measure, the gap between Americans at the top and the bottom of the income ladder increased 27% from 1970 to 2016 ...
On average over 1989-2013, when using the direct SCF wealth information, the top ten percent owns 87.7% of household wealth (excluding pensions and main homes), the top one percent has 50.8%, and the top point one percent has 20.3%. When capitalizing income, the gures are 89.0%, 48.8%, and 20.7%, respectively.
April 12, 2013. The unprecedented level of economic inequality in America is undeniable. In an extended essay, Bill shares examples of the striking extremes of wealth and poverty across the ...
If you need immediate assistance, call 877-SSRNHelp (877 777 6435) in the United States, or +1 212 448 2500 outside of the United States, 8:30AM to 6:00PM U.S. Eastern, Monday - Friday. In this paper we investigate the evolution of income inequality in the United States between 1980 and 2016. We find the drivers to be threefold: changes in the.
Second, even if economic inequality is not a problem in and of itself, it can still have bad effects. Great disparities of income and wealth, of the kind we see in the United States today, can ...
Income inequality has been increasing in the United States since the 1970s, peaking in 2013 3 (Figure 1). A 2015 Gallup poll found that 63 percent of Americans feel that the distribution of U.S. money and wealth is unfair. 4 While many factors contribute to income and wealth inequality, the role of education is a key piece of the puzzle. Figure ...
Piketty, Thomas and Emmanuel Saez. "Income Inequality In The United States, 1913-1998," Quarterly Journal of Economics, 2003, v118 (1,Feb), 1-39. Founded in 1920, the NBER is a private, non-profit, non-partisan organization dedicated to conducting economic research and to disseminating research findings among academics, public policy makers ...
Income Inequality in the United States. This essay sample was donated by a student to help the academic community. Papers provided by EduBirdie writers usually outdo students' samples. Within every population, there is a discongruity as to how much a citizen will earn inside of their economy. They are experiencing income inequality.
Nearly 160 years after the end of slavery, significant disparities persist between Black and white Americans. This column studies the long-run effects of slavery, and the Jim Crow laws that enforced racial segregation following the Civil War, on Black Americans' economic outcomes. Those whose ancestors were enslaved until the Civil War have less education, income, and wealth than Black ...
The third essay distinguishes the proportion of the overall inequality that is due to pre-determined conditions of an individual. Chapter 1: The Source of Income Inequality in the United States. The measurement of income inequality has been a focus of considerable study. However, the determinants of income inequality are still unclear.
In the year 2010, there were 404 billionaires in the United States. By 2024, that number had nearly doubled to 756. This expansion of income inequality has reached every level of society, and as inflation drives up prices, many people are struggling to afford housing.
The first focuses on the bottom 20 percent of households by income and suggests an actual reduction in inequality. The point is that through increased government transfers, the bottom has actually ...
Since 1940, the South has outperformed the rest of the US in income, job and construction growth, finally reaching about 90 per cent of national per-capita income norms. It has also remained critically behind in multiple important infrastructural and development measurements, from education and transit to poverty levels and healthcare.
On the other hand, income inequality refers to the uneven distribution of income among the population and therefore increasing the gap between the wealthiest individuals and everyone else in the country. The income disparities in the United States have been growing considerably as predicted by statistical measures in the last thirty years.
At the same time, White Americans experienced an unexpected reduction in income of 21%, as did Hispanic Americans, while Asian Americans dropped 19% and Black Americans 12%. Women were less likely ...
The Changing Nature of Pollution, Income, and Environmental Inequality in the United States. Jonathan M. Colmer, Suvy Qin, John L. Voorheis & Reed Walker. Working Paper 32060. DOI 10.3386/w32060. Issue Date January 2024. This paper uses administrative tax records linked to Census demographic data and high-resolution measures of fine small ...
The median income is still only $1,265 a year, and 90 percent of the country makes less than $3,900. When so many are left with so little, it is hard to see how domestic consumption will spur ...